Lee, Dennis and Yue, Hong and Yu, Jun and Marshall, Stephen (2012)
Identification of complex biological network classes using extended
correlation analysis. In: Advanced control of chemical processes.
International Federation of Automatic Control (IFAC), New York, pp.
457-462. ISBN 9783902823052 ,
http://dx.doi.org/10.3182/20120710-4-SG-2026.00071
This version is available at https://strathprints.strath.ac.uk/42726/
Strathprints is designed to allow users to access the research output of the University of Strathclyde. Unless otherwise explicitly stated on the manuscript, Copyright © and Moral Rights for the papers on this site are retained by the individual authors and/or other copyright owners. Please check the manuscript for details of any other licences that may have been applied. You may not engage in further distribution of the material for any profitmaking activities or any commercial gain. You may freely distribute both the url (https://strathprints.strath.ac.uk/) and the content of this paper for research or private study, educational, or not-for-profit purposes without prior permission or charge.
Any correspondence concerning this service should be sent to the Strathprints administrator: [email protected]
The Strathprints institutional repository (https://strathprints.strath.ac.uk) is a digital archive of University of Strathclyde research outputs. It has been developed to disseminate open access research outputs, expose data about those outputs, and enable the
Identification of Complex Biological Network Classes
using Extended Correlation Analysis
D. P. Lee*, H. Yue*1, J. Yu**, S. Marshall*
*Department of Electronic and Electrical Engineerin University of Strathclyde, Glasgow, G1 1QE, UK (email: dennis.lee, hong.yue, [email protected])
**Strathclyde Institute of Pharmacy and Biomedical Sciences, University of Strathclyde, Glasgow, G4 0RE, UK (email: [email protected]) 1 Corresponding author
Abstract: Modeling and analysis of complex biological networks necessitates suitable handling of data
on a parallel scale. Using the IB-NF-B pathway model and a basis of sensitivity analysis, analytic methods are presented, extending correlation from the network kinetic reaction rates to that of the rate reactions. Alignment of correlated processed components, vastly outperforming correlation of the data source, advanced sets of biological classes possessing similar network activities. Additional construction generated a naturally structured, cardinally based system for component-specific investigation. The computationally driven procedures are described, with results demonstrating viability as mechanisms useful for fundamental oscillatory network activity investigation.
Keywords: oscillatory systems, sensitivity analysis, cellular networks, signal correlation.
1. INTRODUCTION
Treatment of nonlinear biological signal transduction pathway (Bell et al., 1978), oscillatory and equilibrium component activity (Kruse and Julicher, 2005), using currently available engineering analysis tools (Pfau et al., 2011), has proven to be successful in recognising specific components and activities acting with the greatest impact within a system (Jia and Yue, 2008). The complexity of interacting biological systems (Basak et al., 2008; Ihekwaba et al., 2005) demands an extension to available techniques, in order to better provide access to more detailed biological information (Ravalico et al., 2005; Trocine and Malone, 2000), with an across-the-board provision where possible, of high-impact elements. To this end, parallel extensions to biological model investigation methodology are made available via developed suites of computationally-assisted, systematic analysis. Provision of access to the same, in conjunction with iterative biological wetlab investigation and validation, engenders the definition of systems compatible, versatile methods of examination, validation and benchmarking of modelled complex network pathways. In this work, the basis for investigation is the conjunction of sensitivity analysis (Turányi, 1990) and correlation measurement (Burton, 2010; Skoog et al., 2007). Sensitivity analysis can be performed in local terms, through small changes in the appropriate parameters, or global terms via simultaneous, relatively large, or abrupt changes in the corresponding system. The ability of sensitivity analysis to cope with modelled systems has led to its use in disciplines such as parameter estimation, model simplification, and experimental design (Yue et al., 2008). Correlation, a measure of the interdependence of elements is provided by the Pearson product moment correlation (PEAR) coefficient (Rodgers and Nicewander, 1988). Adaptation of PEAR using
thresholded correlation error handling and (computational) component sorting allows access to a naturally defined, cardinally-based structure, ideal for biological measure. The proposed technique, kinetic reaction rate (rate reaction) correlation tabulation (KRReCt), delivers extension from linearly-correlated kinetic reaction rates to that of parallel activity-associated rate reactions. Further processing of the same generates a group of interrelated biological interactions operating with an impact exceeding that of the relative sensitivity performance coefficients, a recognised and popular engineering performance measure.
The protein NF-B, an early transcription agent (Ghosh et al.,
1999), is a fundamental component of the IB-NF-B
signaling pathway (Perkins, 2007), acting in response to environmental and biological stress, and bacterial and viral infection. It operates to combat, problems in the immune system, tumorous activity, chronic inflammation and cancers, whilst also regulating day-to-day cellular reprocessing (Basak et al., 2008). The biological network used to validate the logistic synthesis of sensitivity analysis and correlation measurement is the 24 protein concentration, tumor necrosis factor- (TNF-) stimulated, IB-NF-B model with 64 kinetic parameter reaction rates (Hoffmann et al., 2002). The system was modelled using 24 ordinary differential equations (ODEs) generated through application of the law of mass action (Yue et al., 2006).
2. RELATIVE SENSITIVITY ANALYSIS
A general ODE model describing the dynamics of biochemical systems can be written as
f , t
x x (1)
where xn represents protein concentrations and m
describes the kinetic parameter rates, n is the number of
state variables, m is the number of parameters and t stands
for time. In general, the function f
is nonlinear, with initial states vector x0x
t0 . This allows denotation of theth
i state variable of x as xi and the jth reaction rate of as
,
j
k from which the absolute sensitivity matrix is formed as
,
S x with each element si j, x ki j. For empirical
calculations, in order to aid standardization and compatibility, the relative sensitivity
,
, i j i j
j i
s x k
k x x x S (2)
is used instead.
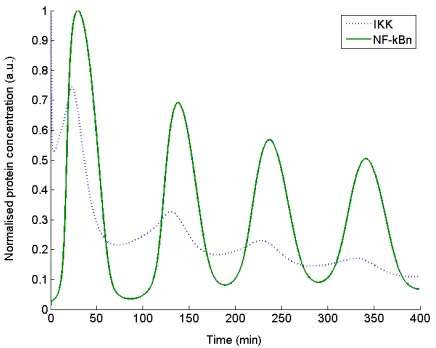
For the TNF- stimulated, IB-NF-B model, dynamic
generation of relative sensitivities was conducted via direct differential method (Turányi, 1990). Initial model conditions were followed and validated from our earlier work (Yue et al., 2006), with NF-B x2 started at 0.1( mol/L) from time
0,
t during an initial run to the equilibrium states of
2000
T minutes. Following this, the dynamic activator
stage species IKK x10 was initialized at 0.1 ( mol/L) for a
total dynamic time length of 400 minutes. The time response
profiles of the activator IKK x10 and NF-Bn x15 are detailed in Fig. 1. Numerical implementation utilized a fixed sampling time of 1 sample per minute over the 400 minute
dynamic time-course, producing N400 sampling points.
Fig. 1 Normalised oscillatory time response profiles of the
modelled biological pathway activator IKK (x10) (dotted) and
NF-Bn (x15) (solid).
3. CRITICAL POINTS CONSTRUCTION
A dimensional analysis of parameter reaction rates and consideration of oscillatory system energetics, contained in a larger work, indicates that ‘biological work’ conducted in the model is proportional to the magnitude of the relative sensitivity. For an oscillatory system (including limit-cycle and damped oscillations), each parameter sensitivity profile is also oscillatory, containing (local) maxima and minima. The aforementioned prompts examination of the critical points, i.e. the oscillatory peak and trough time-points at which the first-order time derivative of the relative sensitivity response is zero. Considering each relative sensitivity coefficient si j, , we
compute time-points coinciding with, or closest to, the local maxima and minima, using modified epsilon-delta notation, as the set of time-points
, ,
d
, d
: min , 0
i j q N i j
s t
t
q t q
(3)
where q is the time instance of sampling and N the total number of sampling points. Within the range of simulation time, i j, groups all the time points corresponding to peaks
and troughs in si j, . Each parameter rate kj indexes a row of
time-point components, column-indexed in ascendance,
1 2
, , v, ,
i j i j i j
by some value of . Hence, we can
list each row of time-points in ascending order into p
distinct columns 1
, ,
1 i j i jv p, where ri jr, ,
1 r p, is the number of elements i jr, in the jth row, for
p the smallest non-negative integer delivering an optimal
engineering and biological analytic length, and some of the list elements may equal zero. When dealing with appropriate biological models and occasionally chemical models, we denote the corresponding p-listed local limit point critical
(LOC) time-point elements by i jr, . This allows construction
of the nonnegative LOC time-point matrix
1 2
,1 ,1 ,1
1 2
,2 ,2 ,2
,
1 2
, , ,
.
p
i i i
p
r i i i
i j
p i m i m i m i
(4)for fixed i. The above matrix is arranged in such a way that
each row corresponds to a parameter kj, and each column
corresponds to a time-point i jr, in which at least one LOC
point is identified from the set of all parameters. Therefore, regarding each column of listed time-points, when no maxima or minima are identified in respect of the associated parameter, the component in the corresponding position is set equal to zero. Ideally, allocation of a small proportion of
matrix components and the subsequent choice of value p,
should be assisted by a biologist knowledgeable in the respective field. Such assistance will increase the likelihood of securing a correct value. Computation was further assisted 8th IFAC Symposium on Advanced Control of Chemical Processes
Furama Riverfront, Singapore, July 10-13, 2012
[image:3.595.53.271.529.703.2]through the programmed exclusion of systematic type-1 and type-2 errors.
4. CORRELATION ERROR THRESHOLDING In order to determine interrelation of the various rows of the LOC point components, we require a index as to measure
how much the associated LOC column elements r,
i j
change
together as time progresses. Here we begin the investigation of column vector interdependence via the PEAR
coefficient X Y, . PEAR utilizes a measure of covariance
normalized by the product of the component element’s standard deviation , so that for any two (column) vectors
Xand Y, the correlation coefficient between them is
E E E
,
X,Y
X Y
X X Y Y
(5)
where E
is the expectation operator.The use of PEAR at a correlation error threshold (CET) of
2 % for some suitably small value of , describes a
solution acceptance bounded range of
100
%X Y, ,
100
%X Y, for each vector column element in a matrix.Any LOC time-point falling in the 2 correlation error range
of the time-point, will be contained in related time-point solution groups. This means the LOC points generated can be
aligned along specific r-indexed columns, in ascendance
,1 ,2 , , ,
r r r r
i i i j i m
with some of the elements i jr,
possibly being equal to zero.
Components of the LOC matrix can now be correlated in terms of the similarity of CET generated, column-aligned, LOC time-point row structure. The action of CET then extends a gauged statistical response from that of a single
reaction rate statistic to multiple sets of grouped
column-orientated rate reaction LOC points together describing the
single row kj addressed rate reaction. Defining the action
of correlation via comparing and collation of similarly structured rows, rather than isolated data points is approximately equivalent to set selection via low entropy analysis (Heikinheimo et al., 2009). The generation of similar row-structured LOC points increases the probability of detecting existence of groups possessing the same or similar biological activities.
Collecting together, recursively, all rows in the LOC time-point matrix containing time-time-point elements i jr, of equal
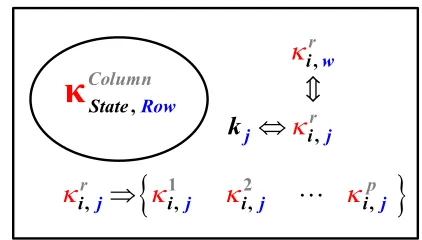
value (and removing any copies), allows the construction of a single superset. Such a superset will contain all or some other number of elements in-between. Repeating this procedure with any elements not already in a superset, generates a set of superset-formed elements, each set elements of which are mutually exclusive to the other supersets. The relationship of reaction rates kj to superset produced LOC points i jr, is
indicated in Fig. 2.
,Ro
C
State w
olumn
r,j i j
k
ir, j
1i, j
i2, j
ip,j
,
[image:4.595.321.532.69.189.2]irw
Fig. 2 Interrelationship of kinetic parameter rates kj and
their row-addressed LOC point elements i jr, . In the rth
column, a number of the time-point set elements
i jr,addressed by each parameter rate kj row, may possess LOC
times equal to other LOC time-points i wr, , in different rows.
Intersection of the parameter rate kw row elements and
removal of any repeated elements, generates a superset of related components. The superset generation formed from
specific columns r, then develops groups of LOC CET
related rate reactions.
We now demonstrate the validity of the grouping approach. An indeterminate solution acceptance bounded range was defined earlier via CET, for which LOC time-point rows possessing similarly timed responses is valid; hence the activities of kinetic rate reactions corresponding to grouped
j
k -addressed CET-grouped rows all take place at around the
same time. Generation of temporally structured and grouped LOC points then increases identification of grouped components possessing similar activities, or able to act in unison at specific time points during a biological process. Where results are returned, each group of elements can then be considered as ‘approximately related biological activities’.
5. KINETIC REACTION RATE CORRELATION TABULATION (KRReCt)
5.1 Biological Equivalence Classes (BECs)
Biology, by virtue of its numerous isoforms, coactivators, enzymes and similar, engenders the possibility of grouping together components acting in a comparable manner, or possessing like qualities. The ability to partition elements in the manner of that earlier described, ‘approximately related biological activities’, is similar to the action of an equivalence relation (Boolos et al., 1989). Here ‘approximate’ is intended to mean that, not all of the component activities indicated in any equivalence related biological model sets, may be true in the formal biological sense.
Given a binary relation ~ on a set A, A is said to be an
equivalence relation if and only if the elements in the set A
whence similar symmetric element image and ranges are related to differing ranges and images respectively, producing the desired relationship. An equivalence relation partitions sets of elements into disjoint subsets termed equivalence classes. A setoid is a set with an equivalence relation
(Palmgren, 2010). The equivalence class of the setoid
A, ~
is defined to be
A ~
. Since it is difficult to define modelled biological data in this strict manner, here we infer only the approximate action of partitioning by modelled biological equivalence class (BEC)
A~.We denote an approximate set containing all of the kinetic rate reactions described by each row of the kj- addressed
sets of LOC points by A. The biological equivalence relation
partitions the set A into a number of disjoint BEC subsets
, , . Where a test of correlation can be extended to
include an approximate equivalence relation, it may then be possible to link appropriate relationships by maximum (minimum) activity of activation or deactivation and corresponding component timing.
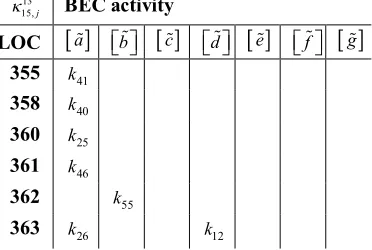
Respecting the potential redundancy of approximated equivalence classes, then where a test of extended correlation includes an approximate equivalence relation constructed through superset intersection in the manner of Fig. 2, it will be possible to link model components through local maximum (minimum) relative sensitivity activity, via their corresponding LOC time-points. This means that each BEC is likely to define one or more specific LOC time-point related biological activity(ies) or operations. BECs can be tabulated as indicated in Table 1, taken from the NF-B model, with ascending LOC point timing addressing the
0.2% CET superset intersecting elements of seven
formulated BEC columns.
Table 1 A section of a BEC table from the seven BECs formulated, with LOC point timing from 355 min to 363 min.
The 0.2% CET entries kj can be viewed as reaction rates, or
rate reactions. BEC
a deals with the 2-bodycomplementary activity of association and dissociation, supplying eight reactions and (possibly) a single activator/catalyst for the same.
In this NF-B model with damped oscillations, it was noted
that ordering in ascendance of the final column of LOC points had a tendency to produce alignment in the majority of
earlier columns. Although modelling problems existed with respect to regulation of IKK x10 , through k61 IKK slow adaptation, and high levels of IB isoforms (O’Dea et al., 2007), simulation results supported and emphasised the BEC formulation: BEC
a delivers four pairs of complementary2-body association/dissociation reactions, plus what might be an activator or catalyst for the same; BEC
c deals withIB and NF-B and is implicated in the maintaining of oscillatory activity; BEC
g uses 7 of 9 sinks and includesjoint IKK/NF-B trimerization with IB and IB , possibly
related to an activating pathway by way of k55 IKK-IB
NF-B association; BEC f contains all of the export reactions
and includes 9 reactions paired through association/
dissociation or other biologically complementing activities; BEC b comprises entirely of IB and IB reactions and
might constitute something similar to pathway timing or regulation; BEC d contains the two components,
12
k
IKKIB-NF-B catalysis and k57 IB-NF-B nuclear
export, which may be related to a specific IB- process; and
BEC
e houses the two single group reactions (rates) k28IB inducible mRNA synthesis and k63 IKK-IB catalysis.
For details please contact the authors for a complete BEC grouping table and associated conditions
5.2 General KRReCt Tables
Paying regard to the interrelations indicated in Fig. 2, it is evident that inspection and analysis of generated CET LOC point activity can be conducted through the addressing of intersecting supersets of kj-addressed LOC point sets by a
column of time-aligned LOC points, where such exist. An ideal situation demands that all possible LOC time-points are present, whence a full column is then in a position to address data, thereby increasing the potential data yield. The returned number of LOC points will be smaller, per unit time, for a less oscillatory model, or one that reaches equilibrium early during its course of dynamic generation.
Additional alignment promoting kinetic reaction sequential comparison properties in conjunction with the displaying of ascending BECs can be generated through the referencing of
grouped BEC elements by any of the
r
unique alignedcolumns of elements i jr, . Consider for example the rth
column of LOC points i jr, . Where the number of LOC
points in this column is equal to m, then we can form an ascending list of the LOC points i jr, top to bottom, retaining
only the first of any repeated elements, whilst keeping all of the subsequently addressed BEC kinetic rate reactions
(reaction rates) .kj Otherwise, when the number of positive
elements in this column is less than m,we can list the LOC
elements in the same manner but beginning with some gaps.
Using the ascending list of LOC points, the m aligned
respective BEC kinetic rate/reaction elements
13 15,j
BEC activity
LOC
a b
c d
e f
g355 k41
358 k40
360 k25
361 k46
362 k55
363 k26
12
k
8th IFAC Symposium on Advanced Control of Chemical Processes Furama Riverfront, Singapore, July 10-13, 2012
[image:5.595.74.260.585.710.2]
, , ,
, jk can be formed in a table. Such a
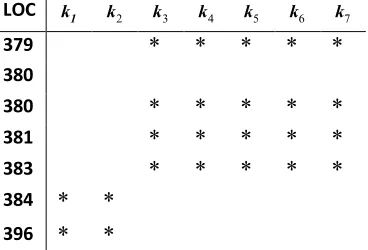
table with LOC points addressing BEC kinetic reactions/rates is termed a kinetic reaction rate correlation (KRReCt) BEC table or simply a BEC table. A section of a KRReCt table,
formed by the NF-B model, using the LOC time-point range
379 min to 396 min, is detailed in Table 2.
Table 2 A section of the NF-B model KRReCt table
using the first seven kinetic parameters, with LOC point
timing from 379 min to 396 min. The
2 0.2 %
superset CET entries kj shown as asterisks, can be viewed as
kinetic rates or reactions.
An examination of the LOC point time alignment for this
NF-B model indicates in general, an assortment of compact,
regular blocks of activity, rather than a random scattering of
elements. Detailed temporally-assisted analysis generated 23
blocks of activity, taking place in temporal cascade, or along parallel LOC time points, which might be of interest to biologists. A fundamental analysis of the KRReCt table indicated that k55, IKK-IB NF-B association, is an I
B-NF-B pathway activator and possible regulator, a synopsis
also forwarded following a wetlab study (Rao et al., 2010).
5.3 Rationalizing KRReCt activity
For error thresholds of the correct order and suitably complex models, similar component activity can take place during any LOC time-points. Subsequent respective superset representation of CET KRReCt elements is then susceptible to detection using BEC analysis by virtue of the property of approximate equivalence classes. Performance criteria for the analysis of complex biological networks, such as the relative sensitivity coefficients, have been found to deliver biologically valid results at suitable thresholds of the order of
90%.
(Yue et al., 2006; Jia and Yue, 2008).
PEAR correlation of the relative sensitivity provides a measure of the strength of response using interval-level, rather than ratio-level data (Tandy, 1998; Stevens, 1946). The interval-level data can be recognised as being biological model categorical data using the category ‘relative sensitivity response’. BEC sorting of components provides another categorical data type, the category in this case being ‘temporally aligned, sorted relative sensitivity response, LOC time-points’, adding significance to the measure of strength. An analysis of the two categorical data type sets was
conducted and shown in Fig. 3 and Fig. 4 in the Euler diagram form (Fish and Flower, 2008).
A comparison of component elements in the intersection of PEAR CET at three increasing levels of correlation, and their contained percentage of BEC-listed elements (Fig. 3)
indicates that as the 100% threshold is approached, the two
sets converge and become the same set of elements. The convergence of the BEC-listed elements to the CET relative sensitivity elements, at appropriately high threshold levels of correlation, supports the use of BEC components. Then comparing the complete set of BECs with the intersection of PEAR CET relative sensitivity contained within the same, at
the three percentage thresholds (Fig. 4), the 99.9% threshold
indicates that a large proportion are precisely the same elements. In addition, both comparisons demonstrate a
drop-off as the threshold reduces to 90%; this might be viewed as
[image:6.595.77.261.225.350.2]a relatively constant level of ‘model biological noise’ caused through CET matching of relative sensitivity magnitudes.
Fig. 3 PEAR CET relative sensitivity at 90%, 99% and
[image:6.595.305.520.298.399.2]99.9% (clear), and the % BEC-listing components (black).
Fig. 4 Complete BEC listing (black) with
corresponding intersection of 90%, 99% and 99.9% PEAR CET relative sensitivity components.
The simplified graphical results shown demonstrate the initial larger PEAR set of correlated components (Fig. 3) at
correlation levels of 99.9% and 99% have related
components contained within the sorted BEC sets in Fig. 4, at the same correlation levels. It is evident that the BEC set can be derived from a sorted PEAR CET relative sensitivity set, but in Fig. 4, the BEC set contains more of the processed elements. The logical implications in respect of oscillatory systems, again indicates that correlation of BEC sorted components vastly outperforms PEAR correlation in terms of significance, whilst retaining the initial strength. Further, the BEC-listed set has a correlation error bound, more than 1 order smaller than the PEAR CET relative sensitivity bound and the set of starting elements are virtually identical; the
LOC k1 k2 k3 k4 k5 k6 k7
* * * * *
* * * * *
* * * * *
* * * * *
* *
* *
BEC
RS
RS
[image:6.595.304.548.443.586.2]logical implications in this case, imply, that as the suitably low CET relative sensitivity set provides an accurate indication of those parameters having the greatest impact in a model, the BEC-listed set, which is contained within the relative sensitivity set, should provide at least the same impact throughout its entirety. Hence the KRReCt table should provide modelled biological information tending towards accuracy, throughout its domain.
6. CONCLUSIONS
Analysis of complex signal transduction pathways via method of KRReCt should prove to be a useful tool, extending investigation and validation to the realm of parallel component activity. Justification for use of the two tabulation techniques forwarded, KRReCt and BECs, the latter of which outperforms PEAR correlation per se, has been clarified, with the same demonstrating network abilities as yet unrealised. The BEC technique, by virtue of its sorting abilities, is likely to provide a basis for extrapolation of biological component activity outside of the hardwire dedicated network. The integration of sensitivity analysis, KRReCt and BECs provides a systematic analysis of temporal biological network activities. Future exploration will include formal serial and parallel software development alongside wetlab-associated research in order to discover its analytic strength.
ACKNOWLEDGEMENTS
DL acknowledges the support by UK’s EPSRC DTG programme. HY thanks Chinese NSFC support 61004045.
REFERENCES
Basak, S., Shih, V. F. and Hoffmann, A. (2008). Generation and Activation of Multiple Dimeric Transcription Factors
within the NF-kB System. Molecular & Cellular Biology,
28, 3139-3150.
Bell, G. H., Emslie-Smith, D. and Paterson, C. R. (1978).
Textbook of physiology and biochemistry. Churchill Livingstone, New York.
Boolos, G. S., Nurgess, J. P. and Jeffrey, R. C. (1989).
Computability and Logic. Cambridge University Press, New York.
Burton, D. M. (2010). Elementary Number Theory. McGraw
Hill Higher Education.
Fish, A. and Flower, J. (2008). Euler Diagram
Decomposition. 5th International Conference on
Diagrammatic Representation & Inference, 28-44. Ghosh, G., Huan, D. and Huxford, T. (1999). Structural
insights into NF-kB/IkB signaling. Gene Therapy &
Molecular Biology, 3, 75-82.
Heikinheimo, H., Vreeeken, J., Siebes, A. and Mannila, H.
(2009). Low-Entropy Set Selection. Proceedings of SDM,
569-580.
Hoffmann, A., Levchenko, A., Scott, M. L. and Baltimore, D.
(2002). The IB-NF-B signaling module: temporal
control and selective gene activation. Science, 298,
1241-1245.
Ihekwaba, A. E. C., Broomhead, D. S., Grimley, R. L., Benson, N., White, M. R. H. and Kell, D. B. (2005).
Synergistic control of oscillations in the NF-kB
signalling pathway. IEE Proceedings - Systems Biology,
152, 153-160.
Jia, J. and Yue, H. (2008). Model Simplification of Signal Transduction Pathway Networks via a Hybrid Inference
Strategy. Proceedings of the 17th IFAC World Congress,
10307-10312.
Kruse, K. and Julicher, F. (2005). Oscillations in cell biology.
Current Opinion in Cell Biology, 17, 20-26.
O’dea, E. L., Barken, D., Peralta, R. Q., Tran, K. T., Werner, S. L., Kearns, J. D., Levchenko, A. and Hoffmann, A. (2007). A homeostatic model of IkB metabolism to
control constitutive NF-kB activity. Molecular Systems
Biology, 3, 1-7.
Palmgren, E. (2010). Sets, Setoids and Groupoids. Workshop
on Constructive Aspects of Logic & Mathematics, Kanazawa.
Perkins, N. D. (2007). Integrating cell signalling pathways
with NF-kB and IKK function. Nature Reviews
Molecular Cell Biology, 8, 49-62.
Pfau, T., Christian, N. and Ebenhöh, O. (2011). Systems approaches to modelling pathways and networks.
Briefings in Functional Genomics, 10, 266-279.
Rao, P., Hayden, M. S., Long, M., Scott, M. L., West, A. P., Zhang, D., Oeckinghaus, A., Lynch, C., Hoffmann, A., Baltimore, D. and Ghosh, S. (2010). IkBb acts to inhibit and activate gene expression during the inflammatory
response. Nature, 466, 1115-1120.
Ravalico, J. K., Maier, H. R., Dandy, G. C., Norton, J. P. and Croke, B. F. W. (2005). A comparison of sensitivity analysis techniques for complex models for
environmental management. International Congress on
Modelling & Simulation, 2533-2539.
Rodgers, J. L. and Nicewander, W. A. (1988). Thirteen Ways
to Look at the Correlation Coefficient. American
Statistical Association, 42, 59-66.
Skoog, D. A., Holler, F. J. and Crouch, S. R. (2007).
Principles of Instrumental Analysis. Brooks & Cole. Stevens, S. S. (1946). On the Theory of Scales of
Measurement. Science, 103, 677-680.
Tandy, R. D. (1998). Technical Note: The initial stages of statistical data analysis. Journal of Atheletic Training, 33, 69-71.
Trocine, L. and Malone, L. C. (2000). Finding important independent variables through screening designs: A
comparison of methods. Proceedings of the 2000 Winter
Simulation Conference, 749-754.
Turányi, T. (1990). Sensitivity analysis of complex kinetic
systems tools and applications. Journal of Mathematical
Chemistry, 5, 203-248.
Yue, H., Brown, M., He, F., Jia, J. F. and Kell, D. B. (2008). Sensitivity analysis and robust experimental design of a
signal transduction pathway system. Int. J. Chem. Kinet.,
40, 730-741.
Yue, H., Brown, M., Knowles, J., Wang, H., Broomhead, D. S. and Kell, D. B. (2006). Insights into the behaviour of systems biology models from dynamic sensitivity and identifiability analysis: a case study of an NF-kB
signalling pathway. Molecular Biosystems, 2, 640-649.
8th IFAC Symposium on Advanced Control of Chemical Processes Furama Riverfront, Singapore, July 10-13, 2012