Rochester Institute of Technology
RIT Scholar Works
Theses Thesis/Dissertation Collections
11-14-2011
RNA-Sequencing analysis from the triceps muscle
of normal and myostatin-deficient mice using
various tools
Richard RodriguesFollow this and additional works at:http://scholarworks.rit.edu/theses
This Thesis is brought to you for free and open access by the Thesis/Dissertation Collections at RIT Scholar Works. It has been accepted for inclusion in Theses by an authorized administrator of RIT Scholar Works. For more information, please [email protected].
Recommended Citation
RNA-Sequencing analysis from the triceps muscle of normal
and myostatin-deficient mice using various tools
Richard Rodrigues
Master of Science in Bioinformatics
Department of Bioinformatics College of Science
Rochester Institute of Technology
Approved on November 14th, 2011
This thesis is dedicated to my loving family, to my
parents who supported and encouraged me throughout
my life, my brother and my girlfriend who have always
DISSERTATION AUTHOR PERMISSION STATEMENT
TITLE OF THESIS:
RNA-Sequencing analysis from the triceps muscle of
normal and myostatin-deficient mice using various tools
Author: Richard Rodrigues
Degree: Masters
Program: Bioinformatics
College: College of Science, Rochester Institute of Technology
I, Richard Rodrigues, understand that I must submit a print copy of my thesis or dissertation to the RIT archives, per current RIT guidelines for the completion of my degree. I hereby grant to the Rochester Institute of Technology and its agents the non-exclusive license to archive and make accessible my thesis or dissertation in whole or in part in all forms of media in perpetuity. I retain all other ownership rights to the copyright of the thesis dissertation. I also retain the right to use in future works (such as articles or books) all or part of this thesis or dissertation.
_________________________ Richard Rodrigues
ACKNOWLEDGEMENTS
I feel immensely happy and privileged to finish my Masters of Science degree from the Rochester Institute of Technology. Coming to the United States was the first time I had been outside my home country India and RIT made my stay a memorable experience. The thesis marks an end to the wonderful two years I spent here, and many of the people I encountered made the time more comfortable and certainly special.
A special thanks to Dr. Stephen Welle from the University of Rochester and his team Arnold Walker and Chin Yi Chu for providing the data and guidance during my thesis. I would like to express my sincere thanks to Dr. Gary Skuse, Dr. Vicente Reyes and Dr. Michael Osier for their timely help and support throughout my Masters.
I would also like to thank Illumina, Inc. and Partek, Inc. for providing me with their software and technical support during my thesis.
I would like to thank Dr. Gurcharan Khanna and Ralph Bean of RIT Research Computing for allowing and helping me to use their advanced computation resources. I would also like to thank Nicoletta Bruno Collins for her help with the academic formalities. I would like to thank my Professors, faculty, family and friends for their assistance.
ABSTRACT
RNA-Sequencing technologies are being used to determine the single nucleotide polymorphisms, insertions, deletions and gene expression. The purpose of this study was to analyze the effect of myostatin in the triceps muscles of mice using 65 bases single-end RNA-Sequencing data from the Illumina platform. Another aim was to analyze alternat ive splicing events for differentially expressed genes in the above data. Finally, commercially available and open source software packages were compared for their splice junction detection abilities.
CASAVA was used for determining the exon, gene and splice junction counts. Partek Genomic Suite was used to perform a two-way analysis of variance followed by the identification of differentially expressed genes. The splicing events were identified using the software packages CASAVA, TopHat, MapSplice and SpliceMap. The results of splice junction detection were viewed in the UCSC genome browser. The performance and features of the above software were compared.
Contents
INTRODUCTION ... 1
1. Gene expression... 1
2. DNA/RNA sequencing ... 2
3. Illumina/Solexa technology ... 3
4. Motivation ... 5
5. Sequence analysis tools ... 6
5.1 CASAVA ... 6
5.2 Bowtie ... 8
5.3 TopHat... 8
5.4 MapSplice ... 9
5.5 SpliceMap ... 10
6. Data source ... 10
MATERI AL AND MET HODS ... 12
To analyze RNA sequencing data from the Illumina platform using CASAVA... 12
1.1. DEMULTIPLEXING COMMAND 1 ... 12
1.2. DEMULTIPLEXING COMMAND 2 ... 13
1.3. CONFIG FILE TO DEFINE PARAMETERS ... 16
1.4. GERALD COMMAND 1: creating directories and files necessary for the alignment .. 17
1.5. GERALD COMMAND 2: run command from newly created GERALD directory ... 19
1.6. VARI ANT DETECTION COMMAND... 21
To analyze alternative splicing events in the data using software like CASAVA, TopHat, MapSplice and SpliceMap... 23
2.1. CONFIG FILE to create FASTA formatted reads ... 23
2.2. TopHat ... 24
2.3. SpliceMap ... 27
2.4. MapSplice ... 31
RESULTS AND DISCUSSION ... 33
1. CASAVA ... 33
2. Partek Genomic Suite ... 33
3. Splice Junction results... 35
4. To compare CASAVA with open source software for splice junction detection... 39
CONCLUSIONS ... 43
REFERENCES ... 45
LIST OF FIGURES
Figure 1: Clonal amplification by bridge PCR ... 4
Figure 2: Schematic representation of Solexa/Illumina technology... 4
Figure 3: Demultiplexing input files and folders.. ... 14
Figure 4: Output of demultiplexing command 1 and input for demultiplexing command 2. ... 14
Figure 6: Output of command 2 of the GERALD module.. ... 20
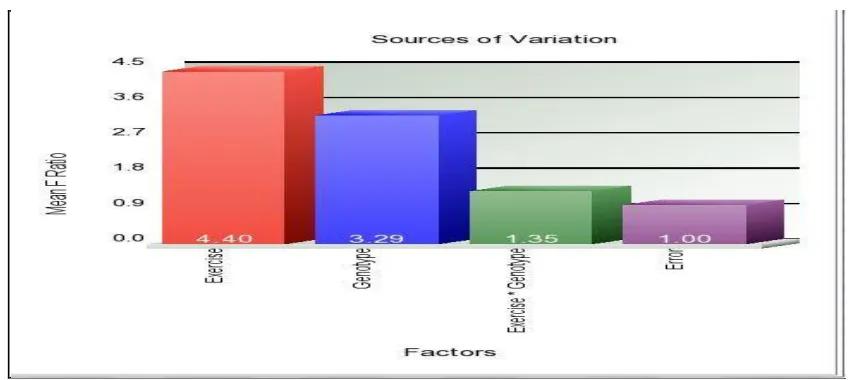
Figure 6: Sources of variation plot from Partek Genomic Suite... 34
Figure 7: Splice junction for Uaca gene viewed in UCSC genome browser. (a) Junctions from TopHat (b) Junctions from SpliceMap. ... 38
LIST OF TABLES Table 1: GERALD parameters for RNA-Seq analysis. ... 18
Table 2: Parameters for RNA-Seq variant detection and counting ... 20
Table 3: Parameters for TopHat... 25
Table 4: Parameters for SpliceMap ... 27
Table 5: Parameters for MapSplice ... 31
Table 6: Differentially expressed genes for myostatin; criterion of p-values with FDR < 0.01 ... 36
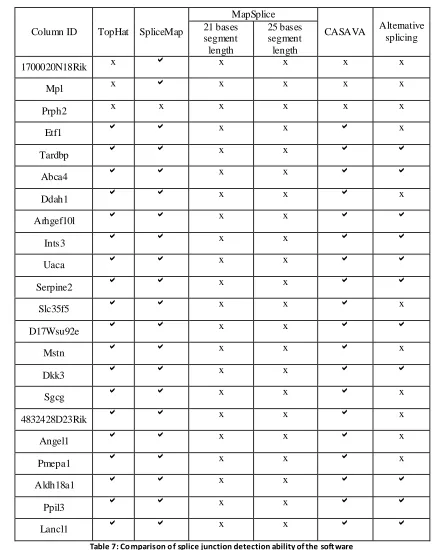
Table 7: Comparison of splice junction detection ability of the software ... 37
Table 8: Comparison of various RNA-Seq software... 42
Table 9: Format of qseq.txt file ... 47
Table 10: Format of Sample sheet... 48
Table 11: Format of sorted.txt file... 48
Table 12: Format of snp.txt file ... 49
Table 13: Format of count.txt file ... 50
Table 14: Format of BED file. The first 3 fields are required while the others are optional. ... 50
Page | 1
INTRODUCTION
1. Gene expression
Page | 2
2. DNA/RNA sequencing
Page | 3
Genome analysis points towards the fixed genetic patterns within a genome, whereas transcriptome, all mRNAs within the cell, analysis reveals the variable effects of environmental factors on the genetic patterns. Thus, the transcriptome data can be very useful for detection of gene expression patterns, genetic variations and mutations, gene fusion detection, mapping transcription start site, characterizing alternative splicing, etc. which are indicative of the normal/abnormal conditions. The next generation sequencing methods used to study transcriptome data at the nucleotide level is called ―RNA-Sequencing‖ or simply, ―RNA-Seq‖ (Ozsolak & Milos, 2011) (Wang, Gerstein & Snyder, 2009).
3. Illumina/Solexa technology
Page | 4
form of nucleotide sequence. These read sequences are analysed using sequence analysis software.
Figure 1: Clonal amplification by bridge PC R
[image:12.612.57.518.124.688.2]Page | 5
4. Motivation
Different analytical tools are available to study DNA/RNA sequencing data. Alignment tools like ELAND, SOAP (Li, Li, Kristiansen, & Wang, 2008), SHRiMP2 (David, Dzamba, Lister, Ilie, & Brudno, 2011), Bowtie (Langmead, Trapnell, Pop, & Salzberg, 2009) can be useful to align the short sequence reads to the reference genome. Tools like Cufflinks (Trapnell et al., 2010), CASAVA, Myrna (Langmead, Hansen, & Leek, 2010) can be used for finding expression of genes. Splice junction sites can be detected using MapSplice (Wang et al., 2010), SpliceMap (Au, Jiang, Lin, Xing, & Wong, 2010), TopHat (Trapnell, Pachter, & Salzberg, 2009), etc.
With hundreds of different software available for analyzing RNA-Seq data, a major question that every researcher is faced with is the choice of software. Some software are biased towards a specific platform, allowing the analysis of or giving be tter performance for data from specific platform, e.g. SplitSeek (Ameur, Wetterbom, Feuk, & Gyllensten, 2010) which is for SOLiD data only, Maq which can be used for SOLiD or Illumina, but not 454 Roche data; while other software may be biased towards better performing for data with specific read lengths. Another concern that a researcher has is the amount of money he/she can afford to use licensed software. The researcher might eventually end up in blindly using software recommended by their collaborators or the software which shows as the first hit in Google, which may or may not be the best software for their purposes.
Page | 6
end read data of different read lengths, making it difficult to be able to compare all the angles in a single study. The performance of MapSplice has been compared to TopHat and SpliceMap using a simulated RNA-Seq dataset. The read length used for the studies are not 65 bp length. Illumina is one of the most widely used sequencing platforms and can generate single-end data with a read length of 65 bases.
The current project aims at analyzing the effect of myostatin on gene expression in mice, of RNA-Sequencing data from Illumina platform using CASAVA. This study would also compare the performance of the splice junction detection capacity and features of the 3 open source software packages (TopHat, MapSplice and SpliceMap) along with the commercial software package CASAVA on Illumina RNA-Seq data. This study would also serve as a tutorial for individuals wishing to use different software on single-end RNA-Seq data.
5. Sequence analysis tools
5.1 CASAVA (Version 1.7)
Consensus Assessment of Sequence And VAriation (CASAVA) is a sequence analysis platform for variant detection, such as Single Nucleotide Polymorphisms (SNPs) and insertions and deletions (indels) , by aligning the sequencing reads to a reference genome. It can also perform read counting for identifying expression levels of the genes, exons and splice junctions in RNA sequencing analysis .
i. Sequence Alignment:
Page | 7
of Nucleotide Databases‖ (ELAND). PhageAlign allows finding the best match, whereas, the ELAND alignment method is used to match a large number of reads against the reference genome. The latest version, ELANDv2, allows for multiseeded and gapped alignments. Multiseed alignments allow successive alignment of seeds, each of 32 bases. Gapped alignment extends each candidate alignment to the full length of the read, and the gaps between each consecutive candidate can be up to 20 bases.
ii. Variant detection:
There are two steps to call SNPs via CASAVA. First, based on base calls, alignment, and quality scores , it calls alleles. Secondly, SNPs are called based on the allele calls and read depth.
There are three stages of finding Indels using CASAVA. Initially, it allows for the computation of non-aligned 'shadow reads' clusters, using distance metric positions of the 'singleton' reads that they pair to. Secondly, it assembles these clusters into contigs. Finally, it aligns the contigs back to the genome using the positions of associated 'singleton' reads.
iii. Counting
CASAVA can use these two methods for read counting:
a. readBases: Initially, the alignments to splice junctions are converted into two shorter genomic alignments, followed by counting the number of bases and not the number of reads, that belong to exons and genes. The splice junctions’ counts are the number of reads that cover the junction.
Page | 8
5.2 Bowtie (Version 0.12.7)
Bowtie is an open source, memory efficient tool for short read alignments. It aligns a large number of short nucleotide sequences (reads) to larger reference mammalian genomes. The ultrafast alignment rate of Bowtie makes it more efficient than other read mapping tools like SOAP and Maq. Bowtie employs an improvised Burrows-Wheeler index that allows keeping its memory footprint small. Bowtie has a ―quality-aware backtracking‖, that permits mismatches and favours high quality alignments; and ―double indexing‖, that prevents excessive backtracking. Bowtie also forms a good basis for other tools like TopHat, MapSplice, SpliceMap, etc. In short, Bowtie is extremely suitable for faster alignment of sets of high quality short reads having unique alignments to the reference.
5.3 TopHat
Page | 9
are indexed and mapped against the junction database to confirm splice sites , using the seed and extend alignment.
5.4 MapSplice
Page | 10 5.5 SpliceMap
SpliceMap is an algorithm for the execution of the split-reads alignment which is geared towards mammalian genomes. Initially, the set of input reads (50 bp) are divided into two equal segment reads. These segment reads are independently mapped to the genome, using either Bowtie, Eland or SeqMap (Jiang & Wong, 2008) to identify the locations of exons. These (uniquely or multiply) mapped segment reads are used as seed alignments and extended base by base to identify splice points. The unmapped (residual or segment) reads are used to search for the partner splice points. Currently, only the canonical GT-AG splice sites are identified using SpliceMap. If the input reads are longer than 50 bp, the reads are separated into overlapping segments of 50 bp and the above steps are followed.
6. Data source
Page | 11
Page | 12
MATERIAL AND METHODS
To analyze RNA seque ncing data from the Illumina platform using CASAVA
The data obtained from the Illumina sequencing platform was in the form of sequencing images that after Real Time Analysis (RTA) were converted to bcl (base calling) files. Using the converter module of CASAVA, bcl files are converted into qseq.txt files [named as: s_<lane>_<read>_<tile>_qseq.txt], which are stored in a BaseCalls directory. As the samples were multiplexed, demultiplexing was done using a sample sheet (SampleSheet.csv) and qseq.txt files as input. The format of qseq.txt files and sample sheet are as shown in Table 9 and Table 10 respectively.
1.1. DEMULTIPLEXING COMMAND 1
##############################################################################
Script name: demult_1_rich.sh
Location: /home/rrr5868
Description: This script is a wrapper script for demultiplexing on the Werner cluster. The
commands load the CASAVA module and do the part 1 of the demultiplexing. This script only
creates a Demultiplexed directory with empty the sub-directories 001, 002 and unknown (the
contents for these sub-directories are filled when the command for part 2 is run from within the
Demultiplexed folder) and make-files required for the actual demultiplexing. This command is for
demultiplexing only, the parameter for alignment has not been provided.
Page | 13
##############################################################################
module load casava
/tools/casava/1.7.0/bin/demultiplex.pl --input-dir ./CASAVA_trial_run/BaseCalls --output-dir
./CASAVA_trial_run/BaseCalls/Demultiplexed --sample-sheet
./CASAVA_trial_run/BaseCalls/SampleSheet.csv
##############################################################################
1.2. DEMULTIPLEXING COMMAND 2
#############################################################################
Script name: demult_2_make_rich.sh
Location: /home/rrr5868/CASAVA_trial_run/BaseCalls/Demultiplexed
Description: This script is a wrapper script for demultiplexing on the Werner cluster. The
commands load the CASAVA module and do the part 2 of the demultiplexing. This script does
the actual demultiplexing (qseq.txt files and other files are created during this command). This
command is for demultiplexing only, the parameter for alignment has not been provided.
Number of cores: 4
Input files required: Figure 3
##############################################################################
module load casava
nohup make -j 4
Page | 14 Figure 3: Demultiplexing input files and folders. The demultiplexing step requires many folders like Lane00x, Matrix, Phasing, etc. and files like SampleSheet.csv, .htm files, confg.xml, qseq.txt Bust ardSummary.xml, etc. (a) and (b) are representative figures. There are 120 qseq.txt files (corresponding to each lane ) for each index 1 and 2 per sample (1 to 8).
[image:22.612.77.527.67.367.2]Page | 15
Page | 16 1.3. CONFIG FILE TO DEFINE PARAMETERS
##############################################################################
Script name: config12_rich.txt
Location: /home/rrr5868/CASAVA_trial_run/BaseCalls/Demultiplexed/001
Description: This config file is needed for GERALD to specify which analysis to perform for
lanes 1 and 2. The other lanes are automatically set to the default ―ANALYSIS none‖. Similar for
the other lanes, i.e. (3, 4) and (5, 6). The config file names were changed to the corresponding
lane numbers inside gerald_1bacth_rich.sh
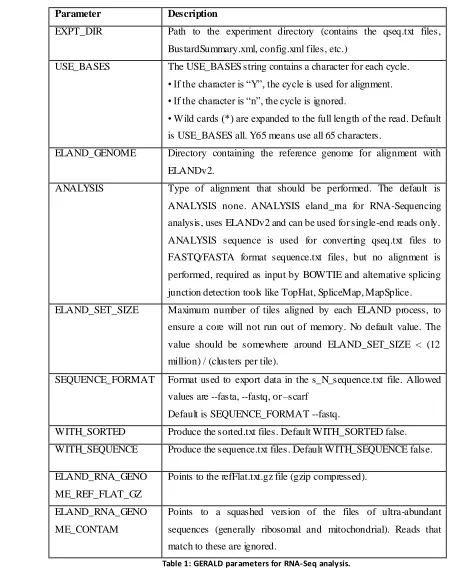
Parameters: Table 1
P.S.: For the ELAND_RNA_GENOME_REF_FLAT_GZ, the CASAVA 1.7 manual does not
mention _GZ which gives an error. The parameter needs _GZ.
##############################################################################
EXPT_DIR /home/rrr5868/CASAVA_trial_run/BaseCalls/Demultiplexed/001
12:USE_BASES all
ELAND_SET_SIZE 40
12:ANALYSIS eland_rna
12:ELAND_GENOME
/home/rrr5868/CASAVA_trial_run/RefGenome/GenomeSeqFiles/GenomeSeqFiles_Fasta_Squashed
12:ELAND_RNA_GENOME_REF_FLAT_GZ
/home/rrr5868/CASAVA_trial_run/RefGenome/GenomeSeqFiles/illumina_refFlat_mm9/refFlat.txt.gz
12:ELAND_RNA_GENOME_CONTAM
/home/rrr5868/CASAVA_trial_run/RefGenome/GenomeSeqFiles/AbundantFiles_Fasta_Squashed
WITH_SORTED true
Page | 17 1.4. GERALD COMMAND 1: creating directories and files necessary for the alignment
##############################################################################
Script name:gerald_1batch_rich.sh
Location:/home/rrr5868/CASAVA_trial_run/BaseCalls/Demultiplexed/001
Description: This script is a wrapper script for alignment on the Werner cluster. The commands
load the CASAVA module and do the part 1 of the Gerald alignment. This script only creates the
subdirectories (empty directories; the contents are filled when the command for part 2 is run from
the analysis folder) and makefiles required for the actual GERALD alignment. This command is
for alignment.
Parameters:config.txt file.
##############################################################################
module load casava
/tools/casava/1.7.0/bin/GERALD.pl config12_rich.txt --EXPT_DIR
/home/rrr5868/CASAVA_trial_run/BaseCalls/Demultiplexed/001 --make
#############################################################################
Page | 18
Parameters used for the config.txt file in RNA-Sequencing analysis:
Parameter Description
EXPT_DIR Path to the experiment directory (contains the qseq.txt files,
BustardSummary.xml, config.xml files, etc.)
USE_BASES The USE_BASES string contains a character for each cycle. • If the character is ―Y‖, the cycle is used for alignment. • If the character is ―n‖, the cycle is ignored.
• Wild cards (*) are expanded to the full length of the read. Default is USE_BASES all. Y65 means use all 65 characters.
ELAND_GENOME Directory containing the reference genome for alignment with
ELANDv2.
ANALYSIS Type of alignment that should be performed. The default is
ANALYSIS none. ANALYSIS eland_rna for RNA-Sequencing
analysis, uses ELANDv2 and can be used for single-end reads only.
ANALYSIS sequence is used for converting qseq.txt files to
FASTQ/FASTA format sequence.txt files, but no alignment is
performed, required as input by BOWTIE and alternative splicing
junction detection tools like TopHat, SpliceMap, MapSplice.
ELAND_SET_SIZE Maximum number of tiles aligned by each ELAND process, to
ensure a core will not run out of memory. No default value. The
value should be somewhere around ELAND_SET_SIZE < (12
million) / (clusters per tile).
SEQUENCE_FORMAT Format used to export data in the s_N_sequence.txt file. Allowed
values are --fasta, --fastq, or –scarf
Default is SEQUENCE_FORMAT --fastq.
WITH_SORTED Produce the sorted.txt files. Default WITH_SORTED false.
WITH_SEQUENCE Produce the sequence.txt files. Default WITH_SEQUENCE false.
ELAND_RNA_GENO
ME_REF_FLAT_GZ
Points to the refFlat.txt.gz file (gzip compressed).
ELAND_RNA_GENO
ME_CONTAM
Points to a squashed version of the files of ultra-abundant
sequences (generally ribosomal and mitochondrial). Reads that
[image:26.612.50.509.92.661.2]match to these are ignored.
Page | 19 1.5. GERALD COMMAND 2: run command from newly created GERALD directory
##############################################################################
Script name: gerald_2batch_rich.sh
Location: /home/rrr5868/CASAVA_trial_run/BaseCalls/Demultiplexed/001/GERALD_date_user
Description: This script is a wrapper script for alignment on the Werner cluster. The commands
load the CASAVA module and do the part 2 of the alignment of GERALD module. This script
does the actual alignment (export.txt files and other files are created during this command).
Parameters: config.txt file
##############################################################################
module load casava
nohup make -j 2
##############################################################################
The export.txtand sorted.txtfiles produced in the GERALD analysis were used as input for the variant detection and counting analyses. The export.txtfile has the results of alignment of all the reads in the lane. The sorted.txtfile has the results of only those reads that passed purity filtering and have a unique alignment with the reference genome. The format for the sorted.txtfile is as shown in Table 11.
Page | 20 Figure 5: Output of command 2 of the GERALD module. The summary reports, export.txt and sorted.txt files have been created.
Option Description
-e --exportDir=PATH Path to export.txt files
-l --lanes=NUMBER_LIST List of lanes (or samples)
-p --projectDir=DIR Project directory; all the output would be inside this directory
-r --runId=STRING Unique identifier for each run, can be any unique string
-ref --refSequences=PATH PATH of the reference genome sequences
-a --applicationType=TYPE Type of analysis, DNA or RNA; default is DNA. Example: -a RNA
-wa --workflowAuto Generates the workflow definition file and runs it.
--jobsLimit Number of parallel jobs
--refFlatFile Name and location of UCSC refFlat.txt.gz file
-rm --readMode=MODE Run-read-mode for all runs, paired (default) or single. Single mode is
recommended for RNA-Seq, sets the snpCovcutoff = -1 (which turns
off the SNPCaller Coverage Cutoff filter, i.e. SNPs are now called at
every position).
rnaCountMethod Control the RNA counting method default: rnaCountMethod readBases
[image:28.612.86.521.379.645.2]Page | 21 1.6. VARIANT DETECTION COMMAND
##############################################################################
Script name: var_count_rich_1.sh
Location: /home/rrr5868/CASAVA_trial_run/BaseCalls/Demultiplexed/001/GERALD_27-09-2011_rrr5868
Description: The command does the gene expression and splices junction detection analysis for
the specified lane (or sample).
Parameters:Table 2
##############################################################################
/tools/casava/1.7.0/bin/runRNA.pl runId=001_Rich_lane1
--
projectDir=/home/rrr5868/CASAVA_trial_run/BaseCalls/Demultiplexed/001/GERALD_27-09-2011_rrr5868/Var_Count_lane1
--refFlatFile=/home/rrr5868/CASAVA_trial_run/RefGenome/GenomeSeqFiles/illumina_refFlat_m
m9/refFlat.txt.gz -e
/home/rrr5868/CASAVA_trial_run/BaseCalls/Demultiplexed/001/GERALD_27092011_rrr5868
-l 1
--refSequences=/home/rrr5868/CASAVA_trial_run/RefGenome/GenomeSeqFiles/GenomeSeqFile
s_Fasta_Squashed --workflowAuto --jobsLimit=2
##############################################################################
Page | 22
Page | 23
To analyze alternative splicing events in the data using software like CASAVA,
TopHat, MapSplice and SpliceMap.
To align the input reads with BOWTIE, the demultiplexed qseq.txt files were converted into FASTA formatted files using CASAVA’s ANALYSIS: sequence module from GERALD. The commands are the same as for the ANALYSIS: eland_rna and only the config.txt file was modified for the specific parameters.
2.1. CONFIG FILE to create FASTA formatted reads
######################################################################## Script name: config1_rich_fasta.txt
Location: /home/rrr5868/CASAVA_trial_run/BaseCalls/Demultiplexed/001/
Description: This config file is needed for GERALD to specify which analysis to perform.
Parameters: Table 1
########################################################################
EXPT_DIR /home/rrr5868/CASAVA_trial_run/BaseCalls/Demultiplexed/001
USE_BASES all
ANALYSIS sequence ELAND_SET_SIZE 40
WITH_SEQUENCE true
SEQUENCE_FORMAT --fasta
Page | 24
BOWTIE builds an index of the genome using the DNA sequences. It has to be built only once and pre-built indexes can be used for future analyses. The splice junction detection software requires the BOWTIE index files, FASTA formatted separate chromosome files, FASTA formatted input reads and the refFlat.txt.gz file. The output are
insertions.bed, deletions.bed and junctions.bed (Table 14). The junctions.bed can be directly imported and viewed in the UCSC genome browser (W. James Kent et al., 2002). The 3 software packages, TopHat, MapSplice and SpliceMap, are able to run BOWTIE by themselves and directly use the output from BOWTIE as input for finding the splice junctions.
2.2. TopHat
There are many parameters which can be provided via the command line to TopHat (Table 3):
Argument Description
<ebwt_base> The base-name of the index to be searched. E.g., In-case of genome.1.ebwt,
the base-name is genome
<reads1,…….readsN> A comma-separated list of files containing reads in FASTQ or FASTA
format. Each sample is in a separate file
-o/--output-dir <string> Sets name of the output directory, default is ./tophat_out
-a/--min-anchor-length
<int>
Only junctions whose reads span atleast these many bases on each side of the
junction (anchor length) are reported. The default is 8.
-m/--splice-mismatches
<int>
The maximum number of mismatches allowed in the anchor region of a
spliced alignment. The default is 0
-i/--min-intron-length
<int>
The minimum intron length, default is 70, and ignores donor-acceptor pairs
with less than these many bases apart
-I/--ma x-intron-length
<int>
The maximum intron length, default is 500000.
--ma x-insertion-length
<int>
Page | 25 Table 3: P arameters for TopHat
--ma x-deletion-length
<int>
The maximum deletion length. The default is 3.
-F/--min-isoform-fraction
<0.0-1.0>
Junctions supported by very few alignments are discarded. The number of
reads spanning junction / average dept of coverage of exon > minimum
isoform fraction, for the junction to be reported.
Zero disables the filter. The default is 0.15
-p/--num-threads <int> Number of threads for aligning reads; allows parallel computing.
-g/--max-multihits <int> For a single read, allows these many maximum alignments to the reference.
Default is 20 for read mapping.
--initial-read-mismatches During initial mapping of read to the reference, only this number of
ma ximum mismatches is allowed. Default is 2
--bowtie-n BOWTIE uses –n option for initial mapping, default is –v
--segment-mismatches During initial mapping of read segments, maximum of these many
mismatches are allowed, default 2
--segment-length Each read is divided into segments, each of atleast these many bases, they are
independently mapped. Default is 25.
--min-coverage-intron The minimum intron length that may be found during coverage search. The
default is 50.
--ma x-coverage-intron The maximum intron length that may be found during coverage search. The
default is 20000.
--min-segment-intron The minimum intron length that may be found during split-segment search.
The default is 50.
--ma x-segment-intron The maximum intron length that may be found during split-segment search.
[image:33.612.60.530.68.534.2]Page | 26
TOPHAT COMMAND
######################################################################## Script name:tophat_batch_rich.sh
Location: /home/rrr5868/TopHat
Description: The command loads the necessary modules and after alignment using BOWTIE, uses TopHat for finding the splice junctions.
########################################################################
module load bowtie module load tophat
module load samtools
nohup tophat --num-threads 8 --bowtie-n --segment-length 32 genome
001_sample_1_sequence.txt,001_sample_12_sequence.txt,001_sample_13_sequence.txt,001_s ample_15_sequence.txt,001_sample_3_sequence.txt,001_sample_6_sequence.txt,001_sample
_7_sequence.txt,001_sample_9_sequence.txt,002_sample_10_sequence.txt,002_sample_11_se
quence.txt,002_sample_14_sequence.txt,002_sample_16_sequence.txt,002_sample_2_sequen
ce.txt,002_sample_4_sequence.txt,002_sample_5_sequence.txt,002_sample_8_sequence.txt
Page | 27 2.3. SpliceMap
There are many parameters which can be provided via a command line or via
run.cfg file (Table 4):
Parameter Description
genome_dir Directory containing the separate chromosome files in FASTA format
> reads_list1
sample1.txt
<
List of files containing the input reads, one sample per line, starting of list
with > and ending of list with <
read_format Format of input reads, can be FASTA, FASTQ, RAW
Mapper Aligner type, can be bowtie, eland, seqmap
annotations the annotations file to find novel junctions
temp_path name of directory storing temporary file, default is temp
out_path name of directory that stores output files, default is output
ma x_intron ma ximum intron size, default is 400000
min_intron 25-th intron size, default is 20000
ma x_multi_hit segment reads can have maximum of these many multi-hits to the reference,
default is 10
seed_mismatch ma ximum number of mismatches allowed in mapping seed reads, can be 0,
1, 2. Default is 1
read_mismatch ma ximum number of mismatches allowed in mapping complete reads.
Default is 2
chromosome_wildcard name of chromosome file with wildcards, default is chr*.fa
num_chromosome_together processes these many chromosomes at once, default is 1
bowtie_base_dir base of bowtie index
num_threads number of threads for mapping, default is 2, allows parallel computing
[image:35.612.83.527.181.574.2]Page | 28
CONFIG FILE TO DEFINE PARAMETERS
######################################################################## Script name: run.cfg
Location: /home/rrr5868/TopHat
Description: This config file is needed for SpliceMap to specify parameters. Parameters: Table 4
########################################################################
# This configuration file contains all settings for a run of SpliceMap.
# lines begining with '#' are comments. lists begin with '> tag' and end with '<' on separate lines
# Required Settings
genome_dir = /home/rrr5868/TopHat/
> reads_list1
001_sample_1_sequence.txt
001_sample_12_sequence.txt
001_sample_13_sequence.txt
001_sample_15_sequence.txt
001_sample_3_sequence.txt
001_sample_6_sequence.txt
001_sample_7_sequence.txt 001_sample_9_sequence.txt
002_sample_10_sequence.txt
002_sample_11_sequence.txt
Page | 29 002_sample_16_sequence.txt
002_sample_2_sequence.txt 002_sample_4_sequence.txt
002_sample_5_sequence.txt
002_sample_8_sequence.txt
<
#> reads_list2
#<
read_format = FASTA
#quality_format = phred-33
mapper = bowtie # Optional Settings
#annotations = all.gene.refFlat.txt
temp_path = ./splicemap_temp
out_path = ./splicemap_output
max_intron = 400000
min_intron = 20000
max_multi_hit = 10 # full_read_length = 70
seed_mismatch = 2
read_mismatch = 2
#max_clip_allowed = 40
sam_file = sam
Page | 30 num_chromosome_together = 2
# Bowtie specific options # Required Settings
bowtie_base_dir = /home/rrr5868/TopHat/genome
# Optional Settings
num_threads = 12
########################################################################
SPLICEMAP COMMAND
######################################################################## Script name:splicemap_batch_rich.sh
Location: /home/rrr5868/TopHat
Description: The command loads the necessary modules and after alignment using BOWTIE, uses SpliceMap for finding the splice junctions.
########################################################################
module load bowtie module load splicemap
module load samtools
nohup /tools/SpliceMap/3.3.5.2/bin/runSpliceMap run.cfg
Page | 31 2.4. MapSplice
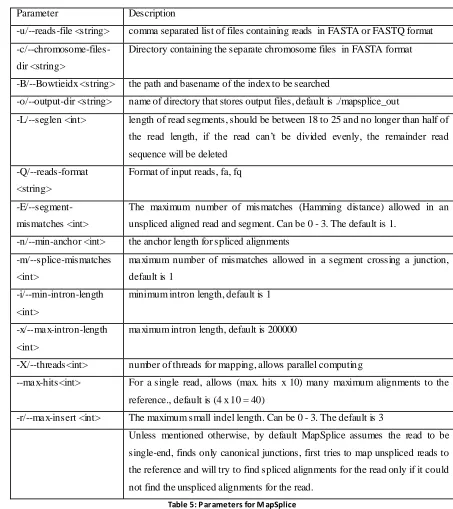
There are many parameters which can be provided via a command line or via
MapSplice.cfg file (Table 5):
Parameter Description
-u/--reads-file <string> comma separated list of files containing reads in FASTA or FASTQ format
-c/--chromosome-files-dir <string>
Directory containing the separate chromosome files in FASTA format
-B/--Bowtieidx <string> the path and basename of the index to be searched
-o/--output-dir <string> name of directory that stores output files, default is ./mapsplice_out
-L/--seglen <int> length of read segments, should be between 18 to 25 and no longer than half of the read length, if the read can’t be divided evenly, the remainder read
sequence will be deleted
-Q/--reads-format
<string>
Format of input reads, fa, fq
-E/--segment-mismatches <int>
The maximum number of mismatches (Hamming distance) allowed in an
unspliced aligned read and segment. Can be 0 - 3. The default is 1.
-n/--min-anchor <int> the anchor length for spliced alignments
-m/--splice-mismatches
<int>
ma ximum number of mismatches allowed in a segment crossing a junction,
default is 1
-i/--min-intron-length
<int>
minimum intron length, default is 1
-x/--ma x-intron-length
<int>
ma ximum intron length, default is 200000
-X/--threads<int> number of threads for mapping, allows parallel computing
--ma x-hits<int> For a single read, allows (max. hits x 10) many maximum alignments to the
reference., default is (4 x 10 = 40)
-r/--ma x-insert <int> The maximum small indel length. Can be 0 - 3. The default is 3
Unless mentioned otherwise, by default MapSplice assumes the read to be
single-end, finds only canonical junctions, first tries to map unspliced reads to
the reference and will try to find spliced alignments for the read only if it could
not find the unspliced alignments for the read.
[image:39.612.74.527.175.684.2]Page | 32
MAPSPLICE COMMAND
######################################################################## Script name: mapsplice_long_rich.sh
Location: /home/rrr5868/TopHat
Description: The command loads the necessary modules and after alignment using BOWTIE, uses MapSplice for finding the splice junctions.
########################################################################
module load bowtie
module load mapsplice
module load samtools
python /tools/MapSplice/1.15.2/bin/mapsplice_segments.py -Q fa -c /home/rrr5868/TopHat -u 001_sample_1_sequence.txt,001_sample_12_sequence.txt,001_sample_13_sequence.txt,001_s
ample_15_sequence.txt,001_sample_3_sequence.txt,001_sample_6_sequence.txt,001_sample
_7_sequence.txt,001_sample_9_sequence.txt,002_sample_10_sequence.txt,002_sample_11_se
quence.txt,002_sample_14_sequence.txt,002_sample_16_sequence.txt,002_sample_2_sequen ce.txt,002_sample_4_sequence.txt,002_sample_5_sequence.txt,002_sample_8_sequence.txt -B
/home/rrr5868/TopHat/genome -L 21 -E 2 -n 8 -m 0 -X 12 --fusion 2>mapsplicelong_time.log
Page | 33
RESULTS AND DISCUSSION
1. CASAVA
CASAVA can create genomic builds, call SNPs, detect indels, and count reads using data generated from one or more runs of the Genome Analyzer across a broad range of sequencing applications. The RNA-Sequencing module of CASAVA was used to find the gene counts for all the samples across the whole geno me. For aligning of the short reads to the reference genome using the GERALD module , the ELANDv2 algorithm was used. GERALD provides the flexibility to include lane specific parameters, required or optional configuration file parameters, or analysis specific parameters. Using the variant detection and counting module, single nucleotide polymorphisms (SNPs) and indels can be detected. However, the Indel Finder application runs only during paired-end reads, and it uses singleton/shadow read pairs to detect indels. So, for single-end reads, the output is in the form of exon counts, gene counts and splice junction counts for each chromosome per lane (or sample).
2. Partek Genomic Suite
Page | 34
homogenization method for RNA extraction so they were removed from further analysis. Only 12 samples were used for the 2-way ANOVA using Partek and for finding differentially expressed genes. The 2-way ANOVA model used, Method of Moments, allows for the checking of the two main factors of exercise and genotype and their interaction. To check the effect of myostatin, a contrast of wildtype vs. myostatin-deficient mice was performed using the Fisher’s Least Significant Difference test.
[image:42.612.93.520.453.643.2]From the sources of variation plot (Figure 6), it was clear that the interaction is not highly significant. It could hardly explain the variability in the data. The gene list obtained for the interaction had only three genes (Mpl, Prph2 and 1700020N18Rik) and it seems that myostatin and exercise together do not cause any major changes in gene expression. Since we already know that exercise causes major changes in gene expression, the major focus was on finding the genes differentially ex pressed due to myostatin.
Page | 35
Although many different combinations of p-value and fold change could have been used for generating the list of differentially expressed genes, it was decided to concentrate only on p-value rather than fold change. To compensate for the exclusion of fold change in the analysis, a stringent criterion of p-values with FDR < 0.01 was used. A total of 22 genes were found to be differentially expressed with the above criteria (Table 6). Genes related to cardiomyopathy like Sgcg, Prph2 which is related to Amyotrophic lateral sclerosis (ALS), Mstn which is related to muscular hypertrophy and Mpl which is involved in the Jak-STAT signalling pathway were observed. A less stringent criterion of p-values with FDR < 0.05 could have been used to find novel genes at the expense of having some false discoveries. These genes were further used as a test-dataset to check the performance of the splice junction detection software.
3. Splice Junction results
Page | 36
differentially expressed genes obtained from the earlier analysis of CASAVA followed by analysis with the Partek Genomic Suite (Table 6). To study alternative splicing, it is first important that the software used is able to identify the splice junctions of the gene under study. Table 7 shows the performance of the software in identifying the splice
junctions for the representative genes.
Gene Symbol Gene Name Chromosome
Abca4 ATP-binding cassette, sub-family A (ABC1), member 4 3
D17Wsu92e DNA segment, Chr 17, Wayne State University 92, expressed 17
Lancl1 LanC (bacterial lantibiotic synthetase component C)-like 1 1
1700020N18Rik RIKEN cDNA 1700020N18 gene 1
4832428D23Rik RIKEN cDNA 4832428D23 gene 1
Arhgef10l Rho guanine nucleotide exchange factor (GEF) 10-like 4
Aldh18a1 aldehyde dehydrogenase 18 family, member A1 19
Angel1 angel homolog 1 (Drosophila) 12
Dkk3 dickkopf homolog 3 (Xenopus laevis) 7
Ddah1 dimethylarginine dimethylaminohydrolase 1 3
Etf1 eukaryotic translation termination factor 1 18
Ints3 integrator complex subunit 3 3
Mpl myeloproliferative leukemia virus oncogene 4
Mstn myostatin 1
Ppil3 peptidylprolyl isomerase (cyclophilin)-like 3 1
Prph2 peripherin 2 17
Tardbp predicted gene 13886; TAR DNA binding protein 4
Pmepa1
prostate transmembrane protein, androgen induced 1; similar to
Nedd4 WW binding protein 4 2
Sgcg sarcoglycan, gamma (dystrophin-associated glycoprotein) 14
Serpine2 serine (or cysteine) peptidase inhibitor, clade E, member 2 1
Slc35f5 solute carrier family 35, member F5 1
[image:44.612.89.523.233.657.2]Uaca uveal autoantigen with coiled-coil domains and ankyrin repeats 9
Page | 37 Column ID TopHat SpliceMap
MapSplice
CASAVA Alternative splicing 21 bases segment length 25 bases segment length
1700020N18Rik x x x x x
Mpl x x x x x
Prph2 x x x x x x
Etf1 x x x
Tardbp x x
Abca4 x x
Ddah1 x x x
Arhgef10l x x
Ints3 x x
Uaca x x
Serpine2 x x
Slc35f5 x x x
D17Wsu92e x x
Mstn x x x
Dkk3 x x
Sgcg x x x
4832428D23Rik x x x
Angel1 x x x
Pmepa1 x x x
Aldh18a1 x x
Ppil3 x x
[image:45.612.84.516.65.615.2]Lancl1 x x
Table 7: Comparison of splice junction detection ability of the soft ware
Out of the 22 genes analyzed, 11 were associated with alternative splicing. The
Page | 38
[image:46.612.88.516.148.492.2]alternative splicing events. The following is the example of junctions for the Uaca gene obtained from the TopHat and SpliceMap output (Figure 7).
Figure 7: Splice junction for Uaca gene viewed in UCSC genome browser. (a) Junctions from TopHat (b) Junctions from SpliceMap.
Page | 39
alternative promoters and a retained intron. Although the report generated by the splice junction software gives a count of the number of reads that map the junction, there is a wide range in the number of reads that map to the junctions. For one gene, the number of reads that correspond to its different splice junctions are not always equal, making it difficult to explain the quantitative use of different junctions for the same gene. Further analysis might be needed to check for specific usage of junctions in alternative splicing.
4. To compare CASAVA with open source software for splice junction detection.
The performance of open source software can be compared to commercial software performance using a common data set. Open source software will facilitate increased access for the scientific community to the analysis of RNA-Seq data.
This goal is fairly complex because many aspects can be studied. One could look at the implementation of the software, the actual algorithm used (ELAND and BOWTIE), the results of alignment, time requirement, supervision or cost.
For comparison (Table 7), CASAVA was kept as a stand-alone software package because it is commercial and can perform alignment, detection of alternative splicing, plus expression count study, while the other software packages were used in combination with BOWTIE as open source alternatives (e.g. TopHat+Bowtie, SpliceMap+Bowtie, MapSplice+Bowtie).
Page | 40
length. A study at Stanford by Jim Hester (Hester, 2010) used 19 million paired-end reads of 75 bp length, from the Illumina GAIIx and simulated paired datasets of varying length to compare different RNA-Seq software packages.
Wherever possible, the segment (seed) length, number of threads, minimum anchor length, segment mismatches, splice mismatches and read mismatches parameters’ values were kept the same (or similar) in all the software packages, whereas other parameters like maximum multi-hits, minimum and maximum intron lengths had the default values. This study used an input of single-end 342.7 million reads, which was very high compared to the other studies.
To analyze the hundreds of gigabytes of data produced by RNA-Seq technologies, there is a wide array of open source and commercial software packages available. For a researcher to get the most information from his data, it is very important to choose the right tool for analysis. As seen from the comparison (Table 8), no software alone can completely analyze the RNA-Seq data; the use of specific software depends on the aim of the researcher and the availability of resources like time, money and expert personnel to use the software.
Page | 41
which can be overwhelming at times. To run the different modules of CASAVA and to manipulate its output files to make them compatible for downstream analyses, an expert bioinformatician would be needed.
If the ―interesting‖ genes are already known to the researcher, using TopHat or SpliceMap would be good open source options. SpliceMap has an easy-to-use configuration file, gives higher sensitivity and allows for the use of different short read aligners at the expense of not permitting the change in seed length and being more time consuming than TopHat.
MapSplice was not able to detect any of the ―test‖ genes. The algorithm tries to split the input read into smaller equal length segments, each containing the seed length number of characters. Any leftover characters from the original read are discarded. A read length of 65, using 21 as the seed length, allowed 63 characters of the read to be used. With a seed length of 21 the run time was very high and only 264 junctions were detected. None of these junctions were mapped to the test genes. The seed length of 25 allowed only 50 characters of the original read to be used and the rest to be discarded. When a seed length of 25 was used, the run time dropped sharply and the software found approximately twice as many junctions as compared to the seed length of 21. Again, none of these junctions were mapped to the test genes. There was also an error in the number of the junctions, with one junction number being skipped in the report. The algorithm seems to perform better for read lengths which are multiples of 25.
Page | 42 Software
Features CASAVA
BOWTIE + TopHat BOWTIE + SpliceMap BOWTIE + MapSplice
License type Commercial Open source Open source Open source
Demultiplexing x x x
Aligning short reads
Gene expression count x x x
Splice junction
detection
(86% sensitivity) (86% sensitivity)
(96% sensitivity)
(no junction detected)
Time requirement
(hrs. per sample per
thread)
GERALD: 7.5 hrs
Variant and
detection: 7.5 hrs
12.5 hrs 24 hrs
19.5 hrs (segment
length = 25)
51.5 hrs (segment
length = 21)
Flexibility in parameters
Junction type expressed canonical canonical
canonical, semi
and non-
canonical
Allows different aligner x x x
Allows changing read
segment length
x
Expert supervision
[image:50.612.59.531.87.470.2]needed Maximum Minimal Minimal Minimal
Page | 43
CONCLUSIONS
A few open questions may be further studied. New software can be made or current software can be upgraded to allow for better and in-depth analysis of alternative splicing. No study has been performed as of yet to check for any 3 prime biases that may be present in the RNA-Seq data (Ozsolak & Milos, 2011). The selection of mRNA for the study is via the selection of poly-A tails of the mRNA. As a result, the 3’ side of the transcripts is definitely represented; however, due to the various percentages of RNA degradation, it would be interesting to determine if there is any loss of information of the 5’ end. The RNA degradation and the random fragmentation of the template during library preparation may cause a lower number of longer transcripts and a greater number of shorter transcripts. This exploration may allow for the further study of issues concerning the complexity of the information obtained by the transcripts. Questions like whether the absence of 5’ end exons is due to alternative splicing or just loss of information due to RNA degradation, and whether the current normalization methods would be sufficient if there is any 3’ bias, would be interesting to observe. Software can be programmed in efficient ways that allow minimum time and memory requirement. Studies of the code implementation of current software can be done to better understand, increase the efficiency of the software and permit the use of other software modules as plug-ins.
Page | 44
various types of Seq analyses. Another major shortcoming in the analysis of RNA-Seq data is that expert personnel are needed to data mine the overwhelming data and obtain some useful information. Software should aim at avoiding the need for users to enter command line arguments. Providing the users with a graphical interface or a configuration file containing all the parameters, wherein the users might just have to select the ones they want, would greatly simplify the analysis. Most of the software packages currently available are only Unix-based and have many hardware requirements which may not be readily available in a small laboratory, creating a limitation for the software’s value to the researcher. With the availability of multi-core, multi-processor computers, software should be designed that can utilize the parallel computing ability and therefore reduce the computing time. Another issue that needs to be addressed is providing the output in formats that are compatible with other software which might be used for downstream data processing. The best approach would integrate a number of software packages to create one that should be able to completely analyze the data, be it alignment, gene counting, differential expression of the genes, finding alternative splicing events, visualizing the output or querying different biological databases to correlate the results with the available information.
Page | 45
REFERENCES
1. Ameur, A., Wetterbom, A., Feuk, L., & Gyllensten, U. (2010). Global and unbiased detection of splice junctions from RNA-Seq data. Genome Biol, 11(3), R34.
2. Au, K. F., Jiang, H., Lin, L., Xing, Y., & Wong, W. H. (2010). Detection of splice junctions from paired-end RNA-Seq data by SpliceMap. Nucleic Acids Res,
38(14), 4570-4578.
3. Black, D. L. (2003). Mechanisms of alternative pre-messenger RNA splicing.
Annu Rev Biochem, 72, 291-336.
4. Clancy, S. (2008). RNA splicing: introns, exons and spliceosome. Nature Education 1(1).
5. David, M., Dzamba, M., Lister, D., Ilie, L., & Brudno, M. (2011). SHRiMP2: sensitive yet practical SHort Read Mapping. Bioinformatics, 27(7), 1011-1012. 6. Jiang, H., & Wong, W. H. (2008). SeqMap: mapping massive amount of
oligonucleotides to the genome. Bioinformatics, 24(20), 2395-2396.
7. Hester, J. (2010). Comprehensive comparison of RNA-Seq alignment packages 8. Langmead, B., Hansen, K. D., & Leek, J. T. (2010). Cloud-scale
RNA-Sequencing differential expression analysis with Myrna. Genome Biol, 11(8), R83.
9. Langmead, B., Trapnell, C., Pop, M., & Salzberg, S. L. (2009). Ultrafast and memory-efficient alignment of short DNA sequences to the human genome.
Genome Biol, 10(3), R25.
10. Li, R., Li, Y., Kristiansen, K., & Wang, J. (2008). SOAP: short oligonucleotide alignment program. Bioinformatics, 24(5), 713-714.
11. Marguerat, S., Wilhelm, B. T., & Bahler, J. (2008). Next-generation sequencing: applications beyond genomes. Biochem Soc Trans, 36(Pt 5), 1091-1096.
12. Matlin, A. J., Clark, F., & Smith, C. W. (2005). Understanding alternative splicing: towards a cellular code. Nat Rev Mol Cell Biol, 6(5), 386-398.
Page | 46
14. Morozova, O., Hirst, M., & Marra, M. A. (2009). Applications of new sequencing technologies for transcriptome analysis. Annu Rev Genomics Hum Genet, 10, 135-151.
15. Ozsolak, F., & Milos, P. M. (2011). RNA sequencing: advances, challenges and opportunities. Nat Rev Genet, 12(2), 87-98.
16. Pearson, H. (2006). Genetics: what is a gene? Nature, 441(7092), 398-401.
17. Rockl, K. S., Hirshman, M. F., Brandauer, J., Fujii, N., Witters, L. A., & Goodyear, L. J. (2007). Skeletal muscle adaptation to exercise training: AMP -activated protein kinase mediates muscle fiber type shift. Diabetes, 56(8), 2062-2069.
18. Shendure, J., & Ji, H. (2008). Next-generation DNA sequencing. Nat Biotechnol,
26(10), 1135-1145.
19. Trapnell, C., Pachter, L., & Salzberg, S. L. (2009). TopHat: discovering splice junctions with RNA-Seq. Bioinformatics, 25(9), 1105-1111.
20. Trapnell, C., Williams, B. A., Pertea, G., Mortazavi, A., Kwan, G., van Baren, M. J., et al. (2010). Transcript assembly and quantification by RNA-Seq reveals unannotated transcripts and isoform switching during cell differentiation. Nat Biotechnol, 28(5), 511-515.
21. Voelkerding, K. V., Dames, S. A., & Durtschi, J. D. (2009). Next-generation sequencing: from basic research to diagnostics. Clin Chem, 55(4), 641-658.
22. W. James Kent, Charles W. Sugnet, Terrence S. Furey, Krishna M. Roskin, Tom H. Pringle, Alan M. Zahler, et al. (2002). The Human Genome Browser at UCSC.
Genome Res, 12.
23. Wang, K., Singh, D., Zeng, Z., Coleman, S. J., Huang, Y., Savich, G. L., et al. (2010). MapSplice: accurate mapping of RNA-Seq reads for splice junction discovery. Nucleic Acids Res, 38(18), e178.
24. Wang, Z., Gerstein, M., Snyder, M. (2009). RNA-Seq: a revolutionary tool for transcriptomics. Nat Rev Genet, 10(1), 57-63.
Page | 47
APPENDIX
Field Description
Machine number Identifier of the sequencer
Run number Number to identify the run on the sequencer
Lane number Positive integer (1 to 8)
Tile number Positive integer
X X co-ordinate of the spot. Integer
Y Y co-ordinate of the spot. Integer
Index Index sequence. If a file has not yet been demultiplexed, it has 0
Read number 1 for single-end reads, 2 for multiplexed single-end reads
Sequence Called sequence of read
Quality The quality string
Filter Did the read pass filtering? 0-No, 1-Yes
[image:55.612.132.476.175.484.2]Page | 48
Field Description
FCID Flow Cell ID
Lane Positive integer (1 to 8)
SampleID ID of the sample
SampleRef The reference sequence of the sample; species
Index Index sequence
Description Description of the sample
Control Y indicates this lane is control lane, N means sample
Recipe Recipe used during sequencing
Operator Name or ID of the operator
Table 10: Format of Sample shee t
Field Description
Match chromosome
Name of chromosome match or one of the following code: RM= repeat masked, i.e. matched to abundant sequences NM= not matched
Match contig Name of the contig if there is a match, blank otherwise
Match position w.ith respect to the forward strand, position starts at 1, blank otherwise
Match strand F=forward R=reverse
Match descriptor Description of the alignment. 65=65 matches, 32G32=substitution at 33st position, ^..$ is used to represent indels, number instead of the dots means insertion and sequence means deletion relative to the reference.
Single read alignment score
Alignment score of a single-read match, scores < 4 should be considered as aligned to a repeat. -1 for shadow reads
[image:56.612.166.450.69.311.2]Page | 49
Field Description
Position Position of the SNP on the chromosome
A Number of A bases called on the reads
C Number of C bases called on the reads
G Number of G bases called on the reads
T Number of T bases called on the reads
Modified call The genotype called or the highest scoring allele for heterozygous call
Total Total bases called at that position
Used Bases used for making the SNP call
Score Score of first allele, followed by the score of the second allele, if applicable
Reference The reference base at that position
Type The call type:
SNP_diff—homozygous SNP
SNP_het1—heterozygous SNP where the reference allele has the stronger of the two allele scores
SNP_het2—heterozygous SNP where the non-reference allele has the stronger of the two allele scores
[image:57.612.64.533.69.442.2] SNP_het_other—heterozygous SNP where neither allele matches the reference
Page | 50
Field Description
Chromosome the chromosome on which the feature resides
Start Start position of the feature
End End position of the feature
Gene Gene symbol (appended to chr#_start#_end# for splice junction)
Normalized count For readBases method: Normalized count (RPKM)=(raw count x read length)/(feature length x number of mapped reads in millions)
Raw counts For readBases method: raw count=sum of coverages for each base within the feature.
For junctions, the count is the number of reads that cover the junction.
Table 13: Format of count.txt file
Field Description
Chrom Name of chromosome
chromStart Start position of the feature in the chromosome, numbering starts from 0
chromEnd End position of the feature in the chromosome
name Name of the BED line, displayed in full or pack mode of genome browser
Score Between 0 and 1000, number of reads covering the junction
Strand + or – strand
thickStart Start position where the feature is drawn thickly
thickEnd End position where the feature is drawn thickly
itemRgb RGB value to display color
blockCount Number of blocks or exons in the BED line
blockSize List of block sizes separated by comma
[image:58.612.58.531.78.689.2]blockStarts List of block starts separated by comma
Page | 51
Software Link
CASAVA http://www.illumina.com/
BOWTIE http://bowtie-bio.sourceforge.net/index.shtml
TopHat http://tophat.cbcb.umd.edu/
MapSplice http://www.netlab.uky.edu/p/bioinfo/MapSplice
SpliceMap http://www.stanford.edu/group/wonglab/SpliceMap/
SHRiMP http://compbio.cs.toronto.edu/shrimp
SOAP http://soap.genomics.org.cn
Maq http://maq.sourceforge.net/
Myrna http://bowtie-bio.sourceforge.net/myrna/index.shtml
Cufflinks http://cufflinks.cbcb.umd.edu/
Partek® Genomics SuiteTM v 6.6 beta http://www.partek.com/
Other RNA-Seq tools http://openwetware.org/wiki/Wikiomics:RNA-Seq
[image:59.612.61.536.70.422.2]UCSC Genome Browser http://genome.ucsc.edu/