Int. J. Electrochem. Sci., 12 (2017) 4150 – 4163, doi: 10.20964/2017.05.40
International Journal of
ELECTROCHEMICAL
SCIENCE
www.electrochemsci.org
Influence of Rolling Processing on Discharge Performance of
Al-0.5Mg-0.1Sn-0.05Ga-0.05In Alloy as Anode for Al-air Battery
Xiang Yin1,2, Kun Yu1,2,* , Tao Zhang2, Hongjie Fang1,2, Han Dai2, Han-qing Xiong1,2, Yi-long Dai1,2 1
School of Materials Science and Engineering, Central South University, Changsha 410083, China; 2
Department of Materials Science and Engineering, Yantai Nanshan University, Yantai 265713, China *
E-mail: [email protected]
Received: 24 November 2016 / Accepted: 4 February 2017 / Published: 12 April 2017
In this study, as-cast and as-rolled Al-0.5Mg-0.1Sn-0.05Ga-0.05In (wt.%) aluminum alloy anodes were prepared. The microstructure, corrosion property and discharge performance of the as prepared materials were investigated. Compared with the as-cast Al-0.5Mg-0.1Sn-0.05Ga-0.05In alloy anode, the Al-air battery with as-rolled alloy anode has higher battery voltage, anode efficiency and energy density in 2 mol L-1 NaCl or 4 mol L-1 NaOH solution. The as-rolled alloy anode exhibits optimal discharge performance due to dispersive segregation phases and more grain boundaries produced by rolling processing. The dispersive segregation phases provide more sources of pitting corrosion and more grain boundaries provide more channels for anode reaction. This study demonstrates that it is feasible for as-rolled Al-0.5Mg-0.1Sn-0.05Ga-0.05In alloy to be used as anode material for Al-air battery in 2 mol L-1 NaCl or 4 mol L-1 NaOH solution.
Keywords: Rolling processing; Aluminum alloy; Self-corrosion; Aluminum-air battery discharge performance; NaCl and NaOH electrolytes
1. INTRODUCTION
Al-air battery has been reported abundantly which can be applied for powering vehicles [4]. However currently, the Al-air battery is not a popular energy storage device compared with Zn-air battery [5]. While using pure Al as anode, the main problems are protective oxide film forming in neutral aqueous electrolytes which results in high anodic dissolution overvoltage [6], and severe self-corrosion in alkaline electrolytes which reduces the energy density and anode efficiency. Due to these problems, Al has been regarded as unattractive energetic anode material, and the development of Al-air battery has been hindered seriously. To overcome the problem in alkaline electrolyte, there are two main methods. The first method is to dope aluminum with other elements such as gallium, indium, tin, and zinc, because of the high hydrogen evolution overpotential of them which can reduce hydrogen evolution [7, 8]. The second is to add corrosion inhibitors into the alkaline electrolyte. Inhibitors, such as zinc oxide, sodium stannate and citrates, can inhibit the self-corrosion of Al in alkaline electrolyte [9, 10]. To solve the problem in neutral aqueous electrolytes, tin, indium and gallium elements are added in aluminum alloy. Such elements can cause the dissolution-deposition processing activation of aluminum and form defects in the passive hydroxide film [2]. Compared with alkaline electrolyte, neutral aqueous electrolyte inheres a lower self-corrosion rate of aluminum alloys and is not harmful to environmental protection.
In early studies, the grain size of the metal anode has been associated with corrosion resistance [11-13], and the pitting corrosion resistance of the microcrystalline Al coating is improved compared to that of the cast pure Al [14]. Recently, the effect of grain size on the aluminum anodes, the effect of crystal orientation on the aluminum anodes and fine structured aluminum anodes have been investigated [15-17]. Obviously, there is a close relationship between the microstructure and discharge performance of Al anode.
However, the effect of rolling on aluminum anodes has been rarely studied. In this work, as-cast and as-rolled Al-Mg-Sn-Ga-In alloys were prepared. The discharge performance of the Al-air batteries with Al-Mg-Sn-Ga-In alloy anodes was studied in 2 mol L-1 NaCl or 4 mol L-1 NaOH solution. Besides, the corrosion property and microstructure of as-cast and as-rolled Al-Mg-Sn-Ga-In alloys were investigated.
2. EXPERIMENTAL
2.1. Material preparation
thickness. The ultimate composition of Al-Mg-Sn-Ga-In alloy was analyzed by inductively coupled plasma atomic emission spectrometry (ICP-AES, Baird PS-6) and the result is shown in Table 1.
Table 1. Chemical compositions of Al-0.5Mg-0.1Sn-0.05Ga-0.05In (wt. %) alloy.
Alloy Mg Sn Ga In Fe Si Al
Al-Mg-Sn-Ga-In 0.52 0.105 0.049 0.050 0.001 0.020 remainder
2.2. Microstructure characterization
In order to compare the microstructure of as-cast and as-rolled alloys, the crystalline grains of as-cast and as-rolled alloys were observed by a XJP-6A optical microscope (OM) and a FEI Quanta-250 scanning electron microscope (SEM) with electron backscattered diffraction (EBSD) respectively, as shown in Fig.1. The atomic number elements distribution of both as-cast and as-rolled alloys were characterized by backscattered electron (BSE) images and the composition of the segregation phases was analyzed by energy dispersive X-Ray spectroscopy (EDX), as shown in Fig.2. Besides, the surface of samples without discharge products after battery test was observed by Quanta-200 SEM.
2.3. Self-corrosion
The self-corrosion rate was tested by hydrogen collection method. The samples were evaluated by exposed a square surface area of 1 cm2 (10 mm×10 mm) in 2 mol L-1 NaCl solutions for 48h and 4 mol L-1 NaOH solutions for 2 h at room temperature (298 K). The surface was ground with sandpaper, cleaned with doubly distilled water and dried with a hair dryer. The corrosion rate was calculated by the following formula:
(ml∙cm-2∙min-1
) (1)
2.4. Electrochemical measurements
2.5. Battery test
The Al-air battery unit which was used in this paper is similar to the one in Sun’s study [18]. The battery unit consists of anode, cathode and electrolyte, where the anode is as-cast or as-rolled Al-0.5Mg-0.1Sn-0.05Ga-0.05In alloy, cathode is gas diffusion electrode with a double-layer structure of gas diffusion and MnO2 catalytic layers, and the electrolyte is 2 mol L-1 NaCl or 4 mol L-1 NaOH solution, respectively. The surface area of the anode and cathode exposed to the electrolyte is 1 cm2 (10 mm×10 mm). The discharge performance of Al-air batteries was investigated by galvanostatic discharge test at the current density of 20 mAcm-2 for a duration of 4 h with the Land test system. The weight loss of anodes was measured in every test. The anode efficiency (η), capacity density and energy density were calculated by the following formula:
Anode efficiency η = It/ (△mF/9.0) (2) Capacity density = It/△m (3) Energy density = UIt/△m (4)
Where η is the anode efficiency, %; I is the current, A; t is the time, s; △m is the weight loss, g; F is the Faraday constant; U is the average voltage, V.
All above electrochemical and battery tests repeated for at least three times.
3. RESULTS AND DISCUSSION
3.1. Microstructure
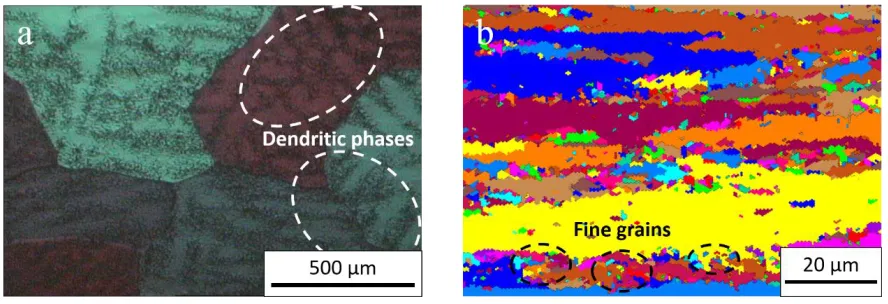
[image:4.596.79.523.591.743.2]The micrographs of the as-cast and as-rolled Al-0.5Mg-0.1Sn-0.05Ga-0.05In alloys are shown in Fig.1. In Fig.1a, the as-cast alloy has coarse grains and the grain size is about several millimeters. Moreover, dendritic segregation phases exist because of the addition of low-melting-point metal elements such as Sn (504.89 K), Ga (302.8 K) and In (429.61 K). The microstructure of as-rolled alloy shows a typical rolling structure, as the coarse fiber-texture-like grains and fine low angle grains are shown in Fig.1b. The size of fine low angle grain is from about 5 μm to 50 μm and the quantity of grain boundaries increases.
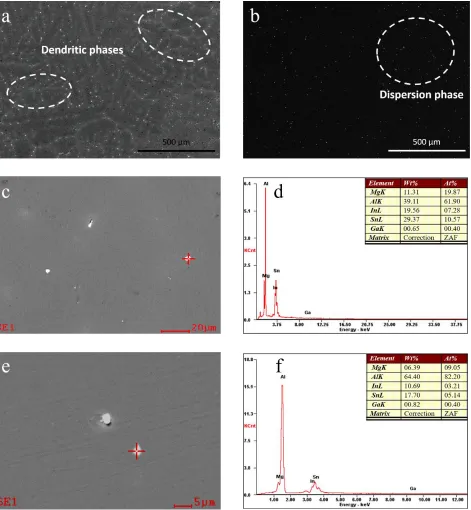
The BSE images of as-cast and as-rolled Al-0.5Mg-0.1Sn-0.05Ga-0.05In alloys are shown in Fig.2a and b. In both samples, the segregation phases (bright spots) exists. The segregation phases distribute as dendrites in Fig.2a, which is the same as that in Fig.1a. Differently, the segregation phases distribute all over the surface dispersively in Fig.2b. Which means rolling processing has an obvious significance in affecting the distribution and size of segregation phases.
[image:5.596.68.539.176.686.2]
The segregation phases of as-cast and as-rolled samples have been identified by means of EDX, shown in Fig.2c, d, e and f. The components of segregation phases are almost the same and the segregation phases of both samples mainly contain the elements Sn and In. Hence, it is confirmed that elements Sn and In are largely present in the alloys as segregation phases within the aluminum matrix. According to Reboul et al [19], the segregation phases do not participate in the activation of Al anode, apart from that the segregation phases are found in defects in the passive film where pits first initiate.
3.2. Self-corrosion and potentiodynamic polarization
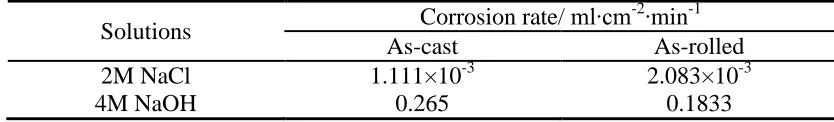
The hydrogen evolution curves for the as-cast and as-rolled Al-0.5Mg-0.1Sn-0.05Ga-0.05In alloy anodes in 2 mol L-1 NaCl or 4 mol L-1 NaOH solution are shown in Fig.3. The hydrogen evolution is mostly linear with time. Table 2 presents the corrosion rate of self-corrosion. The corrosion rate increases in the following order: as-cast (NaCl) < as-rolled (NaCl) < as-rolled (NaOH) < as-cast (NaOH). It illustrates that the corrosion rate in 2 mol L-1 NaCl solution is much lower than that in 4 mol L-1 NaOH solution. It is because the passive film on Al anode surface dissolves and a bare Al anode surface site regenerates in NaOH solution. The corrosion rate of samples decreases in 4 mol L-1 NaOH solution after rolling processing, while increases in 2 mol L-1 NaCl solution.
Figure 3. Hydrogen evolution volume of the as-cast and as-rolled Al-0.5Mg-0.1Sn-0.05Ga-0.05In alloys in different solutions: (a) 2 mol L-1 NaCl, (b) 4 mol L-1 NaOH.
Table 2. Corrosion rate of as-cast and as-rolled Al-0.5Mg-0.1Sn-0.05Ga-0.05In alloys in 2 mol L-1 NaCl or 4 mol L-1 NaOH solution.
Solutions Corrosion rate/ ml∙cm
-2∙min-1
As-cast As-rolled
2M NaCl 1.111×10⁻³ 2.083×10⁻³
[image:6.596.81.508.392.544.2] [image:6.596.87.504.658.719.2]
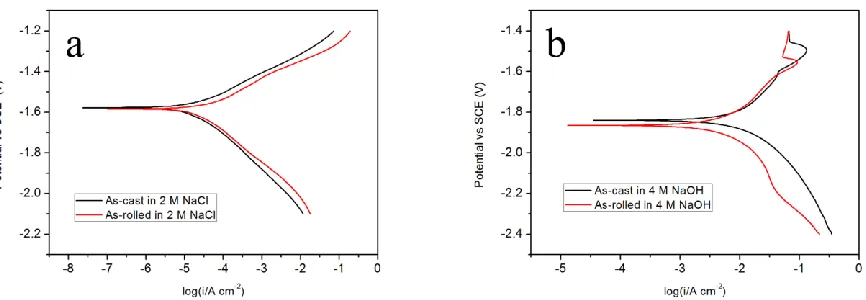
Fig.4 and Table 3 show the potentiodynamic polarization curves and corresponding corrosion parameters of as-cast and as-rolled Al-0.5Mg-0.1Sn-0.05Ga-0.05In alloy anodes in 2 mol L-1 NaCl or 4 mol L-1 NaOH solution, respectively. The corrosion potential (Ecorr) in 4 mol L-1 NaOH is more negative than that in 2 mol L-1 NaCl and polarization resistance (Rp) in 4 mol L-1 NaOH is lower than that in 2 mol L-1 NaCl, which results from the passive film on Al anode surface dissolve in 4 mol L-1 NaOH. The corrosion current density (Icorr) increases in the following order: as-cast (NaCl) < as-rolled (NaCl) < as-rolled (NaOH) < as-cast (NaOH), which shows a similar trend to the corrosion rate. The Ecorr value of as-rolled alloy is more negative than that of as-cast alloy in 4 mol L-1 NaOH. However, the Ecorr value has no significant difference in 2 mol L-1 NaCl solution. The absolute value of cathodic Tafel slope (bc) of the as-rolled anode is smaller than that of the as-cast anode in 2 mol L-1 NaCl, and the absolute value of cathodic Tafel slope (bc) of the as-cast anode is smaller that of the as-rolled anode in 4 mol L-1 NaOH. This phenomenon suggests that the as-rolled anode exhibits more active hydrogen evolution behavior in 2 mol L-1 NaCl, and the as-cast anode exhibits more active hydrogen evolution behavior in 4 mol L-1 NaOH from the electrochemical kinetics.
Figure 4. Potentiodynamic polarization curves for as-cast and as-rolled Al-0.5Mg-0.1Sn-0.05Ga-0.05In alloys measured in different solutions at a scan rate of 1 mVs−1: (a) 2 mol L-1 NaCl, (b) 4 mol L-1 NaOH.
[image:7.596.76.509.337.487.2]
Table 3. Corrosion parameters of as-cast and as-rolled Al-0.5Mg-0.1Sn-0.05Ga-0.05In alloys in 2 mol L-1 NaCl or 4 mol L-1 NaOH solution.
Solutions Ecorr/V vs. SCE Icorr/A∙cm -2
Rp/Ω∙cm2 bc/mV∙dec-1 As-cast As-rolled As-cast As-rolled As-cast As-rolled As-cast As-rolled 2M NaCl -1.578 -1.584 1.128×10⁻⁵ 2.523×10⁻⁵ 2137.3 1021.0 -131 -129 4M NaOH -1.840 -1.865 9.494×10⁻³ 4.965×10⁻³ 4.6 8.3 -176 -187
3.3. Electrochemical impedance spectroscopy (EIS)
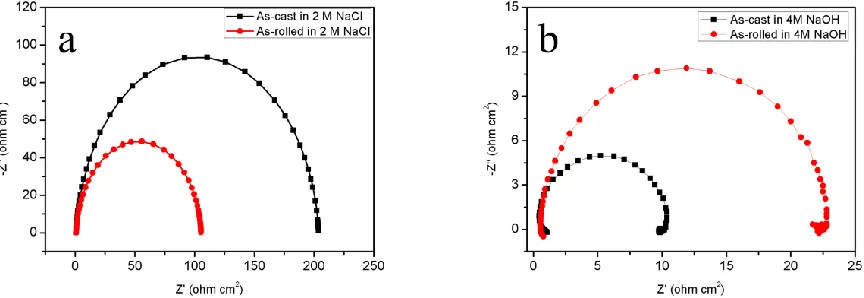
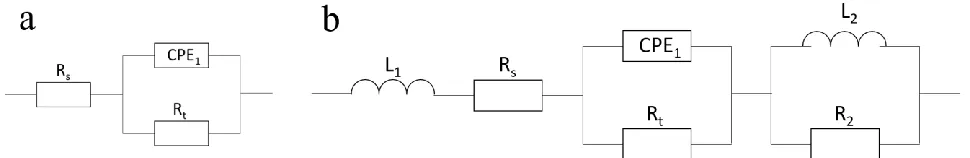
Fig.5 shows the EIS curves for as-cast and as-rolled Al-0.5Mg-0.1Sn-0.05Ga-0.05In alloy anodes measured in 2 mol L-1 NaCl or 4 mol L-1 NaOH solution. Fig.6 shows the equivalent circuits for simulating the processing and the fitting values of impedance parameters are listed in Table 4. Fitting values are obtained by Zsimpwin software for the equivalent elements. The χ2 is the precision of the simulated data. Only one capacitive loop appears at whole frequencies spectrum in 2 mol L-1 NaCl solution in Fig.5a and the capacitive loop is attributed to the charge transfer resistance (Rt) in parallel with the double-layer capacitance. The equivalent circuit for simulating this processing is shown in Fig.6a. In Fig 6a, Rs represents the solution resistance and Rt is the charge-transfer resistance. In order to obtain more precious fitting results, the double-layer capacitance is substituted for constant phase element (CPE).
In 4 mol L-1 NaOH solution, the EIS is characterized by one capacitive loop at high frequencies and two inductive loops at high and low frequencies in Fig.5b. The equivalent circuit for simulating this processing is shown in FigFig.6b. The inductive loop at high frequencies may result from the hydrogen adsorption of hydrogen evolution reaction and the inductive loop at low frequencies may be attributed to the dissolution precipitation on the Al anode surface [16]. The equivalent circuit for simulating this processing is shown in Fig.6b. L1 is the corresponding parameter for hydrogen adsorption processing. Rs, Rt and CPE1 represent the same meaning with that in 2 mol L-1 NaCl. L2 and R2 represent corresponding parameters for the dissolution precipitation processing.
[image:8.596.78.510.563.712.2][image:9.596.88.507.245.391.2]
Figure 6. Equivalent circuit of as-cast and as-rolled Al-0.5Mg-0.1Sn-0.05Ga-0.05In alloys in different solutions: (a) 2 mol L-1 NaCl, (b) 4 mol L-1 NaOH.
Table 4. EIS fitting values of as-cast and as-rolled Al-0.5Mg-0.1Sn-0.05Ga-0.05In alloys in 2 mol L-1 NaCl or 4 mol L-1 NaOH solution.
2M NaCl 4M NaOH
As-cast As-rolled As-cast As-rolled
L1(H·cm2) - - 3.509×10⁻⁷ 5.535×10⁻⁸
Rs (Ω·cm2) 0.764 0.768 0.128 0.532
CPE1(F·cm−2) 2.516×10⁻⁵ 3.284×10⁻⁵ 3.370×10⁻⁵ 4.388×10⁻⁵
n1 (0 < n < 1) 0.949 0.954 1.000 0.9872
Rt (Ω·cm2) 203.2 104.7 9.991 22.000
L2(H·cm2) - - 1.964×10⁻⁵ 1.017×10⁻⁶
R2 (Ω·cm2) - - 0.8675 1.218
χ2
7.501×10⁻³ 7.187×10⁻³ 8.773×10⁻⁴ 2.496×10⁻⁴
In general, the higher Rt reflects a lower corrosion rate since the exchange current is directly associated with the electrochemical processing of corrosion [20]. Table 4 shows that Rt decreases in the following order: as-cast (NaCl) > as-rolled (NaCl) > as-rolled (NaOH) > as-cast (NaOH). This indicates that the corrosion rate increases in this order. This result is consistent with that of hydrogen collection. The Rt of as-rolled Al alloy is higher than that of as-cast Al alloy in 4 mol L-1 NaOH because the homogeneity of alloy enhanced by dispersive segregation phases formed by rolling processing. However the lower Rt of as-rolled Al alloy in 2 mol L-1 NaCl results from dispersive segregation phases forming more defects in the passive film.
3.4. Battery performance
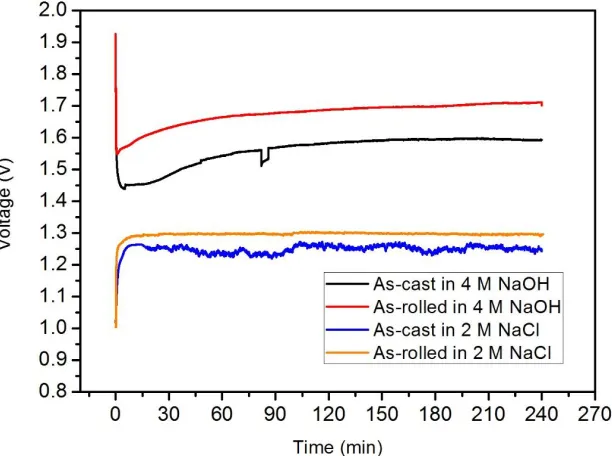
Table 5 summarizes the performance of Al-air battery employing as-cast and as-rolled Al anodes in 2 mol L-1 NaCl or 4 mol L-1 NaOH solution. In Table 5, Al-air battery with Al anodes in 2 mol L-1 NaCl solution shows a higher anode efficiency due to the low corrosion rate resulted from the protective film on the anode surface. However, Al-air battery with Al anodes in 2 mol L-1 NaCl displays a lower voltage than that in 4 mol L-1 NaOH. In 4 mol L-1 NaOH, the average voltage of the as-cast anode is 1.560 V, and the average voltage of the as-rolled Al anode is 1.675 V, as the average voltage increased by 0.115 V. However in 2 mol L-1 NaCl, the average voltage of Al-0.5Mg-0.1Sn-0.05Ga-0.05In anode is increased by only 0.046 V after rolling processing. This indicates that rolling processing should improve the average voltage, especially in 4 mol L-1 NaOH. The anode efficiency of the as-rolled Al anode is higher than that of the as-cast Al anode in 2 mol L-1 NaCl or 4 mol L-1 NaOH solution respectively. This indicates that rolling processing improves the anode efficiency in both solutions, which may result from the homogeneity of alloy enhanced by dispersive segregation phases produced after rolling processing. The energy density of the as-cast Al anode is 2079 mWh g-1, and the energy density of the as-rolled Al anode is 2682 mol L-1Wh g-1, which increases the energy density by 29.0% in 4 mol L-1 NaOH. And the increase of that in 2 mol L-1 NaCl is only 13.4%.
[image:10.596.137.443.453.681.2]In general, the as-rolled Al anode shows better discharge performance than as-cast Al anode, while the degree of increase is greater in 4 mol L-1 NaOH due to the passive film on Al anode surface in NaCl solution. The battery containing as-rolled Al-0.5Mg-0.1Sn-0.05Ga-0.05In alloy as anode shows higher anode efficiency (83.9%) in 2 mol L-1 NaCl, and higher discharge voltage (1.675 V) in 4 mol L-1 NaOH. Table 6 shows some discharge performance parameters of similar anodes for Al-air battery in previous literature [21, 22].
Table 5. The discharge performance parameters of air battery based on as-cast and as-rolled Al-0.5Mg-0.1Sn-0.05Ga-0.05In alloys at a current density of 20 mA cm−2 for 4 h in 2 mol L-1 NaCl or 4 mol L-1 NaOH solution.
Solutions States Average voltage (V)
Capacity density (mAh g-1)
Anode efficiency
(%)
Energy density (mWh g-1)
2M NaCl As-cast 1.250 2286 76.7 2856
As-rolled 1.296 2500 83.9 3240
4M NaOH As-cast 1.560 1311 44.7 2079
As-rolled 1.675 1601 53.7 2682
Table 6. The discharge performance parameters of similar anodes for Al-air battery in previous literature [21, 22]
Solutions Anodes Average voltage
(V)
Anode efficiency (%) 2M NaCl
Al-1Mg-0.1Ga-0.1Sn [21] 1.09 73.5
Al-1Mg-1Zn-0.1Ga-0.1Sn [21] 1.17 74.3
Al-0.5Mg-0.1Sn-0.02In [22] 0.43 85.4
4M NaOH
Al-1Mg-0.1Ga-0.1Sn [21] 1.56 22.3
Al-1Mg-1Zn-0.1Ga-0.1Sn [21] 1.60 36.7
Al-0.5Mg-0.1Sn-0.02In [22] 1.22 4.6
By comparison, the as-rolled Al-0.5Mg-0.1Sn-0.05Ga-0.05In anode in this work in 4 mol L-1 NaOH solution has highest average voltage and anode efficiency. And in 2 mol L-1 NaCl solution, the as-rolled Al-0.5Mg-0.1Sn-0.05Ga-0.05In anode in this work has higher average voltage and anode efficiency than 1Mg-0.1Ga-0.1Sn anode and 1Mg-1Zn-0.1Ga-0.1Sn anode. However, Al-0.5Mg-0.1Sn-0.02In has the higher anode efficiency (85.4%) but lowest average voltage (0.43V). Therefore, there is feasibility using as-rolled Al-0.5Mg-0.1Sn-0.05Ga-0.05In alloy as anode for Al-air battery in 2 mol L-1 NaCl or 4 mol L-1 NaOH solution.
3.5. Surface analysis after discharge
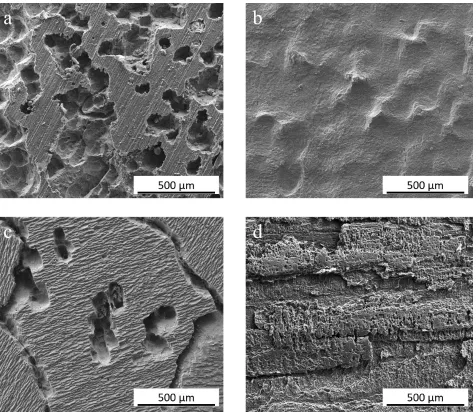
Fig.8 presents the surface morphologies of as-cast and as-rolled Al anodes after discharging at a current density of 20 mA cm−2 for 4 h in 2 mol L-1 NaCl or 4 mol L-1 NaOH solution. It can be seen that the surface morphology of Al anodes is associated with discharge performance. The morphologies of Al anodes in 4 mol L-1 NaOH show intense corrosion compared to that in 2 mol L-1 NaCl, due to the passive film on Al anode surface can be dissolved by NaOH solution.
[image:11.596.87.508.126.226.2] [image:11.596.90.507.284.399.2]
passive film remains on the Al anode surface, which will hinder the discharge reaction. The rolling processing makes the segregation phases distributed dispersively all over the surface of Al anode, which results in the local corrosion based on segregation phases cover the entire surface, as shown in Fig.8b. It seems like a kind of uniform corrosion. The flat morphology of the as-rolled Al anode leads to a better discharge performance, as the voltage, anode efficiency and energy density is higher in Table 5 and the voltage fluctuation is less in Fig.7. Because the surface area of as-rolled Al anode for discharge reaction is larger than that of as-cast Al anode, although it shows higher corrosion rate for as-rolled one. Moreover, the spalling aluminum hydroxides generated during the discharge reaction can occupy the pitting pore which results in resistance to current flow. Thus, the rolling processing promotes the discharge activity of Al-0.5Mg-0.1Sn-0.05Ga-0.05In alloy anode.
[image:12.596.66.542.263.676.2]
The morphology of the as-cast Al anode in 4 mol L-1 NaOH shows a reticular crack structure with pitting pore and flat in Fig.8c. The pitting pore is the same as that in Fig.8a, which results from segregation phases. The formation of the crack structure is due to corrosion along the {100} surface develops preferentially. The reason of that is because of the minimum elastic modulus, lowest intensity and worst interatomic bonding force in {100} direction of Al anode [21]. It can be inferred that the flat corresponds to that {100} plane. The morphology of the as-rolled Al anode in 4 mol L-1 NaOH displays a porous surface structure as finer pitting pores distributed dispersively over the whole surface, as shown in Fig.8d. This porous surface can be a great channel to transfer ions between the solution and the anode surface. It is consistent with the result in Fig.7 that the battery with as-rolled Al anode discharges more stably. Furthermore, the corrosion develops along specific orientation. The orientation in Fig.8d is similar to that in Fig.1b, which is the grain boundary morphology after rolling processing. The more grain boundaries exist, the more crystal defects exist which provides more channels for anode reaction [17]. The voltage of the battery with as-rolled Al anode is higher than that with as-cast Al anode, as can be seen in Fig.7. This indicates that the as-rolled Al-0.5Mg-0.1Sn-0.05Ga-0.05In alloy anode obtains a higher discharge activity.
4. CONCLUSIONS
1) The microstructure of Al-0.5Mg-0.1Sn-0.05Ga-0.05In alloy anode optimized by rolling processing has a close connection with its discharge performance and corrosion property. After rolling processing, the segregation phases of Al alloy anode undergoes a transformation from as dendrites to dispersive and the quantity of grain boundaries increases.
2) Compared with the as-cast Al-0.5Mg-0.1Sn-0.05Ga-0.05In alloy anode, the as-rolled alloy anode exhibits lower self-corrosion rate in 4 mol L-1 NaOH solution, but higher self-corrosion rate in 2 mol L-1 NaCl solution.
3) In 4 mol L-1 NaOH solution, the battery voltage of air battery with as-rolled Al-0.5Mg-0.1Sn-0.05Ga-0.05In alloy anode increases to 1.675 V, the anode efficiency increases to 53.7%, the energy density increases to 2682 mWh g-1. In 2 mol L-1 NaCl solution, the battery voltage of Al-air battery with as-rolled alloy anode increases to 1.296 V, the anode efficiency increases to 83.9%, the energy density increases to 3240 mWh g-1. And the surface morphologies after discharge indicates that rolling processing has a positive effect on discharge activity. Therefore, the rolling processing improves the discharge performance, anode efficiency and energy density of air battery with 0.05In alloy anode. And it is feasible for as-rolled Al-0.5Mg-0.1Sn-0.05Ga-0.05In alloy to be used as anode material for Al-air battery in 2 mol L-1 NaCl or 4 mol L-1 NaOH solution.
ACKNOWLEDGEMENT
References
1. H. Wang, D.Y.C. Leung, M.K.H. Leung, Appl. Energy, 90 (2012) 100.
2. D.R. Egan, C. Ponce de León, R.J.K. Wood, R.L. Jones, K.R. Stokes, F.C. Walsh, J. Power Sources, 236 (2013) 293.
3. R.K. Morris, G.A. Ottewill, B.D. Barker, F.C. Walsh, R.K. Morris, G.A. Ottewill, B.D. Barker, Int. J. Eng. Edu., 18 (2002) 379.
4. X. Zhang, S.H. Yang, H. Knickle, J. Power Sources, 128 (2004) 331. 5. G.M. Wu, S.J. Lin, C.C. Yang, J. Membr. Sci., 280 (2006) 802. 6. J. Bernard, M. Chatenet, F. Dalard, Electrochim. Acta, 52 (2006) 86.
7. M.A. Amin, S.S. Abd El-Rehim, E.E.F. El-Sherbini, S.R. Mahmoud, M.N. Abbas, Electrochim. Acta, 54 (2009) 4288.
8. D.O. Flamini, S.B. Saidman, J.B. Bessone, Thin Solid Films, 515 (2007) 7880. 9. A.M.M.M. Adam, N. Borràs, E. Pérez, P.L. Cabot, J. Power Sources, 58 (1996) 197.
10. X.X. Zeng, J.M. Wang, Q.L. Wang, D.S. Kong, H.B. Shao, J.Q. Zhang, C.N. Cao, Mater. Chem. Phys., 121 (2010) 459.
11. H. Jung, A. Alfantazi, Electrochim. Acta, 51 (2006) 1806. 12. X.Y. Wang, D.Y. Li, Electrochim. Acta, 47 (2002) 3939.
13. T. Balusamy, S. Kumar, T.S.N. Sankara Narayanan, Corros. Sci., 52 (2010) 3826. 14. B. Zhang, Y. Li, F. Wang, Corros. Sci., 49 (2007) 2071.
15. L. Fan, H. Lu, J. Power Sources, 284 (2015) 409.
16. L. Fan, H. Lu, J. Leng, Z. Sun, C. Chen, J. Power Sources, 299 (2015) 66. 17. L. Fan, H. Lu, J. Leng, Electrochim. Acta, 165 (2015) 22.
18. Z. Sun, H. Lu, J. Electrochem. Soc., 162 (2015) A1617.
19. M.C. Reboul, P. Gimenez, J.J. Rameau, Corros. -Houston Tx-, 40 (1984) 366. 20. T. Hong, Y.H. Sun, W.P. Jepson, Corros. Sci., 44 (2002) 101.
21. J. Ma, J. Wen, J. Gao, Q. Li, Electrochim. Acta, 129 (2014) 69. 22. J. Ma, J. Wen, H. Zhu, Q. Li, J. Power Sources, 293 (2015) 592.
![Table 6. The discharge performance parameters of similar anodes for Al-air battery in previous literature [21, 22]](https://thumb-us.123doks.com/thumbv2/123dok_us/1810925.136362/11.596.90.507.284.399/table-discharge-performance-parameters-similar-battery-previous-literature.webp)