2
About the authors
Gerard Domínguez-Reig, Senior Researcher, Post-16 and Skills. Gerard previously worked as a coordinator for the UNESCO Chair in Education and Technology at the Open University in Catalonia, and as a Policy and Research Assistant at the Catalan Ministry of Justice. Gerard co-authored EPI’s ‘Remaking tertiary education’, ‘Apprenticeships for Northern Growth’, ‘Education for our Economic Future’, ‘Apprenticeship training in England –a cost-effective model for firms?’, and ‘UTCs: are they delivering for young people and the economy?’.
David Robinson, Director, Post-16 and Skills. David’s background includes six years at the Department for Education, as the lead analyst first on school accountability and then on capital funding. David led on the analysis and research that informed the reforms to school accountability, most notably the development of the Progress 8 measure. He also led the economic analysis of the department’s capital funding proposals during the 2015 Comprehensive Spending Review.
About the Education Policy Institute
The Education Policy Institute is an independent, impartial, and evidence-based research institute that promotes high quality education outcomes, regardless of social background. We achieve this through data-led analysis, innovative research and high-profile events.
Education can have a transformative effect on the life chances of young people, enabling them to fulfil their potential, have successful careers, and grasp opportunities. As well as having a positive impact on the individual, good quality education and child wellbeing also promotes economic productivity and a cohesive society.
Through our research, we provide insight, commentary, and a constructive critique of education policy in England – shedding light on what is working and where further progress needs to be made. Our research and analysis spans a young person's journey from the early years through to entry to the labour market.
Our core research areas include:
Benchmarking English Education
School Performance, Admissions, and Capacity Early Years Development
Vulnerable Learners and Social Mobility Accountability, Assessment, and Inspection Curriculum and Qualifications
Teacher Supply and Quality Education Funding
Higher Education, Further Education, and Skills
3
Acknowledgements
This report has been commissioned by Pearson.
Pearson is the world’s learning company operating in 70 countries around the world with more than 24,000 employees, providing a range of products and services that help people make progress in their lives through learning.
For more visit www.pearson.com, and follow @Pearson
This publication includes analysis of the National Pupil Database (NPD): https://www.gov.uk/government/collections/national-pupil-database
The Department for Education is responsible for the collation and management of the NPD and is the Data Controller of NPD data. Any inferences or conclusions derived from the NPD in this publication are the responsibility of the Education Policy Institute and not the Department for Education.
All maps in this publication contain National Statistics data © Crown copyright and database right 2016. Contains OS data © Crown copyright and database right 2016.
This work is licensed under a Creative Commons Attribution-NonCommercial-ShareAlike 4.0 International License. For more information, visit: creativecommons.org
4
Contents
Foreword: Education Policy Institute ... 5
Foreword: Pearson ... 6
Executive summary ... 7
Introduction ... 10
Chapter 1. Changes to 16-19 funding policy ... 13
Chapter 2. Trends in 16-19 education funding ... 17
Chapter 3. Changes in the financial health of providers ... 30
Chapter 4. Changes in qualification take-up ... 37
Chapter 5. Further education teaching workforce trends ... 51
Chapter 6. Ofsted inspections trends ... 57
Conclusions and discussion ... 63
5
Foreword: Education Policy Institute
The Education Policy Institute is an independent, impartial and evidence-based research institute which aims to promote high quality education outcomes for all, through analysis that both informs and influences the policy debate in England and internationally.
The funding of education, in total and by phase, is clearly an important policy issue and is often at the centre of public and political debates about education. Later this year, the UK government is expected to set out multi-year public spending plans. EPI is therefore publishing a series of reports covering school funding issues, 16-19 funding, and the options for reform of the post-18 funding system.
Although there has over recent decades been a significant expansion in participation in publicly funded post-16 English education, 16-19 funding appears to have been the biggest relative "loser" from education spending changes over the last 25 years (IFS 2018).
This report looks in detail at the trends in 16-19 spending since 2010, comparing these with other phases of education, and investigating the impact of the decline in real terms spending which has occurred. EPI researchers have looked at the spending changes experienced by different 16-19 providers across England and have assessed the possible impacts on provider finances, trends in learning hours, staff pay, and institutional performance.
The conclusions are important, and deserve careful consideration by researchers and policy-makers before future spending plans are established for the period beyond April 2020. Why has 16-19 real per student funding declined, both in absolute terms and relative to other phases? Is this as a result of deliberate judgements about the appropriate levels at which to fund students in the secondary and 16-19 phases, or has the change in funding been the unintended outcome of other policy and political decisions? This report helps answer those questions.
As ever, we welcome comments on the analysis and conclusions of this research.
6
Foreword: Pearson
As the UK leaves the European Union, and starts to think about future economic and social growth in a post Brexit world, it has perhaps never been more important to consider the way in which future generations of adults will be trained and developed.
Indeed, beyond the immediate, sometimes all-consuming discussions around Brexit, there remain significant labour market challenges on the horizon which the UK cannot shy away from. How will the UK respond to the ongoing digital transformation of much of the current economy with its enormous impact on the skills needed for new and existing jobs? What will an increased focus on reducing carbon emissions mean for businesses, particularly in energy intensive sectors? How will businesses leverage the experience and adapt to the reality of a workforce that is skewing older? How will we reskill and retrain at scale? And how will we encourage adults, particularly those who may have had a poor experience in their younger years, to re-engage with education?
Whatever the answer to these questions, in the medium term it is clear that our education system needs to support learners to respond to a changing workplace. 16-19 education is a critical time in the education system because for many young people it will be the first time that a wealth of options opens up. They will need to seriously consider what they want to do in life. And that means deciding which education pathways, qualifications and skills to pursue so they can realise their ambitions and aspirations.
At Pearson our mission is to help people make progress in their lives through learning. This includes ensuring there is choice available to young people. Young people at 16 should have three broad routes open to them: an academic pathway which would tend to lead in most instances to higher education; a career focussed pathway, including BTECs, which allows options both for further study or for work; and the more specialised occupational pathway including T Levels and apprenticeships. But for such options to be a reality for young people, it is imperative that schools and colleges are funded to offer high-quality choices. Although it is reassuring to learn that most institutions have maintained an element of high-quality provision for students across all learning routes, this report also highlights that funding levels have been reduced significantly over time for this group. This means that difficult choices have had to be made - such as reducing the courses on offer, restricting the number of hours for which a course can be taught, or removing the valuable advice and
guidance support structures that can help young people deal with their choices and think about their next steps. The report is right to call for a fuller assessment of how much the curriculum has
narrowed in this area, and to explore what the impact has been on disadvantaged students in particular
The current 16-19 funding levels do not support the future our young people or our country, especially at a time when the number of 16-19 year olds is predicted to rise. That is why, ahead of the Spending Review expected in the autumn, we support the report’s main recommendation that the fundamental basis of 16-19 funding be reviewed to enable choices to remain that can deliver success. This funding should not be considered a cost as much as an investment - an investment that will pay back for our country and our students. In a changing and potentially demanding future world, they deserve nothing less.
7
Executive summary
Education for 16 to 19-year olds has experienced the sharpest cuts to real funding over the last decade, compared to the early years, primary, secondary and higher education phases. This report provides an updated assessment of the funding squeeze and explores the impact of funding cuts, including how these vary across different types of institutions, groups of pupils and across the country. It also considers how funding has affected the breadth and depth of
qualifications, teacher wages in colleges and the quality of 16-19 provision as measured by Ofsted.
16-19 education funding has fallen across all provider types and by twice the size of cuts to
school funding
For many years, funding for 16-19 education was more generous than for primary and secondary. The gap began to close in the early 90s, and 16-19 education is today funded at a lower rate per student than secondary education, and the gap between 16-19 and primary education funding has reduced substantially. This is a major shift in education funding policy.
Our new analysis calculates that funding per student fell by 16 per cent in real terms between 2010/11 and 2018/19, from £5,900 to £4,960. This is twice the rate (8 per cent) at which all school spending fell from 2009/10 to 2017/18. This decline, together with a decrease in the 16-19
population, led to a real-terms fall in total 16-19 funding of 27 per cent, from £7.8bn to £5.7bn, over the period 2010/11 to 2018/19.
Funding per 16-19 full-time equivalent student in the further education sector has fallen from £6,250 per full-time student in 2010/11 to £5,150 in 2018/19, or by 18 per cent in real terms. The funding fall has been smaller than in school sixth forms, where funding fell by 26 per cent from £6,280 to £4,680 over the same period. Within the further education sector, further education colleges have experienced smaller falls than sixth form colleges partly because disadvantaged students are more likely to study in those institutions, and funding to compensate providers for challenging intakes has increased. Between 2012/13 and 2018/19, for which data exist to consider these institution types separately, funding per full-time student in sixth form colleges fell by 15 per cent, from £5,180 to £4,430 per student. Funding per student in further education colleges fell by 9 per cent from £5,870 to £5,320.
Funding for student support (including bursaries to learners aged 16 to 19) fell more than other funding streams, by 71 per cent in real terms between 2010/11 and 2018/19. Funding for
programme delivery decreased by 30 per cent, while disadvantage and high needs funding combined grew by 68 per cent. Funding for 16-18 apprenticeships fell by 11 per cent between 2010/11 and 2017/18.
The financial health of all provider types has deteriorated
8
The proportion of local authority maintained schools with sixth forms with accumulated deficits increased at a faster rate than those without sixth forms. Schools with sixth forms in deficit increased from 12 per cent in 2010/11 to 22 per cent in 2017/18, compared to an increase from 6 to 9 per cent amongst schools without sixth forms.
The proportion of sixth form colleges with in-year deficits increased five-fold between 2010/11 and 2016/17, from 7 per cent to 36 per cent. It doubled in further education colleges over the same period, from 20 per cent to 40 per cent.
Students are getting fewer learning hours, especially in academic qualifications
The amount of guided learning hours for 16-19 students decreased by nine per cent between 2012/13 and 2016/17, falling from 730 hours to 665 hours per student. While overall learning hours per student decreased, GCSE-level study increased, which is likely to be as a result of the new English and maths resits policy.
Between 2012/13 and 2016/17 learning hours per student in academic level 3 qualifications fell by 21 per cent, from 418 to 331 hours per student. This was largely as a result of a decrease in AS level provision. Learning hours per student in vocational level 3 study increased by 18 per cent from 170 to 201 over the same period.
Institutions with larger funding decreases experienced sharper falls in learning hours on average, though this relationship is weak.
Teaching staff in further education colleges and sixth form colleges have seen their wages fall
in real terms
On average, teacher wages in further education colleges fell by 8 per cent in real terms between 2010/11 and 2016/17, from £33,600 to £31,000. Teacher wages in further education colleges are 17 per cent lower than in secondary schools (£36,700). The fall was less acute in sixth form colleges, where the average teaching wage decreased from £39,900 to £39,000.
Colleges with larger funding decreases are more likely to have experienced larger reductions in teaching wages, though this relationship is weak.
There are no clear trends in Ofsted judgements of 16-19 effectiveness
In 2017/18, 72 per cent of schools received “good” or “outstanding” grades for their 16-19 provision, compared to 57 per cent in 2010/11. However, the proportion judged “inadequate” also increased slightly to five per cent up from two per cent in 2010/11. Changes to the common
inspection framework mean that comparisons over time must be treated with caution. One in three schools inspected were found to have better 16-19 provision than their overall effectiveness, up from one in six in 2010/11.
9
We have not found a relationship between recent changes in funding and Ofsted grades for 16-19 provision. However, changes to the inspection framework mean that data for different years might not be fully comparable.
Conclusions and recommendations
From 2010, provision for 16-19-year olds has experienced significantly sharper cuts to funding than in other education stages – around double the rate of cuts seen in all school phases.
This has resulted in more institutions falling into deficit, and there has been a reduction in students’ learning hours, with particularly large falls in academic qualifications. Teachers in further education colleges have suffered a significant decline in their real wages. However, the link between funding, learning hours and wages is weak, suggesting that there may be other factors driving these trends. And, although making comparisons over time is difficult, there is no evidence from Ofsted gradings of an impact on these ratings from the recent decline in real funding.
Rising deficits suggest that some providers have used their balance sheet to cushion falls in funding to avoid more serious declines in provision or quality. This is not sustainable in the long term. If providers’ financial health continues to deteriorate as a result of falls in funding, then provision and quality could be further compromised, with potentially more severe effects on students and providers.
Therefore, policymakers should give consideration to the following recommendations: Review the adequacy of 16-19 funding. Funding for this phase of education has declined
substantially more than in primary and secondary education, despite being funded at higher rates in the past. There seems to be little rationale for this change, and our research shows that the sector as a whole is in worse financial shape and that provision has shrunk. The government should ensure that the current 16-19 funding review looks at the adequacy of funding for this phase, to understand whether current funding rates can sustain quality provision in the long term without further
jeopardising the sector’s financial sustainability.
Address the narrowness of 16-19 education. Students are generally receiving fewer learning hours than in previous years. The decoupling of AS and A levels has resulted in a dramatic fall in AS levels, that has not been compensated with additional provision. Given that the 16-19 curriculum in England was already narrow compared to top-performing countries, this is likely to further compromise the breadth of post-16 education. With relevant international studies showing that England stands out for the low levels of basic skills of its young people, the government should assess the impact of 16-19 funding changes on curriculum breadth and ensure that young people have a good choice of high quality post-16 academic and vocational qualifications.
Ensure that future funding allocations do not leave disadvantaged students worse off. Student support has faced a dramatic fall, and despite providers attracting more funding to compensate for challenging intakes, disadvantaged students do not seem to be in providers where learning hours have been protected. There is also a scarcity of evidence of whether the decline in 16-19 funding has exacerbated the gaps between disadvantaged students and their more affluent peers. The
10
Introduction
Recent research shows that, since 2010, funding arrangements across the education sector have changed repeatedly, reshaping the qualification and provider landscape, and rebalancing different, and sometimes contradictory, priorities. Reforms and changes enacted since 2010 have seen a rise in funding per student in higher education and early years, while other stages of education have experienced falls in their budgets. 1 In the past decade, the 16-19 education phase has experienced a
number of reforms and gone through a period of notable instability. As this report will describe, the 2010 spending review required substantial savings, altering the balance between programme provision, student support, and arrangements for disadvantaged students. A string of reforms followed, notably a sharp decline in funding for student support, a new funding formula, and further savings in successive spending reviews. Given the pace of reforms since 2010 and their impact on funding, alongside the relative paucity of data for earlier years, the focus of this report will be 2010 onwards.
The reforms enacted since 2010 have not been restricted to funding arrangements. The 2011 Wolf Review of Vocational Education has had a strong influence on provision. It recommended, among other things, raising the requirements for vocational qualifications to be approved, and that funding should be distributed per student, rather than per qualification.
Other reforms that changed the 16-19 landscape included the government’s support for the academisation process, with many 16-19 institutions, or institutions with sixth form provision, abandoning their previous status to become an academy. New legislation on free schools has prompted the appearance of new providers such as University Technical Colleges and Studio Schools, as well as specialist institutions. 2
These reforms have come alongside new regulations requiring young people to remain in full or part-time education or training until age 18, expanding the 16-19 education market. 3
Furthermore, significant reforms to 16-19 provision look likely to continue for some time yet. Some of the changes that may have an impact in the short and medium-term are:
The 2019 Spending Review: the government is expected to present its spending review in the next few months. The spending reviews in 2010 and 2013 resulted in substantial real terms decreases in the amount of funding for 16-19 education, as this report will discuss. Introduction and expansion of T levels: this is, arguably, one of the most important changes
to the 16-19 education landscape of the next few years. As set out in the 2016 Post-16 Skills Plan, technical qualifications will be divided in 15 routes, of which 11 will be delivered through T levels, which are expected to become the technical equivalents to A levels with clear progression routes to further study or high-skilled occupations. T levels will be funded by an additional £500m a year once they are fully introduced, by September 2023. This funding is expected to cover increased teaching hours for T levels so it is unlikely to
substantially change resource pressures on providers. A recent government consultation on T level funding concluded in February 2019, and responses are currently under
consideration. 4
11
of any payroll exceeding £3m into an apprenticeship levy to fund training. Since the levy was introduced in April 2017, the government has made changes to the original policy, including an increase to the subsidy to smaller employers, allowing companies to pass a larger proportion of their levy money on to other employers in their supply chain, or changes in funding rate bands, that increased from 15 to 30.
Level 4 and 5 qualifications review: the government is undertaking a review of higher technical qualifications, with the purpose of reducing the higher technical skills shortages in the labour market.
Post-18 funding review: the government’s review of post-18 education, which will span academic and technical higher education, is likely to have an impact on the distribution of funding for post-compulsory education. The review was launched to provide government with recommendations on how to achieve a range of objectives, namely: creating a joined-up post-18 system; ensuring that students from all backgrounds are equally able to access education and training; delivering the skills that the country needs; and offering value for money. 5
The review of post-16 level 3 and below qualifications: in March 2019, the government announced it would be reviewing the post-16 qualification landscape, focusing on level 3 qualifications and below. The government has stated that it intends to avoid overlaps between the new T levels and any other qualifications currently on offer, such as applied general qualifications. It also expects to identify qualifications of low labour-market value and that offer little or no progression to higher levels of skills, with the objective of removing their eligibility for public funding 6
Skills and Brexit: in its industrial strategy, the government acknowledged that the stark productivity gap between the United Kingdom and other top-performing economies can be explained, to a degree, by the lack of technical alternatives to academic education, and that these gaps might worsen after the United Kingdom leaves the European Union. 7
It is clear, then, that the 16-19 landscape has experienced substantial change since 2010, and will continue to do so. However, in contrast to other stages of education that have attracted more public interest, such as higher education, recent changes to 16-19 education and their effects remain under-researched. This report aims to understand how recent reforms have affected the amount and distribution of funding across the sector, and how this has affected providers, different groups of students, and the qualifications and skills landscape. The report will be structured as follows: Chapter 1 will present and summarise the key reforms and changes affecting 16-19 funding and provision.
Chapter 2 will investigate the impact of these reforms on funding for 16-19 education. It will provide funding trends for institutions (allocations), students (support), and apprenticeships; present
patterns for different funding streams; and map differences between provider types and between regions.
Chapter 3 will explore whether the financial health of providers has been affected by recent funding changes.
12
qualifications match employment growth in relevant occupations, to investigate whether provision has changed in line with skills needs.
Chapter 5 will seek to understand whether, as a result of new funding arrangements, some further education providers are becoming less able to recruit teachers with the right level of qualifications and with qualifications in areas relevant to the subjects they teach, and how working conditions have changed across providers
Chapter 6 will analyse whether the effectiveness of provision has been compromised by changes in funding levels, considering Ofsted’s judgements of 16-19 provision.
13
Chapter 1. Changes to 16-19 funding policy
In 2010, the Conservative and Liberal Democrat Coalition government took power, two years after the 2008 financial crisis, which had led to two years of negative economic growth. For most of its five year-term, growth rates, though positive, were low compared to historical trends. 8 The public
sector deficit had soared to 10 per cent in 2009/10 and exceeded the 3 per cent limit set out in the Maastricht Treaty until 2015/16.9 This was reflected in the government’s approach to public
spending, which resulted in severe tightening of public spending across all departments. The Conservative government, in power since the 2015 election, continued these trends. This section aims to summarise the main changes affecting 16-19 provision since 2010.
The 2010 Spending review and the old funding formula
Before a new funding formula was introduced in the academic year 2013/14, funding for 16-19 education provision was allocated by a formula that considered two main elements:
Programme provision costs: based on a national funding rate with several uplifts that accounted for high cost of provision, area-related cost, student retention and achievement, and area-based deprivation.
Additional learner support: additional funding was provided to account for challenging intakes. This was based on prior attainment (for school sixth forms) and historical spending (other institutions). 10
It is worth noting that funding made available to providers was not based on actual student numbers but on Standard Learner Numbers (SLN). One SLN was equal to 450 guided learning hours, which was the definition of a full-time student. 11 This would change from 2013/14, building on the
recommendations of the 2011 Wolf Review of Vocational Education, discussed later in this section. The 2010 spending review introduced substantial changes to the allocations that providers would receive, as it involved a reduction of the 16-19 education budget of around £500m.
One of the motivations behind the spending review was to divert programme funding to institutions with more challenging student populations. As a result, £150m that was previously funding
additional provision would now be allocated to institutions with higher proportions of disadvantaged students. Consequently, the entitlement to tutorial time and extracurricular activities was cut down from 114 guided learning hours to only 30. Additional savings came from removing funding for teacher’s pensions. Notably, an effort was made to close the funding gap between school sixth forms and colleges, as students in sixth form provision in colleges had historically been funded at lower rates. 12
Despite the overall falls in 16-19 funding, the government introduced protections such that no institution would lose more than three per cent of their funding per student between 2010/11 and 2011/12, and a transitional protection would be in place until 2014/15.13
With regard to student support, the Education Maintenance Allowance (EMA), funded with £550m a year, would be replaced by a new, more targeted, 16-19 bursary that would represent a third of that cost. 14 Unlike the EMA, which was paid to 16-19 year-olds from low-income households, the new
14
eligibility criteria and decide whether to transfer money to students in cash or in kind. The measure attracted criticism not least due to the evidence that the EMA had helped raise attainment and participation rates. 1516
The 2013/14 funding formula
The changes introduced by the 2013/14 funding formula responded both to financial pressures and to some of the recommendations made by the 2011 Wolf Review of Vocational Education.
The 2011 Wolf report had substantial influence on the 16-19 landscape, prompting significant changes to qualification and curriculum design and funding allocations, notably:
Courses for 16-19-year-old students should include a substantial qualification that enables them to go on to do further study or to obtain skilled employment afterwards. This built on Wolf’s view that a provider-led system had produced too many qualifications, many of them of dubious quality and no with clear labour market value.
Students who did not achieve a GCSE A*-C in English and maths would be required to obtain these qualifications as part of their 16-19 study. This followed the Wolf’s concerns around the low level of basic skills of some young people progressing to level 3 study, especially those with learning disabilities.
Funding would be on a programme basis and would follow the student. Wolf feared that the previous system was encouraging institutions to offer qualifications to maximise income rather than taking the students’ interests into account. 17
The new funding formula would not use Standard Leaner Numbers (SLN) anymore, but would instead consider actual number of students, as it would be based on a national funding rate for full-time students. The funding rate was initially set at £4,000 for all 16-19 students, although it would be reduced to £3,300 for those aged 18 or older at the start of the academic year from 2014/15. 18
The funding formula would also consider the costs of delivering different courses, a disadvantage uplift based on a geographic economic deprivation and the proportion of students who had not previously achieved the required level of English and maths, among other aspects.
15
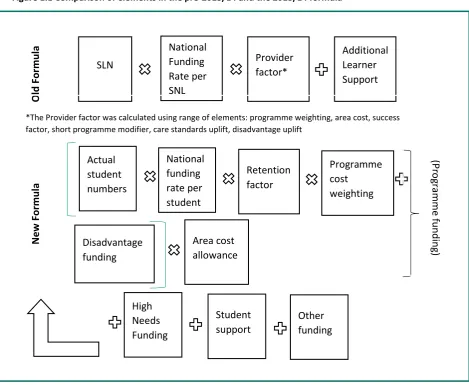
Figure 1.1 Comparison of elements in the pre-2013/14 and the 2013/14 formula
Aware that providers offering large study programmes might have ended up substantially worse off, government introduced protections so that no providers would lose any funding per student in cash terms until 2015/16 as a result of changes to the funding formula.19
The 2013 Autumn Statement
In autumn 2013, it was announced that total departmental spending would be reduced by a further 1.1 per cent. 20 As mentioned earlier, funding rates for full-time 18 year-old students decreased from
£4,000 to £3,300 from 2014/15, although, for that year only, no institution would see a decrease in programme funding of over two per cent as a result of that change.
The 2015 Spending Review
The most recent spending review took place in 2015 and it set out the spending plans for the financial years 2016-17 to 2019-20.
It established a cash terms protection of the national base rate per 16-19 student, resulting in a real-terms falls. In addition, total funding was set to decrease further, partly as a result of a declining 16-19 population, but also from decreases of funding outside the national funding rate. 21 That included
£160m in savings to be made by phasing out the funding formula protection between 2016/17 and
Old Fo rmula SLN National Funding Rate per SNL Provider factor* Additional Learner Support
*The Provider factor was calculated using range of elements: programme weighting, area cost, success factor, short programme modifier, care standards uplift, disadvantage uplift
16
2020/21. An additional £15m was saved from discretionary bursaries in further education colleges as, since the introduction of the duty to provide Free School Meals, the government perceived that double funding for the same entitlement was being provided. 22
17
Chapter 2. Trends in 16-19 education funding
This chapter explores the effects that the changes described in the previous section have had on levels of funding across the 16-19 sector. We cover the period from 2010/11 onwards, the main reasons being the observation of a change in funding trends from that academic year, and the limited availability of data for earlier years. We will seek to understand how funding has varied by:
Type of institution: we offer a comparison between school sixth forms, sixth form colleges, and further education colleges, where possible.
Funding type: we will compare how funding for challenging intakes or for provision in deprived areas has evolved compared to core programme funding.
Region: we will investigate whether total funding and different funding concepts have followed different trends in different areas.
Student background: we will attempt to identify whether institutions with more disadvantaged students have seen more or less acute funding changes.
This chapter will make use of the 16-19 funding allocations between the academic years 2010/11 and 2018/19, and of the annual reports of the Education and Skills Funding Agency and its predecessors for 16-18 apprenticeship funding. We will differentiate between four elements of funding:
Programme funding: this is the allocations received by the different institutions, which includes the national funding rate and accounts for relative costs of provision in different areas or the characteristics of the programme (e.g. length), but does not consider
disadvantage uplifts or additional funding for students with high needs. Where disadvantage uplifts are provided inside the funding formula, these have been subtracted and added to the next element.
Disadvantage and high needs: this category of funding includes two different elements. First, the disadvantage uplift, which compensates for area-based deprivation and for student populations with lower prior English and maths attainment, and is provided as part of the funding formula. Second, high needs funding, which provides additional income to providers for students requiring more of £6,000 in additional support.
Student support: this includes all funding received directly by students, usually targeting specific groups of young people to encourage participation. Depending on the year, this includes the Education Maintenance Allowance, 16-19 bursaries, residential schemes, and the Dance and Drama Awards (DaDAs).
Apprenticeships: funding for apprenticeships does not come from 16-19 allocations, which means that this funding stream does not follow the national funding formula, and therefore it is considered separately. It is only available for years up to 2017/18.
Capital funding is excluded from our analysis.
Except for apprenticeship-related allocations, the other funding categories will be broken down by institution type, notably:
18
provided. Second, the balance between programme and disadvantage and high needs funding differs largely from that in mainstream schools, and might distort the overall picture if shown together.
Further education sector: this includes all further education providers. From 2012/13, it excludes sixth form colleges. Previous research has shown that the qualification landscape for 16-19 year-olds differs largely from that in schools, and that recent policies have aimed to address lower funding rates for colleges.23
Sixth Form colleges: considered part of the further education sector, though they are 16-18 providers whose provision is more similar to school sixth forms than to colleges. As such they are therefore considered separately.
We have also generated the category Other providers, which includes all providers outside these three categories, mainly private, independent, higher education, and special providers. Trends for this fourth group are not shown, but they are included in the total funding allocations.
Unless otherwise indicated, all prices are given in real terms (2018/19 prices). To provide this comprehensive analysis, we make use of:
16-19 funding allocation data from the Young People’s Funding Agency (2010/11 and 2011/12), the Education Funding Agency (2012/13 – 2016/17), and the Education and Skills Funding Agency (2017/18 and 2018/19). Data for most of the outcomes considered is not available for 2018/19, so comparisons will use 2017/18 funding data as the final year. 16-18 apprenticeship spending from the Skills Funding Agency annual reports and accounts
(2010/11 to 2016/17) and the Education and Skills Funding agency (2017/18).
Apprenticeship learner numbers are from the Department for Education’s Apprenticeships and Traineeships statistical first releases (2010/11 to 2016/17).
Freedom of Information: provided by the Department for Education about the Education and Maintenance Allocations in the academic years 2010/11, 2011/12, and 2012/13.
Total 16-19 education funding
19
Figure 2.1 Total 16-19 Funding by stream, 2010/2011 to 2018/19 (2017/18 for apprenticeships), 2018/19 prices (£m)
However, different funding streams have followed different patterns, as figure 2.2 shows. With the phase out of the Education Maintenance Allowance (EMA) from 2010/11, student support
decreased by 71 per cent in real terms.
The second largest relative budget decrease occurred in 16-19 programme allocations (excluding disadvantage and high needs uplifts); 30 per cent in real terms. Unlike other items, the decrease in programme funding has been more gradual, as it has resulted essentially from (a) protection of funding in cash terms only, which has meant that real funding has been going down in line with inflation and student numbers, and (b) a string of reforms such as the decrease in the funding rates for 18 year-olds from 2014/15.
Funding to support institutions with challenging intakes went up dramatically in relative terms, especially between 2011/12 and 2013/14. In 2014/15, the budget attracted by the disadvantage uplift and high needs provision was 81 per cent larger in real terms than in 2010/11, although it fell slightly in the following academic years to 68 per cent. However, its relatively small size means that its contribution to 16-19 funding was limited, and it did by no means compensate for falls in other streams.
20
Figure 2.2 Evolution of total 16-19 funding in real terms by stream, 2010/2011 to 2018/19 (2010/11 = 100)
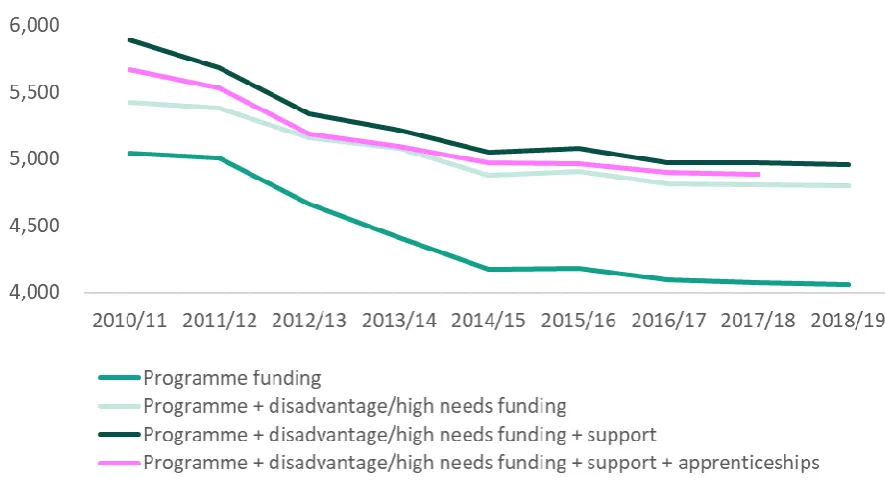
[image:20.595.75.518.480.721.2]However, the previous analysis does not account for the demographic changes that occurred over the period of study. In 2018/19, there were 15 per cent fewer students in 16-19 provision than in 2010/11, while by 2016/17 (the last year for which there is official apprenticeship take-up data) there had been a fall of four per cent in the number 16-18 learners doing an apprenticeship. Figure 2.3 displays the funding per student in 16-19 education. If we only consider 16-19 allocations made to institutions, i.e. if we exclude student support and apprenticeship funding, funding per student has fallen by 11.5 per cent (£620), or 16 per cent (£930) if student support is included. If we add apprenticeship funding to the equation, the total decrease was about £786 or 14 per cent (by 2017/18).
Figure 2.3 16-19 funding per student in real terms by stream, 2010/11 to 2018/19 (£) 24
21
increased from £4,200 in 2010/11 to £4,400 in 2016/17 which, given that overall apprenticeship funding has gone down, suggests a larger fall of learners than in other forms of provision.
If we look at 16-19 funding overall, i.e. including student support and apprenticeships, then funding per 16-19 student went down from £5,700 in 2010/11 to £4,900 in 2017/18.
The Institute for Fiscal Studies’ 2018 report suggests that school funding per student fell by eight per cent in real terms between 2009/10 and 2017/18. This is substantially below our estimated 16 per cent decrease in per 16-19 student funding (including all funding streams but apprenticeships) between 2010/11 and 2018/19. 16-19 funding is confirmed as the biggest loser from education funding since 2010, and from much earlier.25
Funding by institution type
The 16-19 education space is made up of a wide range of institutions that we have grouped into three main categories: school sixth forms, the further education sector, and sixth form colleges. Whilst sixth form colleges are considered to be part of the further education sector, they are presented separately from 2012/13. Data is also provided for 16-18 apprenticeships. Other institutions, such as special schools and independent providers, have been excluded from the analysis, either because the data was not available for the whole period, or because their provision is so specific that they might distort general trends.
Figure 2.4 shows trends in 16-19 funding by institution type, in 2018/19 prices. Sixth form colleges were included as part of the whole further education sector until 2012/13. Trends have been similar across the board, with overall funding decreasing over time, with the exception of apprenticeships, where a dip in funding has only occurred recently.
22
[image:22.595.78.462.173.424.2]Figure 2.4 excludes student support but include all 16-19 allocations obtained by institutions, including disadvantage and high needs funding. It shows that funding for further education and sixth form colleges has fallen by a third (£1.5bn), while funding in school sixth forms has decreased by a fifth or £560m, in 2018/19 prices.
Figure 2.5 16-19 funding per full-time student in real terms (exc. student support) by institution type, and apprenticeship funding per learner, 2010/11 to 2018/19 (£)
When accounting for the number of students (figure 2.5), we see different trends between
institutions. Here we use full-time equivalent student numbers from the Department for Education’s Participation in Education, Training and Employment by 16-18 year olds dataset, to account for the number of part-time students in further education. In 2010/11, both the further education sector (including sixth form colleges) and school sixth forms received similar levels of funding per full-time student, £6,250 and £6,280 respectively (real terms). By 2018/19, funding for school sixth forms had dropped by 26 per cent to £4,680. Over the same period funding for the further education sector fell by 18 per cent to £5,150, a smaller fall than for school sixth forms.
Data for further education colleges and sixth form colleges, both within the further education sector, are only available separately from 2012/13. From this data we observe that funding for sixth form colleges fell faster than funding for further education colleges. Since 2012/13 funding per full-time student in sixth form colleges fell by 15 per cent, from £5,180 to £4,430, whilst funding in further education colleges fell by 9 per cent, from £5,870 to £5,320. The smaller fall for further education colleges is partly explained by the increase in disadvantage-related funding and the fact that, in 2018/19, just under 60 per cent of all high needs 16-19 students were in further education colleges. It is also because, previously, students in further education were funded at a lower rate than in schools, and the government pledged to close that gap.
The trends analysed so far do not include student support, as the aim was to reflect the level of funding allocated to 16-19 education providers, not to students. However, this underrepresents the amount of money that is being spent on this stage of education. Figures 2.6 and 2.7 provide total
4,000 4,500 5,000 5,500 6,000 6,500
10/11 11/12 12/13 13/14 14/15 15/16 16/17 17/18 18/19
Further education sector School sixth forms
23
funding numbers, including student support, for the further education sector, school sixth forms, and sixth form colleges for the period 2012/13 to 2018/19.26
Sixth form colleges experienced the largest relative decrease in overall 16-19 funding; 34 per cent in real terms or £283m, followed by the further education colleges with 18 per cent or £586m, and school sixth forms with 13 per cent or £333m. However, as figure 2.7 shows, this largely reflects changes in the number of students attending these institutions. The data suggests that, between 2012/13 and 2018/19, overall spending per student in further education colleges has decreased by 9 per cent over the period, while it has fallen by 16 per cent or £910 in school sixth forms and by 14 per cent or £730 in sixth form colleges.
24
Figure 2.7 16-19 funding per full-time student in real terms by institution type, including student support, 2012/13 to 2018/19 (£)
A wider picture: a historic and comparative perspective of 16-19 funding
Our analysis in this chapter has analysed how funding for 16-19 education has changed since 2010/11. However, this should be placed in the context of longer funding trends and trends in other education phases.
[image:24.595.82.495.456.765.2]25 Source: Institute for Fiscal Studies, 2018
Figure 2.8 summarises findings from recent research from the Institute for Fiscal Studies. In the late 80s, 16-19 education was funded at higher rates per student than primary and secondary: per student funding was 2.6 times more generous than in primary school, and 1.5 greater than for secondary. As 16-19 funding per student started to fall in real terms, the gap between this phase of education and primary and secondary started to close, until the late 90s. Then, funding for all education stages started to grow again, although funding rates for secondary grew faster than for the 19 phase, overtaking it eventually. The chart shows that, since 2010, the funding rate for 16-19 education has fallen faster than in other stages, notably secondary education. As a result, funding per 16-19 student is now lower than for secondary students, and the large gap between 16-19 and primary education funding has reduced from 2.6 to 1.2.
It is worth considering why 16-19 funding has suffered more than other stages – the chart also shows significant rises in higher education and early years funding. One reason might be that 16-19 education used not to be compulsory, so it might not have been seen as part of the minimum entitlement that young people have to education. However, with the participation age being raised to 18 in 2013, this argument has lost validity.28 Previous EPI research found that around 40 per cent
of the attainment gap between disadvantaged and non-disadvantaged students at age 16 is already present by age five, suggesting that early intervention is desirable.29 However, given the current
differences in attainment between more and less affluent student by age 18, it is not clear that the lack of protection for post-16 education funding compared to pre-16 is justified, especially now that young people have to stay in education or training until they turn 18.30 Also, higher education
spending per student increased in real terms while 16-19 funding per student fell.
Funding trends by region
This section looks at funding streams by areas of the country. We are only able to include
programme and disadvantage funding, given that there is no information on the regional allocation of other funding streams for some of the years.
26
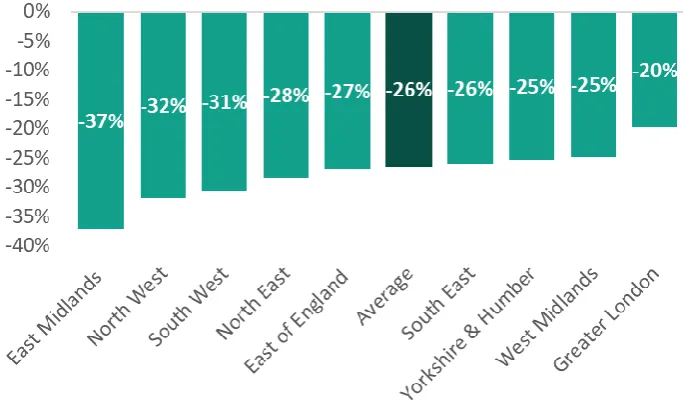
Figure 2.9 Change in total 16-19 funding allocations, excluding student support and apprenticeships, by region, real terms, 2010/11 to 2018/19
However, these decreases partly reflect demographic changes. When student numbers are considered we observe that the South East, which experienced a smaller than average funding decrease, saw the largest funding decrease; 17 per cent. Yorkshire and the Humber has seen the smallest change, of 11 per cent.
Figure 2.10 Change in 16-19 funding allocations per student, excluding student support and apprenticeships, by region, real terms, 2010/11 to 2018/19
As previously discussed, we have divided 16-19 allocations to providers into two main categories - that is programme funding, and disadvantage and high needs. The former accounts for the cost of delivery, while the latter considers disadvantage, be that individual or area-based. Figure 2.11 seeks to understand whether changes in funding across regions can be explained by trends in these two categories.
[image:26.595.79.426.432.636.2]27
the government’s explicit objective to divert money to areas and providers with more challenging intakes. However, there is no one single case where the increase in disadvantage and high needs funding has compensated for the decrease in programme funding.
Figure 2.11 Change in 16-19 funding allocations per student by stream, excluding student support and apprenticeships, by region, real terms, 2010/11 to 2018/19 (£)
Funding and levels of disadvantage
As discussed earlier in this report, successive reforms from 2010 have attempted to protect institutions with more challenging intakes from severe falls in funding.
28
Figure 2.12 Proportion of students in secondary schools eligible for and claiming Free School Meals, and increase in disadvantage and high needs funding per student in real terms between 2010/11 and 2018/19, by region
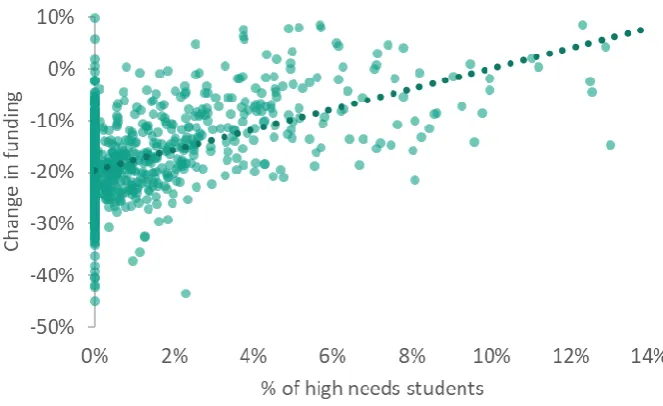
If we look at individual schools instead, we also see that there is a positive correlation between funding trends and the proportion of students who qualify for 16-19 high needs funding. Figure 2.13 shows that, the association between funding changes and the level of disadvantaged students in a given institution is positive. However, the high levels of variations also suggest that not all
institutions with high levels of disadvantage have been equally protected, which might be partly explained by the type of programmes they are offering.
Figure 2.13 Changes in funding per student in real terms v proportion of 16-19 students who are high needs, 2011/12-2017/18
Summary of funding trends
29
The overall 16-19 spending on programme delivery and student support decreased by 27 per cent in real terms, from £7.8bn in 2010/11 to £5.7bn in 2018/19.
By funding stream, student support fell by 71 per cent in real terms, 16-19 programme funding (excluding disadvantage and high needs) decreased by 30 per cent, and 16-18 apprenticeship funding fell by 11 per cent.
The Coalition government pledged to protect institutions with challenging intakes from large decreases in funding, and increased disadvantage and high needs funding by almost 70 per cent in real terms. This, however, did not compensate for falls in other funding streams.
Excluding apprenticeships, 16-19 funding per student decreased by over £900 or 16 per cent in real terms (over £600 or 11.5 per cent if student support is excluded). Funding per student in 2018/19 was £4,960, down from £5,900 in 2010/11.
Funding per 16-19 full-time equivalent student in the further education sector has fallen from £6,250 per full-time student in 2010/11 to £5,150 in 2018/19, or by 18 per cent in real terms. The funding fall has been smaller than in school sixth forms, where funding fell by 26 per cent from £6,280 to £4,680 over the same period. Within the further education sector, further education colleges have experienced smaller falls than sixth form colleges. Between 2012/13 and 2018/19, for which data exist to consider these institution types separately, funding per full-time student in sixth form colleges fell by 15 per cent, from £5,180 to £4,430 per student. Funding per student in further education colleges fell by 9 per cent from £5,870 to £5,320.
The South East experienced the largest falls in programme funding per capita (-17 per cent in real terms), including disadvantage funding. This compares to a fall of 11 per cent in
Yorkshire & Humber.
There is a positive correlation between the proportion of disadvantaged students and increases (or smaller decreases) in funding, which reflects that the government has, at least in part, succeeded in protecting institutions with challenging intakes from the largest funding reductions. This suggests that the 16-19 funding system has become more progressive. However, there is substantial variation between providers, suggesting that not all
30
Chapter 3. Changes in the financial health of providers
The analysis in the previous chapter considered absolute and per student falls in 16-19 funding. The following sections of this report will investigate the impact of this reduction in funding, starting with an analysis of the effects on the financial sustainability of providers.
This chapter explores whether the financial health of different types of institutions has been compromised by changes in funding. We use different data sources for each group of institutions:
Local authority maintained schools with sixth forms. We look at in-year deficits and surpluses of schools with sixth forms that are maintained by their local authority. We use Consistent Financial Reporting data from the Department for Education.
Academies with sixth form provision. We look at in-year deficits and surpluses of single academy trusts (SATs) or individual academies that are members of a multi academy trust (MAT), and that have sixth form provision. We use the Academies Account Returns data from the Department for Education.
Further education colleges and sixth form colleges. We consider in-year adjusted
operational deficits and surpluses of further education colleges and sixth form colleges. The Education and Skills Funding Agency (ESFA), and other institutions such as the National Audit Office, use this as a more accurate measure to judge colleges’ financial sustainability than raw deficit figures. This excludes non-cash local government pension tractions, other ESFA financial support, and taxation. We use ESFA’s College Accounts data. This means that in-year deficits of further education providers are not comparable with schools and academies. The diversity of data sources used in this section means that figures for different types of institutions are not directly comparable. For example, although for both local authority maintained schools and academies we provide raw in-year deficits and surpluses, academies receive funding for the
additional responsibilities they need to undertake for being outside of local authority control, and data for academies include some capital funding that is excluded for local authority maintained schools.31 In addition, schools with sixth forms can cross-subsidise 16-19 provision with 11-16
funding, putting them at an advantage compared to sixth form institutions. Colleges are less likely to do so given the low funding rates of adult learning.
However, trends for different groups of institutions will be provided, and changes in their financial health will be compared to trends in 16-19 funding. It is important to keep in mind that balances reflect the overall state of the institution, and that 16-19 funding represents, in many cases, a fraction of their total income.
Trends by institution type
31
of secondary schools are now academies, and that most academies had converted from local authority maintained schools.32 It should also be noted that these trends will also be influenced by
funding changes in the 11-16 provision for these schools. 33
Figure 3.1 Proportion of local authority maintained schools with sixth form provision with in-year deficits, 2010/11-2017/18
Although data for academies is more limited, we can see a similar trend for the years available. Figure 3.2 shows that more than half (51 per cent) of academies with sixth form provision had in-year deficits in 2016/17. The number of academies spending more than their income peaked in 2014/15, when 58 per cent did so. Many new academies have opened in recent years, so some of the variation might also be explained by the new providers joining the system.
Figure 3.2 Proportion of academies with sixth form provision with in-year deficits, 2012/13-2016/17
in-32
year deficits in 2016/17, down from 45 per cent in 2013/14 (figure 3.4). It should also be noted that trends in further education colleges will also be influenced by funding changes in 19+ provision. Figure 3.3 Proportion of sixth form colleges with adjusted operational in-year deficits, 2010/11-2016/17
Figure 3.4 Proportion of further education colleges with adjusted operational in-year deficits, 2010/11-2016/17
Trends in accumulated deficits
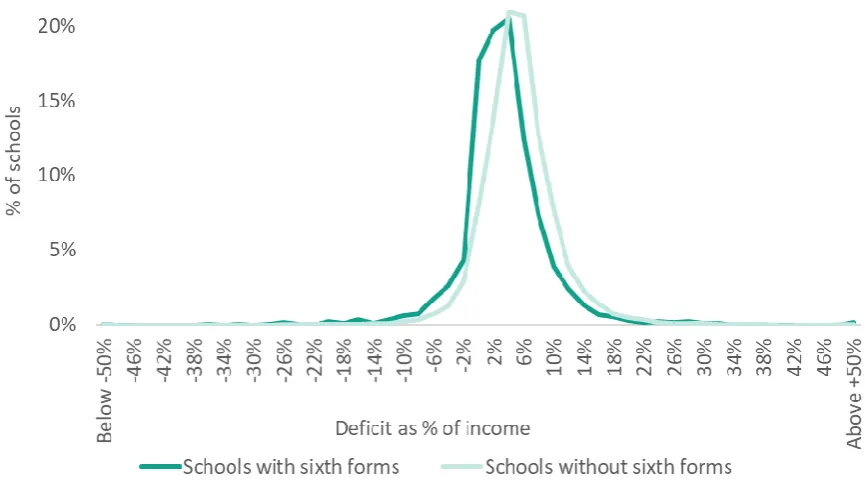
In-year deficits do not tell the whole story, as small deficits can be manageable, and they do not need to compromise the financial health of institutions. Figures 3.5 and 3.6 look at accumulated deficits instead, and show the size of deficits of local authority maintained schools, and how trends for schools with and without 16-19 provision differ.
33
more has gone up from two to seven per cent, while only two per cent of schools without a sixth form have accumulated deficits worth more than 10 per cent of their income.
This suggests that schools providing 16-19 education, which have suffered the impact of lower funding rates, have experienced faster increases in their accumulated deficits. This is very unlikely to be sustainable over time, and makes 16-19 providers more vulnerable to funding shocks that may compromise their provision.
[image:33.595.82.515.208.451.2]Figure 3.5 Accumulated deficit in local authority maintained schools with and without sixth forms, 2010/11
34
Impact of funding on the financial health of institutions
Establishing a link between institutions’ balances and levels of 16-19 funding is not straightforward, given that for most providers funding for their 16-19 provision only represents a fraction of the total. All-through schools will receive funding for primary, secondary, and sixth form education so changes in 16-19 funding will have a more limited, yet not negligible, effects on their total level of income, and therefore, balances. The same is true for colleges, many of which have 16-19 provision but also offer training for older learners, meaning that their budgets and balances will also depend on the funding rates of adult training.
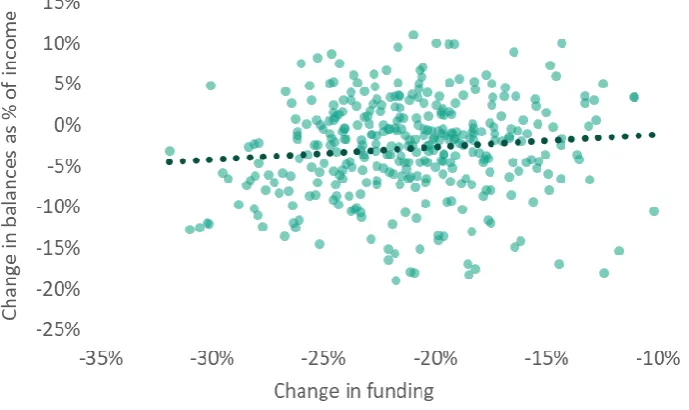
[image:34.595.83.428.324.529.2]The relationship between changes in 16-19 funding and balances in schools with sixth form provision is very weak. However, if we exclude providers that also offer primary education, then the picture changes slightly. As figure 3.7 shows, there is a positive, yet weak, correlation between changes in 16-19 funding and changes in providers’ balances.
Figure 3.7 Change in balances as proportion of income v changes in funding per student in real terms, state-funded schools with sixth forms and no primary provision, 2011/12-2017/18
35
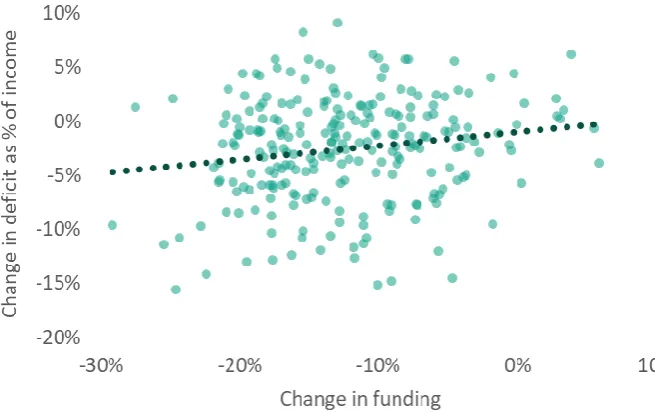
Figure 3.8 Change in deficit as proportion of income v change in funding per student in real terms, further education and sixth form colleges, 2011/12-2017/18
Summary of findings and trends
This section has explored whether the financial sustainability of schools and colleges with sixth form provision has worsened or improved since 2010, and if so, whether changes in deficit figures can be explained by changes in the level of 16-19 funding.
Our analysis suggests the following:
Financial sustainability has worsened across all institution types offering 16-19 education.
In 2010/11, 37 per cent of local authority maintained schools with 16-19 provision had in-year deficits, while by 2017/18 54 per cent did so. That in-year, 51 per cent of academies with sixth form provision had in-year deficits, up from 39 per cent in 2012/13 (compared to 43 per cent of local authority maintained schools).
Schools with sixth forms have seen their financial health worsen faster than schools without sixth forms. In 2017/18, 22 per cent of schools with sixth forms had accumulated deficits, up from 12 per cent in 2010/11. Only 6 per cent of schools without sixth form provision had accumulated deficits in 2010/11, and 9 per cent of them did so in 2017/18. Schools with sixth forms also have larger accumulated deficits than those without a sixth form, suggesting that their financial health has worsened more than in other schools, a trend that could compromise provision in these institutions.
The financial health of further education institutions has deteriorated too. The number of sixth form colleges with in-year deficits increased from 7 per cent in 2010/11 to 36 per cent in 2016/17. This means that now a similar percentage of sixth form colleges and further education colleges have in-year deficits (40 per cent of colleges did so in 2016/17), despite further education colleges starting from a higher baseline; 20 per cent had in-year deficits in 2010/11.
36
37
Chapter 4. Changes in qualification take-up
This chapter aims to understand whether the amount and type of qualifications taken by 16-19 year olds have changed over time, and whether this may have been driven by changes in funding. We address this by analysing Key Stage 5 data in the National Pupil Database and the Individual Learner Record, looking at trends over time. To identify whether qualifications on offer match skills needs, we analyse the latest Working Futures data and compare it against trends in qualification take-up. Working Futures data provided ten-year labour market projections until the UK Commission for Employment and Skills ceased to operate.
Numbers for 2010/11 and 2011/12 are not provided due to data limitations.
The focus of this section is not just on the number of qualifications taken, but also the size of those qualifications. That is, the sum of the hours spent being taught or supervised. This is because size varies hugely across qualifications. Counting only the number of qualifications could be a misleading measure of the amount of learning taking place if, for example, government policy or other changes were pushing providers towards fewer, but more substantial qualifications (as has happened with the decoupling of AS levels), or the other way round.
This section will therefore analyse trends in the guided learning hours received by students aged 16, 17, and 18 at the beginning of each academic year. We calculate the learning hours per student of qualifications by multiplying the number of minimum guided learning hours associated with qualifications achieved in any given year by the number of students taking those qualifications, and dividing the product by the total number of students (not only those taking that qualification). This gives a measure of the average number of hours spent on that qualification across all 16-19 year olds. It should be noted though that we only use hours from those qualifications that young people have completed, so these trends are susceptible to changes in drop-out rates over time.
To illustrate our methodology with an example, if there are 1,000 students in a given year, and 100 of them take a qualification Z with 120 minimum guided learning hours, the hours per student of this qualification will be:
Hours per student of qualification Z =100 students x 120 hours
1000 students(total) =
12,000
1,000 = 12
38
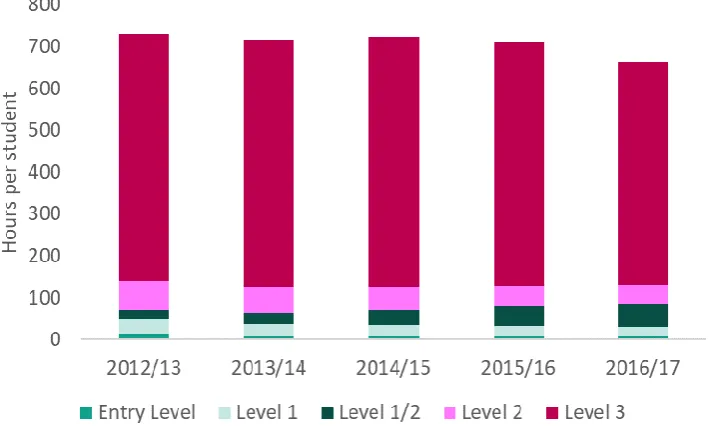
Figure 4.1 Average learning hours per student (entire cohort), 2012/13-2016/17
Guided learning hours per student are down across all qualifications, with the exception of level 1/2 qualifications, mainly GCSEs. This is largely a consequence of providers being required to ensure that students without at least a grade 4 in GCSE English and maths (previously A*-C) retake these
qualifications, in order to obtain funding. As a result, level 1/2 qualifications went up from 20 guided learning hours per student in 2012/13 to 53 in 2016/17.
Figure 4.2 Learning hours per student by qualification level (entire cohort), 2012/13-2016/17
At least in part because of their size, level 3 qualifications still account for the majority of learning hours, accounting for 532 learning hours per student in 2016/17 out of 665 (80 per cent). Level 2 qualifications decreased from 70 hours per student in 2012/13 to 47 in 2016/17; level 1
[image:38.595.87.447.415.631.2]39
[image:39.595.80.475.164.402.2]As figure 4.3 shows, the balance between academic and vocational level 3 qualifications has shifted. In 2012/13, vocational qualifications represented 29 per cent of the overall guided learning hours of level 3 qualifications (170 hours per student). In 2016/17, they represented 38 per cent of the total (201 hours, 18 per cent more).
Figure 4.3 Learning hours per student of level 3 academic and vocational qualifications (entire cohort), 2012/13-2016/17
Figure 4.4 shows that the fall in learning hours in level 3 academic qualifications is largely the result of a significant decline in AS levels, in which learning hours fell from 192 learning hours per student at the beginning of the period to 97 in 2016/17, a 49 per cent decline. There has been a small increase in A levels alongside a sharp decrease in AS levels, following the decoupling of both qualifications from September 2015.35 However, it is unclear whether decoupling can entirely
40
Figure 4.4 Academic level 3 learning hours per student (entire cohort), by qualification type, 2012/13-2016/17
Trends differ by subject. Except for two subject groups (retail and construction), the learning hours of vocational qualifications in all subject groups increased. Learning hours per student in subjects in the science and maths group soared by 89 per cent over the period of study, while business,
41
Figure 4.5 Learning hours per student (entire cohort), vocational level 3 qualifications by subject group, 2012/13 and 2016/17
Academic level 3 qualifications present a very different pattern. They shrank by 21 per cent over the period, from 418 to 331 hours per student, but this varies across subjects. Social science subjects decreased by only seven per cent (a third of the overall decrease), and science and maths by 14 per cent. Preparation for life and work (-79 per cent), leisure, travel, and tourism (-38 per cent), and retail (-37 per cent) experienced the sharpest falls.
42
Figure 4.6 Learning hours per student (entire cohort), academic level 3 qualifications, by subject group, 2012/13 and 2016/17
43
Figure 4.7 Change in learning hours per student (entire cohort) by subject, level 3 academic and vocational qualifications, 2012/13-2016/17
When academic and vocational level 3 qualifications are combined, we see that for most subjects there is a net decrease in the number of learning hours received by students. In 2016/17, students obtained 16.2 hours of guided learning in science and maths less than in 2012/13. Other subjects with sharp falls were language and literature (-14 hours), preparation for life and work (-13.3 hours), arts, media and publishing (-5.2 hours), and social science (-3.2 hours). Increases in other subjects did not compensate these falls: in 2016/17, students received 2.3 more hours of business,
administration and law than in 2012/13, and increases also occurred in engineering and
44
Figure 4.8 Change in learning hours per student (entire cohort) by subject, level 3 qualifications, 2012/13-2016/17
Despite the drop in the learning hours of all level 3 academic qualifications, full A levels learning hours increased by three per cent between 2012/13 and 2016/17, from 225 to 233 hours per student. Figure 4.8 shows that this growth has been exceeded in all but one of the subjects that are included in the Russell Group’s list of “facilitating subjects”, that is, subject choices that facilitate access to high-tariff universities. Their 2018 Informed Choices report includes maths and further maths, English literature, physics, biology, chemistry, geography, history, and languages (classical and modern).36 Most noticeable is the 28 per cent increase in geography provision, followed by the
15 per cent increase in maths and statistics provision.37 This highlights that factors other than
45
Figure 4.9 Average change in learning hours per student (entire cohort), A levels in facilitating subjects, 2012/13-2016/17
We have explored potential drivers of falls in learning hours by looking at whether providers with higher proportions of disadvantaged students or those suffering more acute funding falls have experienced sharper decreases in the learning hours received by students.
Figure 4.10 below shows the relationship between the proportion of high needs students in a provider and changes in the learning hours of qualifications. The correlation is very weak, as the trendline indicates, but if anything, the relationship between level of high needs students and changes in qualification sizes seems to be positive. This (weakly) positive relationship is likely to be due the fact that disadvantage funding has increased as a proportion of total funding.