1
Master’s Loan
Evaluation
Research report
May 2019
Lorna Adams, Jessica Huntley Hewitt,
Sam Morris, Sam Whittaker and Kyle
Robertson
2
Acknowledgements
We are very grateful for the support of Jane Carr and her colleagues at the Department for Education for her guidance throughout the conduct of this evaluation.
3
Contents
Acknowledgements 2
Glossary 11
1 Executive Summary 12
Change in volume, profile and quality of Master’s students 12
Change in timing of Master’s students 13
Sources of finance 14
Changes in types of postgraduate study 15
Changes in provision 16
Experiences of using the Master’s Loan 16
Reasons why take-up of the Master’s Loan is not higher 17
Return on investment of Master’s study 18
Conclusions 18
2 Background and Methodology 20
Report conventions 24
3 Change in volumes of Master’s’ students 25
Overall change in volumes of students 25
Change in student volumes by region 26
HEI views on changes in student volumes 30
Evidence from student survey on changes in student volumes 33
4 Change in profile of Master’s students 35
Age and gender profile 35
Ethnicity profile 36
Indicators of disadvantage 36
Prior attainment profile 37
Motivations for study 38
5 Change in timing of Master’s’ students 42
4
Amount of time spent considering Master’s study before starting 46 Importance of cost as a factor in not being able to start the Master’s course sooner 47
Studying full-time rather than part-time 48
Evidence of deferral in order to benefit from Master’s Loan 51
6 Change in sources of finance 52
Take-up of the Master’s Loan 52
Funding sources for tuition fees 53
Funding sources for living expenses 61
Working while studying 64
Whether would have found alternative funding without Loan 68
Changes in financial support reported by HEIs 72
7 Changes in types of post-graduate study 74
Impact of the Loan on course choices 74
8 Changes in provision 76
Changes to eligible provision 76
Changes to course fees 78
Future revenue predictions 80
9 Experiences of using the Master’s Loan 81
Amount of loan taken out 81
Use of the Master’s loan for tuition fees or living expenses 83 Whether the amount of the Master’s Loan covered the full cost of tuition 84 Student views on the value of the Master’s Loan, including use of the loan and
managing finances 86
Views on the application process 88
Student views on the Master’s Loan application process 89 Student views on the repayment terms of the Master’s Loan 90 Using the Master’s Loan on courses lasting more than one year 93 10 Reasons why take-up of Master’s Loans is not higher 96
5
Reasons for not taking up the Master’s Loan 97
11 Return on investment of Master’s study 100
Student views on impact of study on future earning potential 100 Students’ current or intended destinations on completion of study 102 How the Master’s loan has helped to achieve intended outcomes 106 Whether without the Master’s Loan students would have changed career plans 107
12 Conclusions 109
Quantitative Student Survey 114
6
Table of Figures
Figure 2.1 The logic model that informed the Evaluation of the Master’s Degree Loan Scheme ... 21 Figure 3.1 Number of students enrolling in each academic year – change over time ... 25 Figure 3.2 Number of loan-eligible students enrolling in each academic year – change over time ... 26 Figure 3.3 Change in enrolments (loan eligible and overall), 2015/16 to 2016/17, by region ... 27 Figure 3.4 Change in enrolments (loan eligible and overall), 2015/16 to 2016/17, by tariff ... 28 Figure 3.5 Change in enrolments (loan eligible and overall), 2015/16 to 2016/17, by subject area ... 30 Figure 3.6 HEI perceptions of change in loan eligible enrolments, 2016/17 student numbers relative to 2015/16, and 2017/18 take-up relative to 2016/17 ... 31 Figure 3.7 HEP perceptions of courses in which loan eligible enrolments increased, 2016/17 ... 32 Figure 3.8 Student agreement with the statement that without the availability of the loan they never would have even thought about studying a Master’s; overall and by gender ... 33 Figure 4.1 Age profile of loan-eligible England-domiciled Master’s students – change over time ... 35 Figure 4.2 Ethnicity profile of loan-eligible England-domiciled Master’s students –
7
Figure 5.2 The gap between finishing undergraduate study and beginning postgraduate
study ... 44
Figure 5.3 Agreement with statement ‘Your Postgraduate Loan made it possible to start studying or training sooner than would otherwise have been possible’ ... 45
Figure 5.4 Length of time spent considering doing a Master’s degree ... 47
Figure 5.5 Importance of cost in not being able to start course sooner ... 48
Figure 5.6 Agreement with statement: ‘Your Postgraduate Loan made it possible to start a course or learning on a full-time basis rather than a part-time basis’ ... 49
Figure 5.7 Split between full-time and part-time study – change over time ... 50
Figure 6.1 Proportion of 2016/17 starts taking up the Master’s Loan ... 53
Figure 6.2 Sources of funding used for tuition fees ... 54
Figure 6.3Sources of funding used for tuition fees, full-time and part-time students ... 56
Figure 6.4 Sources of funding for tuition fees 2016/17, loan vs. non-loan ... 58
Figure 6.5 Main sources of funding for tuition fees ... 59
Figure 6.6 Main source of funding for tuition fees, loan / non-loan and full-time / part-time ... 60
Figure 6.7 Sources of funding used for living expenses ... 62
Figure 6.8 Main source of funding for living expenses ... 64
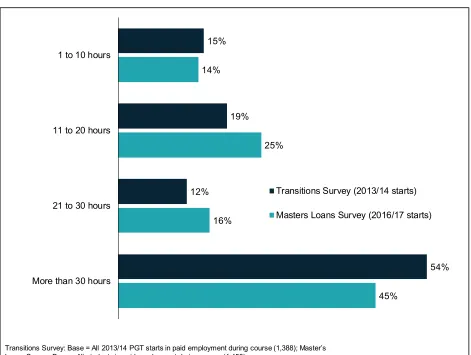
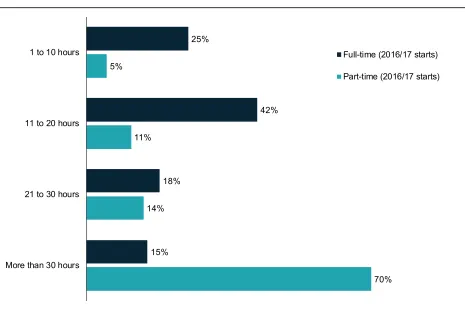
Figure 6.9 Working hours of students in paid employment during their Master’s course, 2013/14 vs 2016/17 ... 65
Figure 6.10 Working hours of students in paid employment during their Master’s course in 2016/17, full-time vs part-time ... 66
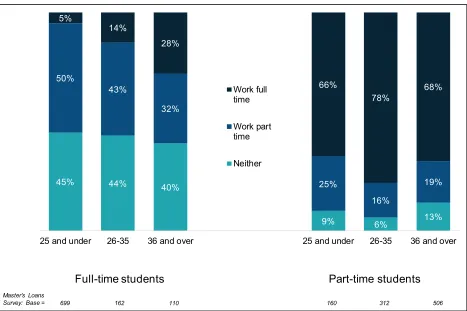
Figure 6.11 Working status during Master’s course – by age within mode of study ... 67
Figure 6.12 How tuition fees and living expenses would have been funded if had not taken out Master’s Loan ... 69
8
Figure 6.14 Agreement that it would have been possible to find an alternative source of
funding had Master’s Loan not been available ... 71
Figure 6.15 Financial support offered by HEIs ... 72
Figure 7.1 Changes students would have made to course / institution without the Master's Loan ... 74
Figure 8.1 Changes made by HEIs to eligible provision as a result of the introduction of the Master’s Loan ... 76
Figure 8.2 Changes made to integrated Master’s or undergraduate provision ... 77
Figure 8.3 Changes to course fees since the introduction of the Master’s Loan ... 78
Figure 8.4 Reasons for increases in fees for courses eligible for Master’s Loan ... 79
Figure 8.5 Reasons for decreases in fees or no change to fees for courses eligible for Master’s Loan ... 80
Figure 9.1 Amount of loan taken out by students ... 82
Figure 9.2 Amount of loan taken out by students, broken down by mode of study ... 83
Figure 9.3 Student confidence in repaying the Master’s Loan and worry about the risk associated with taking on debt ... 90
Figure 9.4 Amount of loan paid out in first year of courses lasting more than one year 93 Figure 9.5 Extent of agreement that it was a good idea for the Master’s Loan payment to be split into two payments and the extent of ease or difficulty of managing finances between years ... 95
Figure 10.1 Student awareness of the Master’s Loan when starting their Master’s course by age ... 97
Figure 10.2 Reasons students did not apply for a Master’s Loan ... 98
Figure 11.1 Student agreement with whether they had a clear idea about the financial impact of the course on you future earning potential ... 100
9
10
Table of Tables
Table 4.1 Main reason for studying Master’s course by mode of study and age ... 40
Table 9.1 Whether total value of loan was / would have been enough to cover the full tuition fees for the Master's course split by subject of study ... 85
Table 12.1 Participating HEPs split by volume and tariff ... 115
Table 12.2 Mode of study and course status sample breakdown ... 115
Table 12.3 Student quantitative survey sample profile ... 117
Table 12.4 Achieved sample and target sample based upon 2,002 interviews ... 118
Table 12.5 Weighting used in the quantitative student survey ... 118
Table 12.6 Student qualitative interview responses ... 120
11
Glossary
Term Definition
BAME Black Asian and Minority Ethnicity
HEI HEIs (Higher Education Institutions) are publicly-funded providers that award degrees at undergraduate and postgraduate level
HESA HESA (Higher Education Statistics Agency) is collection, analysis and dissemination of quantitative information about the official agency for the higher education in the United Kingdom.
UCAS Tariff
‘High tariff institutions’ are defined as those with the highest (top third) average UCAS tariff entry requirement, ‘medium tariff institutions’ are those in the middle third, and ‘low tariff institutions are defined as those in the bottom third. In this report they apply only to HEIs.
12
1 Executive Summary
The Master’s Degree Loan Scheme was launched by the Government in June 2016, and marks the first time that Government has provided student loan finance to
contribute to costs for postgraduate master’s study. The loan aims to:
• Stimulate increased domestic take-up of postgraduate master’s degree study
by providing access to finance;
• Enable those who could not otherwise afford (or would have to delay) study at
postgraduate master’s level to progress to study at this level;
• In turn, improve the supply of highly skilled individuals to the UK economy. This report presents the findings of a quantitative survey of 2,002 Master’s students who started their course in 2016/17, the first cohort eligible to take out the Master’s loan, and a qualitative follow-up study with 50 of these students; a survey of 79 HEIs delivering Master’s courses eligible for Master’s Loan funding; and analysis of HESA data
spanning 5 years from 20f12/13 to 2016/17. Comparisons are also made with Master’s students starting in 2013/14 from the Understanding Mature Transitions to Postgraduate Study1 dataset.
The research aims to evaluate how the Master’s Degree Loan scheme performed against its objectives in the first year of it being offered, including whether there were changes in the volume, profile and quality of Master’s students; any changes to the timing of undertaking Master’s-level study; the availability and use of funding sources; choices in subject and mode of study; changes in provision and fees at HEIs; and also the overall experience of using the Master’s Loan.
Change in volume, profile and quality of Master’s students
Data from the HESA Student Record shows that there was a substantial increase in the overall number of Master’s students enrolling at English HEIs between the academic years 2015/16 and 2016/17 (the year in which the Master’s Loan was introduced). This growth was driven by a 36% increase in enrolments from England-domiciledloan-eligible students, while enrolments from other students remained static. This increase is
1
13
against a backdrop of relatively static figures for the years immediately prior to the loan. For middle tariff institutions the change in loan-eligible student enrolments was much more substantial (57%) than for low tariff (34%) and high tariff institutions (27%), suggesting the impact of the loan has been greater in medium tariff institutions in particular.
Most HEIs interviewed (75%) said the number of enrolments from students onto courses eligible for postgraduate loans increased in 2016/17. Among those which reported an increase in numbers, the majority (84%) attributed this at least in part to the introduction of the Master’s Loan.
Students themselves confirmed the importance of the Loan in enabling them to study. Nearly three-quarters (72%) of students starting their course in 2016/17 felt that they would have been unable to undertake their specific Master’s course without the
Master’s Loan, while around a third (36%) agreed that they would “never even thought about studying a Master’s” if the Master’s loan had not been available.
While there were no substantial changes to the age or gender profile of students, the proportion of Black students increased substantially between 2015/16 and 2016/17. . One possible indicator of the quality of Master’s students is the grade obtained in their undergraduate degree. However, the survey found no change in this regard between the 2013/14 cohort (before the introduction of the Loan) and the 2016/17 cohort. There is evidence of a slight shift in the main motivations for Master’s level study between the 2013/14 and 2016/17 cohorts with the 2016/17 cohort more likely to state that their main motivation was interest in the subject and less likely to state more
career-focussed motivations. However, students in receipt of the Loan were more likely to say that their main reason for studying was to improve their employment prospects (20% compared with 12% of those not in receipt of the Loan).
Change in timing of Master’s students
One of the intentions of the Master’s Loan was to enable individuals and the state to benefit from the return on investment in Master’s level education earlier.
Comparing the survey cohorts starting their Master’s courses in 2013/14 and in
14
them to begin postgraduate study sooner,” a finding mirrored by the fact that, despite the lack of change in interval at an overall level, students in receipt of the Loan were more likely to have progressed from undergraduate to postgraduate study within a year (48%) than those not in receipt of the Loan (23%). The main reason for this given by students in the qualitative interviews was that without the Master’s Loan, they would have had to spend several years building their savings in order to afford it.
Evidence is stronger in terms of the Master’s Loan enabling students to complete more quickly. Analysis of the HESA student record indicates a trend towards a greater
proportion of full-time study. While the proportion of loan-eligible England-domiciled students studying full-time remained relatively constant in the period prior to the introduction of the loan (at 54-56%), this proportion increased to 62% in 2016/17. In the survey, the majority (89%) of full-time students in receipt of the Master’s Loan agreed that the Loan had enabled them to study full-time rather than part-time. There is some evidence to suggest that the increase in Master’s students in 2016/17 might have been inflated by students deferring their study specifically to benefit from the introduction of the Loan. Half (50%) of those who received a Master’s Loan in 2016/17 and who started their course more than one year after the end of their undergraduate study said that they had deferred starting their Master’s course until the loan became available. This was particularly likely among students from a BAME background (61%).
Sources of finance
Estimates from the survey indicate that over half (56%) of students starting an eligible Master’s course in 2016/17 took out the Master’s Loan. Those studying full-time were more likely to have used the Master’s Loan (67%) compared with part-time students (41%). Use of the Loan was also more common among students aged 25 and under, 73% of whom took out a loan, BAME students (66% of whom took out a loan), and those whose parents had not studied at university (60%).
The biggest change in funding sources for tuition fees between 2013/14 and 2016/17, alongside the introduction of the Master’s Loan, was a drop in the proportion using self-funding to cover all or part of their tuition fees, from 77% of starts in 2013/14 to 57% in 2016/17.
However there was no change in the proportion receiving either funding from their HEI or funding from their employer to pay for tuition fees. Hence, so far, there is no
15
This is reinforced by evidence from the HEI survey. In the majority of cases, HEIs stated that had not made any changes to the funding that they offer Master’s students since the introduction of the Master’s Loan, and no HEIs said they expected to decrease funding in any of their support streams in future, although there were high levels of uncertainty, with between 16% and 21% saying they did not know if there would be any change to each type of funding.
A higher proportion of students starting a Master’s course in 2016/17 either wholly or partially funded their tuition fees using wages from employment (31%) compared with those starting in 2013/14 (20%). Overall 70% of students starting in 2016/17 were in paid employment during their Master’s course, split evenly between full-time and part-time work (each 35%). This compares to 58% of students starting in 2013/14 who were in paid employment during their course.
A quarter (25%) of students in receipt of the Master’s Loan said they did not know how they would have funded their fees and living expenses without the Loan, while a further quarter (26%) said they would not have done the course had the Master’s Loan not been available. In total, 52% of all students in receipt of the Loan gave one of these two responses, suggesting that half of all recipients felt they may not have been able to do their course had the Loan not been available.
Just under half (46%) said they would have used self-funding2 to pay for their fees and
living costs had the Loan not been available. This provides some evidence of the Loan providing funding for those who might otherwise have been able to afford the course on their own.
Changes in types of postgraduate study
Had the Master’s Loan not been available, 41% of students who had taken out the Loan said they would have altered their study in some way. A quarter (25%) would have chosen a cheaper course, while conversely one in twenty (6%) would have chosen a more expensive course. Just under a fifth (19%) would have chosen a different course, and a slightly larger proportion (22%) would have chosen the same course at a different institution; this was particularly likely among BAME students (33%).
2 Self-funding includes wages from employment, own savings, family contributions, and other sources of
16
Changes in provision
63% of HEIs had made no changes to their learning provision as a result of the introduction of the Master’s Loan at the time of interviewing in early 2018. Where changes had been made, the most common were the introduction of new Master’s courses or provision (13%), restructuring of Master’s courses to be 2 years long (11%) and increasing the number of places of existing Master’s courses (11%). Only a very small proportion (1%) said they had stopped completely or withdrawn Master’s courses or provision.
30% of HEIs anticipated some change to their future Master’s provision as a result of the loan. A number of HEIs anticipated further expansion of their Master’s offer: a quarter (25%) expected to introduce new Master’s courses or provision, while 16% expected to increase the number of places on existing Master’s courses.
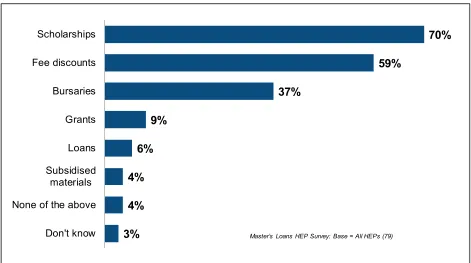
More than half (57%) of HEIs reported that they had increased fees for at least some of their Loan-eligible courses, while only 41% had increased fees for non-eligible courses. Three-quarters (73%) of HEIs that had increased fees for loan-eligible courses said this was to align the fees more closely with their competitors, and 40% said they felt the market could stand it. Relatively few (7%) explicitly stated that the increase was to align with the maximum Postgraduate Loan amount. Other reasons given were often related to costs, with 11% of HEIs increasing fees to cover increasing costs, 9% to align with inflation, and 2% to pay for additional staff. A small proportion (4%) said they wanted to set their fees higher than their competitors.
Just under half (48%) of HEIs believed that over the longer term the introduction of the Master’s Loan would lead to increased revenue for the institution. Of the remainder, the majority were undecided, with 37% saying they did not know if revenues would
increase, while 15% said they did not think that revenues would increase.
Experiences of using the Master’s Loan
Under the Master’s Loan Scheme, students who started their course in 2016/17 could borrow up to £10,0003. The vast majority of students who received a Master’s Loan took
out £9,000 or more of the Master’s loan (80%), with just 5% of students taking out under
3 this increased to £10,280 for courses starting in 2017/18, and to £10,609 for courses starting on or after
17
£5,000. Among all students who took out a Master’s Loan, the mean value borrowed was £9,340.
The Master’s Loan was used to cover tuition fees by almost all recipients (96%), with half (50%) using it for both tuition fees and living expenses, less than half (45%) using it only for tuition fees, and just 4% using it only for living expenses.
Over three-quarters (77%) of students in receipt of the Loan said that the amount of the Loan was enough to cover the full cost of tuition. However amongst loan recipients, those studying courses classified as business and law (69%) and medical and health sciences (68%) were less likely to agree that the value of the Master’s Loan covered the cost of tuition, as were students living in London (57%).
In the qualitative interviews, most students suggested that £10,000 was not enough to adequately cover the cost of postgraduate study. Some full-time students expressed that they needed more money to cover both tuition fees and living expenses, yet the time demands of their course made working alongside their study difficult. A few students mentioned that they felt that the Master’s Loan was sufficient only because their parents were able to financially support their study.
Almost all Loan applicants in the qualitative interviews stated that the application process for the Master’s Loan was easy, well-explained and well-timed; a few commented that it was considerably easier than applying for undergraduate student finance.
Nearly two thirds of students who took out a loan were confident in their ability to repay the Master’s Loan (63%). The qualitative interviews showed that students were
generally aware of when they would begin to make repayments, and the threshold of income that triggers repayment, and less aware of the interest rates associated with the Master’s Loan.
18
Among students who did not apply for the Master’s Loan (who made up 41% of all students), the most common reason was being able to pay for the course without taking a loan (71%), with other factors being a lack of awareness of the loan (26%), and not wanting to take out another loan on top of the undergraduate loan (22%).
Return on investment of Master’s study
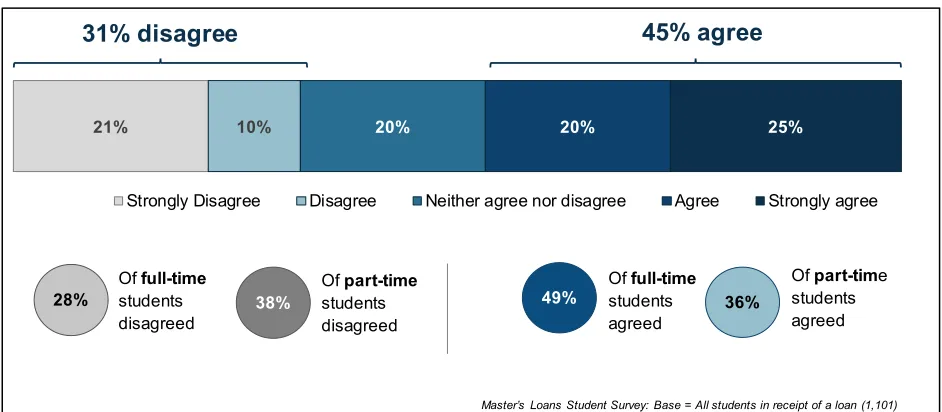
Seventy per cent of Loan recipients agreed that they had a clear idea about the financial impact of their study, with nearly half of all Loan takers strongly agreeing (45%). Eighty-one per cent of students felt that their earning potential would increase as a result of their Master’s course.
Loan-takers were more likely than non-loan takers to believe that their earning potential would increase (85% compared with 77% of non-Loan students), as were students studying full-time (86% compared with 75% of part-time students. Eighty-eight per cent of BAME students indicated that they felt their earnings would increase at least to some extent compared to 79% of white students.
Almost all students (94%) expected to receive at least one benefit five years after completing their study. Seventy-four per cent believed they would be earning more money, and a similar proportion (73%) expected to have more job choices. Being in a more senior role and being in a more specialist role were each mentioned by 70% of students, and 68% anticipated they would be in a higher pay band.
Conclusions
In relation to the key outcomes and impacts anticipated from the introduction of the Master’s Loan, the key conclusions that can be drawn from this research are that:
• The large increase in student volumes on loan-eligible courses indicates that the loan has been successful in leading to increased access to Master’s level education;
• Although there is no evidence of widening participation in terms of an increase in participation of students whose parents did not attend university, there is evidence that the loan has increased the proportion of students from a black minority ethnic background;
• There is evidence of the Loan leading to earlier access to the benefits accruing
19
There is not yet much evidence to suggest that it is leading to a reduced time gap between undergraduate and post-graduate study.
• There is evidence that the Loan will help the sustainability of the HE sector. Most HEIs benefited from increased student volumes in 2016/17 and half reported that they believe the Loan will lead to increased revenue for them. There is evidence to suggest that it has benefitted medium-tariff institutions in particular.
• There is no evidence to suggest that the Loan has ‘crowded out’ other sources of
funding. The proportions of students in receipt of employer and HEI funding for tuition fees and living expenses have remained broadly the same as in 2013/14.
• There is some evidence that the Loan has had an effect of increasing fees for Master’s courses (with HEIs more likely to report increases on these courses (57%) than on courses not eligible for fees (41%). This might warrant further investigation.
• There is evidence of displacement. Take-up of the Loan was high in 2016/17 and the proportion of students taking out a Loan far outweighs the overall increase in student numbers on loan-eligible courses. When asked directly, a third of students taking out a Loan stated that they could have found alternative sources of funding.
• The aspirations/intended destinations of students in the 2016/17 cohort are very
similar to those in the 2013/14 cohort which could lead to an increase in highly-skilled jobs and increased financial return to individuals as a result of the Loan (with similar outcomes achieved but for more students). It will be possible to collect stronger evidence for this over time.
20
2 Background and Methodology
Postgraduate education plays an important role in helping to maintain the UK’s position in the global marketplace. Maintaining investment in research and development has frequently been cited as key to ensuring competitive advantage. Taught postgraduate (PGT) courses such as Master’s degrees provide a basic training that can be used as a springboard into the kinds of postgraduate research careers that are essential for ensuring innovation and dynamism within the high growth sectors of the knowledge economy.
Taught postgraduate courses also offer benefits to the individual. It has been estimated that men and women who possess Master’s qualifications earn on average an extra £59,000 and £42,000 respectively over their lifetimes compared to their peers whose highest qualifications are undergraduate degrees4 Postgraduate study also plays a role
in facilitating social mobility, with students pursuing postgraduate study in order to secure progression to more senior roles, which can be undertaken later in life and/or studied part-time alongside working.
The number of postgraduate taught (PGT) students at UK universities rose strongly between 2007–08 and 2010–11, reaching a peak of 300,945 enrolments in the 2010-11 academic year. However, the population has declined since that point, reaching a low of 271,475 starts in 2012/13, which remained fairly stable through to the end of the
2015/16 academic year (282,090 starts)5.
It was within the context of these declines in the population of PGT students that commentators identified a lack of affordable funding options as a particular barrier to study at this level for some students6. Financial concerns were shown to be among the
most significant and commonly reported barriers to progression into postgraduate master’s study reported by students7 and a reason for postponing postgraduate study
until much later8.
To address this issue, the Government launched the Master’s Degree Loan Scheme in June 2016. The postgraduate master’s loan scheme is the first time that Government
4 London Economics (2011) BIS Research Paper No 45, The returns to higher education qualifications 5 HESA Student statistics – 2016/17 summary
6 Universities UK, Postgraduate Taught Education: The Funding Challenge, May 2014.
7 Department for Business, Innovation and Skills, Higher Education: Consultation on Support for
Postgraduate Study, March 2015, p10.
8 Institute for Employment Studies and NatCen Social Research (2016) ‘Understanding Mature Entrants’
transitions to postgraduate study’ BIS research paper:
21
has provided student loan finance to support students to progress on to postgraduate master’s study. The loan aimed to:
• Stimulate increased domestic take-up of postgraduate master’s degree study by providing access to finance;
• Enable those who could not otherwise afford (or would have to delay) study at postgraduate master’s level to progress to study at this level; and
• In turn, improve the supply of highly skilled individuals to the UK economy.
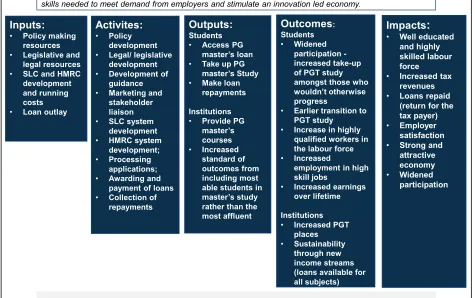
[image:21.612.72.547.297.595.2]The evaluation was informed by the logic model shown in Figure 2.1.
Figure 2.1 The logic model that informed the Evaluation of the Master’s Degree Loan Scheme
Inputs: • Policy making
resources
• Legislative and legal resources
• SLC and HMRC development and running costs
• Loan outlay
Activites: • Policy
development
• Legal/ legislative development
• Development of guidance
• Marketing and stakeholder liaison
• SLC system development
• HMRC system development;
• Processing applications;
• Awarding and payment of loans
• Collection of repayments
Outputs:
Students
• Access PG master’s loan
• Take up PG master’s Study
• Make loan repayments Institutions
• Provide PG master’s courses • Increased standard of outcomes from including most able students in master’s study rather than the most affluent Outcomes: Students • Widened participation -increased take-up of PGT study amongst those who wouldn’t otherwise progress
• Earlier transition to PGT study
• Increase in highly qualified workers in the labour force
• Increased
employment in high skill jobs
• Increased earnings over lifetime
Institutions
• Increased PGT places
• Sustainability through new income streams (loans available for all subjects)
Impacts: • Well educated
and highly skilled labour force
• Increased tax revenues
• Loans repaid (return for the tax payer)
• Employer satisfaction
• Strong and attractive economy
• Widened participation
Policy objective:To stimulate increased take-up in postgraduate study by providing access to finance where the evidence shows it is a barrier to progression. Increase the supply of workers with the high level skills needed to meet demand from employers and stimulate an innovation led economy.
22
The scheme enables eligible postgraduate master’s students to access a loan of up to £10,0009 as a contribution towards the cost of their studies. The loan is available to
full-time and part-full-time students, as well as those undertaking distance learning. As with the undergraduate loan system, repayment of the loan is income-contingent, and borrowers will only begin repaying when they are earning over £21,000 per year.
To be eligible for the Loan, individuals have to be:
• Studying a loan-eligible course (which means a standalone Master’s course worth 180 credits);
• Aged under 60;
• Studying for their first qualification at Master’s degree level (and not already have any higher-level qualifications);
• Have “settled” status or a recognised connection with the UK and a resident of the UK and Islands for three years prior to that date.
This research evaluated how the Master’s Degree Loan Scheme performed against its objectives in the first year of it being offered. This evaluation, therefore, measured early indications of potential changes that have been associated with the introduction of the Master’s Loan, building on the outcomes shown in the logic model shown in Figure 2.1 i.e. exploring changes to:
• PGT Student volumes;
• The profile of students (and hence the inclusiveness/accessibility) of PGT study;
• The quality of PGT students;
• The point in their careers at which students are able to access PGT;
• The range of funding sources available to PGT students (either positively or negatively);
• Choices of courses undertaken (e.g. subjects and length);
• Changes in provision offered by HEIs and the approaches taken by institutions to set fees for these courses; and
9 For courses starting in the 2016/17 academic year, the maximum Master’s Loan amount available was
23
• The experiences of using the Master’s Loan among students that took one out and their sense of achieving return on their investment in Master’s study. The research covered two key groups: students on PGT courses that were eligible to apply for a Master’s Loan and Higher Education Institutions (HEIs). There were four key strands to this evaluation:
• Analysis of secondary data, including five years of historic data from the HESA
Student Record (stretching back to the 2012/13 academic year); analysis was conducted on both the full dataset (which included all starts on Master’s courses at English HEIs) and on those deemed to be ‘loan-eligible’, that is, aged under 60, England-domiciled, without a prior postgraduate level qualification, and enrolled on a course eligible for Master’s Loan funding.
• A quantitative survey of 2,002 loan-eligible English domiciled Master’s
students studying at UK publicly funded institutions starting a course in the academic year 2016/17, covering both those that took out a Master’s Loan and those that did not. This survey was conducted using a combination of online and telephone interviewing throughout July and August 2018.
• 50 follow-up deep-dive qualitative interviews with Master’s students, conducted between August and September 2018. These interviews were follow-up interviews with students that had already completed the quantitative survey, and were selected for participation based upon their answers in that survey.
• An online survey of the Head of Postgraduate admissions, or another senior
member of staff with an overview of postgraduate admissions, at 79 UK HEIs, conducted throughout January and February 2018.
In addition, the study also involved analysis of the 2014 Understanding Mature
Transitions to Postgraduate Study10 dataset to provide a comparison from the pre-loans
period with the student survey findings. The Understanding Transitions research
involved a large-scale survey covering a wide range of different postgraduate students. For the purposes of this evaluation, we used a subset of survey respondents in the Transitions dataset who:
• Were studying for taught Master’s, MPhil or Research Master’s courses;
• Were domiciled in England;
10
24
• Started a course in the academic year 2013/14 (the year that the study was conducted)11.
For further information about the evaluation methodology and a detailed breakdown of the sample profile of each strand of this research, please refer to Appendix A.
Report conventions
• Throughout the report, unweighted base figures are shown on tables and charts to give an indication of the statistical reliability of the figures.
• As a general convention throughout the report, figures with a base size of fewer than 50 are not reported, although on charts and tables these figures have been retained for indicative purposes.
• All differences noted are significant to a 95 per cent confidence level unless
otherwise stated. Unless otherwise stated, z-tests were used to determine the level of significance between figures.
• All findings have been analysed by key subgroups and if in any instance no finding is
reported by these key subgroups then it is because there is no statistically significant difference.
• In some cases, figures in tables and charts may not always add to 100 percent due
to rounding (i.e. 99 percent or 101 percent) or where multiple responses were permitted (as stated in the footnote).
11 This is not a perfect comparison with the 2016/17 loans eligible population (because we were not able
25
3 Change in volumes of Master’s’ students
This chapter looks at the evidence around the impact that the introduction of the Master’s Loan has had on volumes of students undertaking Master’s courses. It primarily uses data from the HESA student record. The analysis looks at the overall Master’s population but also specifically at the England-domiciled loan-eligible students i.e. those who were on loan-eligible courses, aged under 60 and without a prior
postgraduate qualification. The analysis is limited to those studying at English HEIs.
Overall change in volumes of students
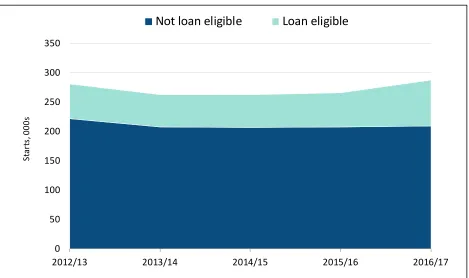
[image:25.612.75.544.369.647.2]Data from the HESA Student Record shows that there was a substantial increase in the number of Master’s students enrolling between the academic year 2015/16 (the year immediately prior to the introduction of the Master’s Loan) and 2016/17 (the year in which the Master’s Loan was introduced). Overall, as shown in Figure 3.1, enrolments increased from 266,000 in 2015/16 to 288,000 in 2016/17 (growth of 8%).
Figure 3.1 Number of students enrolling in each academic year – change over time
0 50 100 150 200 250 300 350
2012/13 2013/14 2014/15 2015/16 2016/17
St
ar
ts
, 0
00
s
Not loan eligible Loan eligible
26
This growth at the overall level was driven by an increase in England-domiciled loan-eligible students (that is, those aged under 60 without prior postgraduate qualifications, on loan-eligible courses). Between the two academic years, enrolments from England-domiciled loan-eligible students increased from 58,000 to 79,000 (growth of 36%), while non-loan eligible enrolments remained static (208,000 in 2015/16, to 209,000 in
2016/17). As Figure 3.2 shows this increase is against a backdrop of relatively static figures for the years immediately prior to the introduction of the Loan. Just over a quarter (27%) of enrolments in 2016/17 were from loan-eligible England-domiciled students, up from a consistent 21%-22% for each year prior to that back to 2012/13. Figure 3.2 Number of loan-eligible students enrolling in each academic year – change over time
Change in student volumes by region
There were some quite marked variations in the level of change in the volume of England-domiciled loan-eligible students between 2015/16 and 2016/17 by region, subject and institution. However, it is worth bearing in mind that often these changes only make a relatively small difference to the profile of the overall Master’s level population (because a large proportion of students are EU or international students or England-domiciled students who are not loan-eligible).
0 10 20 30 40 50 60 70 80 90
2012/13 2013/14 2014/15 2015/16 2016/17
St
ar
ts
, 000s
27
The increase in England-domiciled loan-eligible students has not been reflected evenly across the regions of the UK, with a notable north-south divide shown; all the regions with the largest percentage increases in loan-eligible master’s students between
2015/16 and 2016/17 were in the north of England or the Midlands (Figure 3.3). Only in one region (South West) was the increase in loan-eligible enrolments (8%) lower than the general increase in enrolments (10%). It is not clear why this should be the case, but it is worth noting that even at a regional scale, these statistics may be significantly affected by the individual or collective decisions of the few largest HEIs in one area. Figure 3.3 Change in enrolments (loan eligible and overall), 2015/16 to 2016/17, by region
The overall trend in student enrolments at Master’s level from 2015/16 to 2016/17 was not markedly different by institution tariff (Figure 3.4); however, for middle tariff
institutions the change in loan-eligible student enrolments was much more substantial (57%) than for low tariff (34%) and high tariff institutions (27%).
The reason for this is that the increase in loan-eligible enrolments at low and mid tariff institutions has been matched by a decline in non-loan eligible enrolments (−1% at mid tariff institutions and −4% at low tariff institutions), unlike at high tariff institutions (+3% increase in non-loan eligible enrolments).
11%
13%
6%
11%
5%
9%
4%
9%
10%
56%
53%
51%
49%
43%
39%
31%
26%
8% North East
East Midlands
Yorkshire and the Humber
North West
West Midlands
South East
East of England
London
South West
Overall change in enrolments 2015/16 to 2016/17 Change in loan eligible enrolments, 2015/16 to 2016/17
28
This does suggest that the impact of the loan has been greater in medium tariff institutions in particular.
Figure 3.4 Change in enrolments (loan eligible and overall), 2015/16 to 2016/17, by tariff
Extending this analysis to consider size of institution, institutions classified as large and medium sized (in terms of postgraduate volumes)12 saw enrolment trends very closely
in line with the overall trends shown at the start of this chapter (with overall enrolments increasing 9% at large institutions and 8% at medium institutions, and loan-eligible enrolments increasing by 35% and 38% respectively). At small institutions, however, there was a 58% increase in enrolments from English-domiciled loan-eligible students, and a 7% reduction in enrolments from other students.
Overall, most HEIs (120) experienced an increase in English-domiciled loan-eligible students between 2015/16 and 2016/17, and only a small minority (11) saw a decrease.
12 HEIs with more than 750 postgraduate students were classed as large, HEIs with fewer than 750 but
more than 185 were classed as medium, and those with 185 or fewer postgraduate students were classed as small.
8%
10%
8%
4%
27%
57%
34%
3% High
Middle
Low
No tariff
Overall change in enrolments 2015/16 to 2016/17 Change in loan eligible enrolments, 2015/16 to 2016/17
29
By subject area, the largest overall increases in Master’s enrolments between 2015/16 and 2016/17 were seen in Arts (23%), Natural Sciences (18%) and Humanities (17%). As Figure 3.5 shows, in each of these subject areas, large increases were also seen in the number of loan-eligible enrolments from England-domiciled students.
In most cases, the changes in enrolments by subject at an overall level were largely driven by increases in the volumes of loan-eligible England-domiciled students. Generally, the volumes of other students remained constant between 2015/16 and 2016/17 (except in Medical and Health Sciences where enrolments from other students increased by 8% while the volume of loan-eligible England-domiciled students
increased only very slightly perhaps partly because activities already receiving NHS funding are specifically excluded from loan eligibility).
30
Figure 3.5 Change in enrolments (loan eligible and overall), 2015/16 to 2016/17, by subject area
Looking more narrowly at JACS Principal Subject Codes, the largest increases in enrolments from England-domiciled loan-eligible students were seen in Law (77%) and Agriculture (73%), followed by Creative Arts and Design (59%), Computer Science (58%), Biological Sciences (50%) and Mass Communications and Documentation (50%). In Education there was a reduction of 3% in non-loan eligible enrolments in this subject (a loss of 1,320 students), and a 21% increase in England-domiciled loan-eligible enrolments (an addition of 1,011 students), possibly indicating some changes in the design of provision to take advantage of the loan conditions.
HEI views on changes in student volumes
The HESA data findings are supported by the results of the survey of HEIs. Three-quarters of HEIs interviewed (75%) said that applications for Master’s courses
increased in 2016/17; 38% stated that they increased a lot. The number of enrolments from students eligible for the Master’s Loan was reported to have increased as well;
7%
6%
18%
4%
8%
23%
17%
4%
43%
46%
36%
46%
59%
37% Medical and health
sciences Engineering and
technology
Natural sciences
Social sciences
Business and law
Arts
Humanities
Overall change in enrolments 2015/16 to 2016/17 Change in loan eligible enrolments, 2015/16 to 2016/17
31
76% reported an increase in enrolments from this group, and 38% said that enrolments had increased a lot.
Providers were asked how the number of enrolments on courses eligible for the loan related to their expectations; a third (32%) said that the number starting had been higher than expected, and only 3% that numbers had been lower than expected (33% felt the number of starts was at the level they had expected, and 25% had no
expectations).
The great majority of those seeing an increase in the number of postgraduate students eligible for the loan attributed this change at least in part to the introduction of the loan (84%, equivalent to 66% of all providers); 42% (equivalent to 33% of all providers) said that the increase was ‘to a large extent’ due to the loan. When asked why the loan might have this effect, 62% (equivalent to 43% of all providers) said it was because the loan had allowed more potential applicants to afford postgraduate study.
As Figure 3.6 shows, there was a strong consensus among providers that 2016/17 saw a substantial increase in loan-eligible Master’s enrolments relative to previous years. At the time when the survey was conducted, HEIs were also able to comment on
enrolments for 2017/18 and a third of HEIs reported that they saw an increase in enrolments between 2016/17 and 2017/18 although it was more common to report that numbers stabilised.
32
By subject area, HEIs were most likely to report an increase in demand for Master’s loan eligible courses in 2016/17 in business and administrative studies, as well as in social studies, as shown in Figure 3.7.
Figure 3.7 HEP perceptions of courses in which loan eligible enrolments increased, 2016/17
76%
35%
11% 37%
3%
18%
10% 10%
Number of students starting in 2016/17,
compared to previous years Level of take-up 2017/18, compared to2016
Increase/Higher
No change
Decrease/Lower
Don't know
Dec
reas
e
In
cre
ase
33
Evidence from student survey on changes in student
volumes
The role of the loan in increasing enrolments on Master’s courses is also supported by the student survey data; 72% of students in receipt of a loan felt that they would have been unable to undertake their specific Master’s course without a loan. This was particularly likely to be the case for female students (75%), although still widespread among male students (69%).
As shown in Figure 3.8, 36% of students agreed that they would “never even thought about studying a Master’s” if the Master’s Loan had not been available. There were marked differences between the responses of male and female students; female students were substantially more likely than male students (40% vs. 32%) to say that their decision to study was entirely dependent on the availability of the loan.
Figure 3.8 Student agreement with the statement that without the availability of the loan they never would have even thought about studying a Master’s; overall and by gender
44% 41% 28%
27% 24% 23% 23% 20% 19% 18% 16% 16% 16%
Business & administrative studies Social studies Historical & philosophical studies Creative arts & design Computer science Biological sciences Law Engineering & technology Mass communications & documentation Physical sciences Languages Education Subjects allied to medicine
34
It was also more likely for students at HEIs with a Low Tariff rating to consider that they “never would have even thought about” a Master’s without the loan; 42% of those at low tariff institutions agreed with this statement, compared to 32% at medium tariff and 37% at high tariff institutions.
36%
35%
37%
13%
12%
14%
14%
12%
17%
13%
14%
12%
23%
26%
19% All
Female
Male
Strongly disagree (1) 2 3 4 Strongly agree (5)
Net agree: 36%
Net agree: 40%
Net agree: 32% Net disagree: 49%
Net disagree: 47%
Net disagree: 50%
35
4 Change in profile of Master’s students
This chapter looks at the impact that the introduction of the Master’s Loan has had on the profile of students undertaking Master’s courses, with a view to understanding if the intended aim of widening participation has been achieved. One of the other aims
outlined in the logic model was for the introduction of the Loan to improve or maintain the overall quality of Master’s students; quality is quite a difficult concept to measure but this chapter also includes consideration of some factors that could consider to be
related to quality. The data used in this chapter comes from a combination of the HESA student record and from the quantitative survey.
Age and gender profile
The HESA Student Record indicates that the age profile of loan-eligible
England-domiciled students enrolling for Master’s courses did not change substantively between 2015/16 and 2016/17 (when the Master’s Loan was introduced).
Figure 4.1 Age profile of loan-eligible England-domiciled Master’s students – change over time
Similarly, the gender profile has remained unchanged, at around 44% male and 56% female for all years from 2012/13 to 2016/17.
49% 49% 52% 52% 53%
28% 28% 27% 27% 25%
15% 15% 14% 14% 13%
8% 9% 8% 8% 8%
2012/13 2013/14 2014/15 2015/16 2016/17
46 and over
36 to 45
26 to 35
Under 25
36
Ethnicity profile
A change can be seen in the profile of loan-eligible England-domiciled students by ethnicity between 2015/16 and 2016/17; the proportion made up of White students reduced slightly, from 72% to 70%, while the proportion made up of Black students increased from 8% to 11% (figure 4.2). Although this change appears small in
percentage point terms, the increase in composition of black students in a single year represents a large amount. When looking at the actual numbers of England domiciled Black students there was an 84% increase in 2016/17 compared with 2015/16 (the numbers increased from 4,867 to 8,945)
Figure 4.2 Ethnicity profile of loan-eligible England-domiciled Master’s students – change over time
Indicators of disadvantage
It is possible to make other comparisons of student characteristics by comparing responses between the 2013/14 cohort interviewed as part of the Understanding
Transitions study and the 2016/17 cohort interviewed for this evaluation. These
comparisons show no change in the distribution of new enrolments by whether students’ parents had studied at university or HE college, which can be used an indicator of
advantage/disadvantage (49% in the 2013/14 cohort, 50% in the 2016/17), but an
72% 73% 73% 72% 70%
8% 8% 8% 8% 11%
11% 10% 10% 11% 10%
6% 6% 6% 6% 6%
3% 3% 3% 2% 3%
2012/13 2013/14 2014/15 2015/16 2016/17
White Black Asian Mixed Not stated
37
increase in the proportion of students with dependent children (from 16% in the 13/14 cohort to 24% in the 16/17 cohort).
In the case of both these characteristics there was a difference in profile among the 2016/17 cohort between those who took out the loan and those who did not:
• In terms of parental background: students whose parents had not studied at
university were more likely to have taken out the loan (60%) than those whose parents did study at university (31%).
• In terms of dependent children: Among loan-takers, the proportion with dependent children was much lower (18%) than among those who did not take out a loan (31%). Hence in this respect, the loan is less likely to be helping those facing this particular potential disadvantage.
Another characteristic associated with potential disadvantage is having a disability or health condition. The survey data indicated that around 8% of the 2016/17 cohort had a disability or health condition but we do not have comparable information from earlier cohorts with which to compare this. However, it is worth noting that within the 16/17 cohort, students with a disability were more likely to have taken out the loan (72%) than those with no disability (55%), perhaps indicating that it is helping those with a disability or health condition to a greater extent than those without.
Prior attainment profile
38
Figure 4.3 Undergraduate degree grade – change over time
Among the 2016/17 cohort, those aged 25 and under were less likely than older students to have no undergraduate degree (1% compared with 4% of those aged 26 and over). Younger students were also more likely to have a First class degree (29%) or an Upper second class (58%).
White students were more likely than BAME students to have a First class degree (23% compared with 18%).
Motivations for study
Another measure that we can look at to compare students is their stated motivation for Master’s study. Although this is not a measure of quality in the sense of academic capability, looking at motivations for study can help to explore whether introducing the Master’s Loan has had or is likely to have the desired impact of leading to more students working in higher level jobs (than they would have been employed in without achieving a Master’s). Comparing the responses of the 2013/14 cohort provided by the
Transitions survey with those for the 2016/17 cohort from the survey conducted for this
evaluation indicates that – across UK-domiciled loan-eligible students – the motivations
21%
52%
19%
4% 2%
1% 22%
51%
17%
2%
8%
*%
First Upper Second Lower Second Third Other No grade
Transitions Survey (2013/14 starts) Masters Loans Survey (2016/17 starts)
Transitions Survey: Base = All 2013/14 PGT starts who completed an undergraduate degree in UK (2,061) Master’s Loans Survey: Base = All students who completed an undergraduate degree (1,945)
39
for study have become slightly less career-focussed. As Figure 4.4. shows, the
proportion of students who stated that their primary motivation was being interested in the subject has increased for the 2016/17 cohort (from 10% of the 2013/14 cohort to 18%) while the proportions stating that their primary motivation was strongly career-related (e.g. to improve their employment prospects or because it was a requirement of their chosen profession) have decreased. Overall, 54% of the 2013/14 cohort gave a primary motivation that was career-related compared to 44% in 2016/17.
Figure 4.4 Main motivation for Master’s study – change over time
Students in receipt of the Loan were more likely to say their main reason for studying was to improve their employment prospects (20% compared with 12% of those not in receipt of the Loan), and to say it was because they wanted to continue studying (4% compared with 2% of non-Loan students). At the same time, they were less likely to cite wanting to progress in their current career (9% compared with 16% of non-Loan
students), and less likely to say they wanted to develop a broader range of skills and knowledge (5% compared with 8% of non-Loan students).
There were a number of differences between those studying full-time and those
studying part-time, as shown in Table 4.1 overleaf. Full-time students were more likely than part-time students to say their main reason for studying their Master’s course was interest in the subject (20%), wanting to improve their employment prospects (19%), wanting to progress to a higher qualification (7%), or because it was a requirement to
10% 21% 11% 8% 7% 5% 8% 9%
4% 4% 3%
2% 1%
18% 17%
12% 9%
7% 6% 6%
4% 3%
2% 2% 2% 2%
You were interested in the subject To improve your employment prospects To progress in your current career
To develop a more specialist set
of skills and knowledge
You want to change your current
career
To develop a broader range of skills and knowledge To enable you to progress to a
higher level qualification (e.g. PhD)
It was a requirement to enter your chosen profession Because you wanted to continue studying
It felt like a natural step for you
You want a career in higher education (e.g. a research or teaching career) The funding was available
To prove you were capable
of postgraduate
study
Transitions Survey (2013/14 starts) Masters Loans Survey (2016/17 starts)
Transitions Survey: Base = All 2013/14 PGT starts (2,530) Master’s Loans Survey: Base = All students (2,002)
40
enter their chosen profession (5%). However, part-time students were more likely to say they wanted to progress in their current career (17% compared with 8%).
Table 4.1 Main reason for studying Master’s course by mode of study and age
Full-time Part-time 25 and under 26-35 36-45 46 and over Being interested in
the subject 20% 15% 23% 13% 11% 21%
Wanting to improve employment
prospects 19% 13% 21% 14% 12% 9%
Wanted to progress
in current career 8% 17% 8% 16% 19% 8%
To develop a more specialist set of skills and knowledge
7% 12% 7% 10% 9% 11%
Wanted to change
current career 7% 7% 3% 10% 10% 11%
To develop a broader range of skills and
knowledge
5% 7% 5% 6% 8% 7%
Wanting to progress to a higher
qualification 7% 4% 8% 4% 4% 6%
A requirement to enter chosen
profession 5% 3% 4% 5% 5% 4%
Master’s Loans Survey: Base: All students (2,002)
Studying for interest was most common among the youngest and oldest students: being interested in the subject was the main reason given by 23% of those aged 25 and under and 21% of those aged 46 and over, compared with 13% of those aged 26-35 and 11% of those aged 36-45. Those aged 25 and under were also more likely to say their main reason was to improve their employment prospects (21%) compared with 14% of those aged 26-35, 12% of those aged 36-45, and 9% of those aged 46 and over.
Those aged 26-35 and 36-45 were both more likely to say their main reason for
studying was to progress in their current career (16% and 19% respectively) compared with those aged 25 and under and 46 and over (each 8%).
41
Students who had taken out an undergraduate loan were more likely to say their main reason for doing a Master’s course was to improve their employment prospects (19%) compared to those who had not taken out an undergraduate loan (11%).
42
5 Change in timing of Master’s’ students
One of the other outcomes stated in the Master’s Loan logic model was that students might be encouraged to start their Master’s course earlier than they might otherwise have done (because they do not need to save as much to fund their study). This chapter explores whether the introduction of the Master’s Loan affected the timing of Master’s degrees, particularly whether students were able to start and/or complete their course earlier. Also whether there are any indications that students deferred their study in anticipation of the introduction of the Loan (as there was advance media coverage for some years prior, indicating that the introduction of the Loan was a possibility). This is important context to understand whether the effects observed in 2016/17 might be artificially inflated.
Interval between undergraduate and Master’s study
Nearly all Master’s students had completed an undergraduate degree first. Comparing the gap between completing their undergraduate course and starting their Master’s course for students from the 2013/14 cohort (taken from the Transitions survey) and the 2016/17 cohort shows gaps to be very similar at an overall level (as shown in Figure 5.1 overleaf)13.
13 While it is possible that the gap between finishing their undergraduate course and starting their
43
Figure 5.1 Transition times between completing undergraduate degree and starting Master’s for 2013/14 and 2016/17 cohorts
Among students starting in 2016/17, those who studied full-time were much more likely to have started their Master’s course within a year of finishing their undergraduate degree (52% compared with 16% of those studying part-time). This is very similar to the situation among the 2013/14 survey respondents (51% of full-time students compared with 13% of those studying part-time).
Overall, younger students were much more likely to progress straight from their
undergraduate degree to their Master’s course; in 2016/17, 63% of those aged 25 and under transitioned in less than a year (higher than 58% in 2013/14), compared with 14% of those aged 26-35 (up from 9% in 2013/14), and 14% of those aged 36 and over (in line with 10% in 2013/14).
This pattern by age is evident among both those studying full-time and part-time: in 2016/17 among those studying full-time, 68% of those aged 25 and under started their Master’s course within a year (in line with 64% in 2013/14), compared with 19% of those aged 26-35 and 17% of those aged 36 and over (also in line with the proportion of 14% for each older age group in 2013/14).
36% 37%
16% 15%
9% 7%
40% 41%
2013/14 2016/17
3 or more years
2 years to less than 3 years 1 year to less than 2 years Less than a year
Transitions Survey: Base = All students giving date of undergraduate completion (2,487)
44
Similarly, in 2016/17, among those studying part-time, 37% of those aged 25 and under progressed within a year (in line with 33% in 2013/14), compared with 10% of those aged 26-35 (an increase on 6% in 2013/14), and 13% of those aged 36 and over (also an increase on 9% in 2013/14).
Figure 5.2 The gap between finishing undergraduate study and beginning postgraduate study
There were quite considerable differences in the 2016/17 cohort between those who had taken out a loan and those who had not. Almost half (48%) of loan-takers had less than a year between their undergraduate and Master’s study (i.e. they had progressed straight through) compared with 23% of those who did not take out a Loan. Seventeen per cent of loan-takers had between one and two years between their undergraduate degree and Master’s study compared with one in ten (11%) who did not take out a loan. Learners who did not take out a Master’s loan were more likely to have completed their undergraduate degree (59%) at least three years before commencing their Master’s degree than loan-takers (27%).
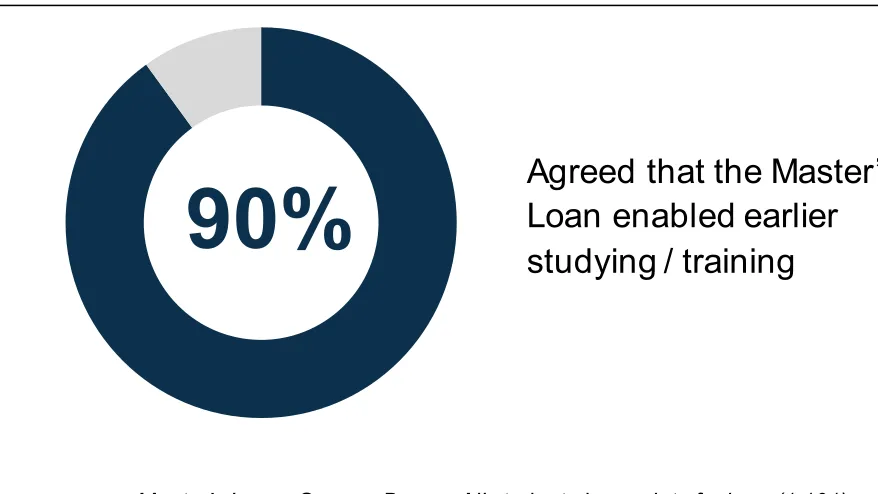
When asked directly, students who had taken out the Master’s loan felt strongly that the loan had enabled them to begin postgraduate study sooner. Nine in ten loan-takers (90%) agreed that the Master’s Loan enabled earlier study or training (Figure 5.3).
36%
16%
9%
40%
37%
15%
7%
41%
Less than a year
1 year to less than 2 years
2 years to less than 3 years
3+ years ago
Transitions Survey (2013/14 starts)
Masters Loans Survey (2016/17 starts)
48%* 23%
Loan Non-Loan
Transitions survey: Base = All students giving date of undergraduate completion (2,487)
Master’s Loans Survey: Base = If completed an undergraduate first degree and gave date of undergraduate completion (1,929) – Loans (1,075), Non-Loans (854) 17%
7%
28%
11%
6%
45
Figure 5.3 Agreement with statement ‘Your Postgraduate Loan made it possible to start studying or training sooner than would otherwise have been possible’
There is an apparent inconsistency between the proportion of students saying that the Loan has enabled earlier training and the findings from the HESA Student Record (which as shown in the previous chapter showed no difference in the age profile of students in 2016/17 compared with previous years). It is possible that this is because students were only able to begin their postgraduate study slightly earlier due to the loan, meaning no difference is visible when looking at banded age groups. To some extent, looking at mean ages of students using the HESA student record supports this. There was a slight change in the mean age of UK-domiciled Master’s students between the 2015/16 academic year and 2016/17: the mean age of students in the 2015/16 cohort was 31.58, compared to 31.39 for 2016/17. However, it is worth highlighting that this falls in the context of a broader trend in a reduction in the average age of UK-domiciled Master’s students (for context, the 2014/15 cohort had a mean age of 31.85).
This discrepancy may also be a function of the fact that Master’s students who have taken out a loan feel that they depend heavily on it and find it difficult to envisage how they would have funded their study otherwise (and assume that it would have required a long period of saving).
In the qualitative interviews, there were several students who felt that access to the loan had enabled them to study earlier. The main way that the loan was felt to allow for earlier access to postgraduate study was in allowing students to apply for a Master’s
Agreed that the Master’s
Loan enabled earlier
studying / training
90%
46
course without having to first find employment in order to build savings to fund their course. A few students indicated that they felt this would have taken two or three years to achieve.
“I would have had to build up a financial cushion before taking the Master’s… I know a couple of more mature people who had worked in industry for a while and then decided to take that next step.”
Loan-taker, full-time student, one-year course
One mature student who participated in a qualitative interview felt that, due to being older than the average student, if she had not proceeded straight from undergraduate education to postgraduate, it would have been difficult to re-enter academia. The Master’s Loan not only accelerated her access to postgraduate level study, but also enabled it entirely, as she felt that a break from study would have resulted in her never returning to it.
“Because of my age, I thought if I take any time out, then there’s definitely no chance of me going back again.”
Loan-taker, full-time student, one-year course
<