New Multi-Dimensional Sorting based
K-Anonymity Microaggregation for Statistical
Disclosure Control
Abdun Naser Mahmood1, Md Enamul Kabir2, and Abdul K Mustafa3 1,2
School of Engineering and Information Technology, University of New South Wales Australian Defence Force Academy Canberra, ACT 2600, Australia and3University of Canberra,ACT, Australia
{Abdun.Mahmood,m.kabir}@unsw.edu.au,[email protected]
Abstract. In recent years, there has been an alarming increase of online identity theft and attacks using personally identifiable information. The goal of privacy preservation is to de-associate individuals from sensitive ormicrodata information. Microaggregation techniques seeks to protect microdata in such a way that can be published and mined without pro-viding any private information that can be linked to specific individuals. Microaggregation works by partitioning the microdata into groups of at leastk records and then replacing the records in each group with the centroid of the group. An optimal microaggregation method must min-imize the information loss resulting from this replacement process. The challenge is how to minimize the information loss during the microaggre-gation process. This paper presents a new microaggremicroaggre-gation technique for Statistical Disclosure Control (SDC). It consists of two stages. In the first stage, the algorithm sorts all the records in the data set in a particular way to ensure that during microaggregation very dissimilar observations are never entered into the same cluster. In the second stage an optimal microaggregation method is used to createk-anonymous clusters while minimizing the information loss. It works by taking the sorted data and simultaneously creating two distant clusters using the two extreme sorted values as seeds for the clusters. The performance of the proposed tech-nique is compared against the most recent microaggregation methods. Experimental results using benchmark datasets show that the proposed algorithm has the lowest information loss compared with a basket of techniques in the literature.
Key words: Privacy; Microaggregation; Microdata protection;k-anonymity; Disclosure control;
1 Introduction
organizations often need to release individual records (microdata) for research and other public benefit purposes. This propagation has to be in accordance with laws and regulations to avoid the propagation of confidential information. In other words, microdata should be published in such a way that preserve the privacy of the individuals. Microdata protection in statistical databases has re-cently become a major societal concern and has been intensively studied in recent years. Microaggregation for Statistical Disclosure Control (SDC) is a family of methods to protect microdata from individual identification. SDC seeks to pro-tect microdata in such a way that can be published and mined without providing any private information that can be linked to specific individuals. SDC is often applied to statistical databases before they are released for public use.
To protect personal data from individual identification, SDC is often applied before the data are released for analysis [2, 26]. The purpose of microdata SDC is to alter the original microdata in such a way that the statistical analysis from the original data and the modified data are similar and the disclosure risk of identification is low. As SDC requires suppressing or altering the original data, the quality of data and the analysis results can be damaged. Hence, SDC methods must find a balance between data utility and personal confidentiality.
Various methods for Microaggregation has been proposed in the literature for protecting microdata [3, 4, 7, 8, 11, 12, 20, 23]. The basic idea of microaggrega-tion is to partimicroaggrega-tion a dataset into mutually exclusive groups of at leastkrecords prior to publication, and then publish the centroid over each group instead of individual records. The resulting anonymized dataset satisfiesk-anonymity [18], requiring each record in a dataset to be identical to at least (k−1) other records in the same dataset. As releasing microdata about individuals poses privacy threat due to the privacy-related attributes, called quasi-identifiers, bothk-anonymity and microaggregation only consider the quasi-identifiers. Microaggregation is traditionally restricted to numeric attributes in order to calculate the centroid of records, but also has been extended to handle categorical and ordinal at-tributes [4, 8, 19]. In this paper we propose a microaggregated method that is also applicable to numeric attributes.
that records within a group are similar to each other, while records in different groups are most distinct from one another. Thus, microaggregation can be seen as a clustering problem with constraints on the size of the clusters.
Many microaggregation methods derive from traditional clustering algo-rithms. For example, Domingo-Ferrer and Mateo-Sanz [3] proposed univariate and multivariatek-Ward algorithms that extend the agglomerative hierarchical clustering method of Ward et al. [24]. Domingo-Ferrer and Torra [6, 7] pro-posed a microaggregation method based on the fuzzy c-means algorithm [1], and Laszlo and Mukherjee [13] extended the standard minimum spanning tree partitioning algorithm for microaggregation [27]. All of these microaggregation methods build all clusters gradually but simultaneously. There are some other methods for microaggregation that have been proposed in the literature that build one/two cluster(s) at a time. Notable examples include Maximum Distance [15], Diameter-based Fixed-Size microaggregation and centroid-based Fixed-size microaggregation [13], Maximum Distance to Average Vector (MDAV) [8], MHM [9] and the Two Fixed Reference Points method [28]. Most recently, Linet al.[29] proposed a density-based microaggregation method that forms clusters by the descending order of their densities, and then fine-tunes these clusters in reverse order.
The reminder of this paper is organized as follows. We introduce the prob-lem of microaggregation in Section 2. Section 3 introduces the basic concept of microaggregation. Section 4 reviews previous microaggregation methods. We present a brief description of our proposed microaggregation method in Sec-tion 5. SecSec-tion 6 shows experimental results of the proposed method. Finally, concluding remarks are included in Section 7.
2 Problem Statement
The algorithms for microaggregation works by partitioning the microdata into groups, where within groups the records are homogeneous but between groups the records are heterogeneous so that information loss is low. The similar groups are also called clusters. The level of privacy required is controlled by a security parameterk, the minimum number of records in a cluster. In essence, the pa-rameterkspecifies the maximum acceptable disclosure risk. Once a value for k
has been selected by the data protector, the only job left is to maximize data utility. Maximizing utility can be achieved by microaggregating optimally, i.e. with minimum within-groups variability loss. So the main challenge in microag-gregation is how to minimize the information loss during the clustering process. Although plenty of work has been done, to maximize the data utility by forming the clusters, this is not yet sufficient in terms of information loss. So more re-search needs to be done to form the clusters such that the information loss is as low as possible. This paper analyses the problem with a new multi-dimensional sorting algorithm such that the information loss is minimal.
the first stage. In the second stage two distant clusters are made simultaneously in a systematic way. According to the second stage, sort all records in ascending order by using a sorting algorithm in the first stage explained in Section 5) so that the first record and the last record are most distant to each other. Form a cluster with the first record and its (k−1) nearest records and another cluster with the last record and its (k−1) nearest records. Sort the remaining records ((n−2k), if dataset containsnrecords) by using the same sorting algorithm and continue to build pair clusters at the same time by using the first and the last record as seeds until some specified records remain. Finally form one/two cluster(s) depending on the remaining records. Thus all clusters produced in this way containkrecords except the last cluster that may contain at the most (2k−1) records. Performance of the proposed method is compared against the most recent widely used microaggregation methods. The experimental results show that the proposed microaggregation method outperforms the recent methods in the literature.
3 Background
Microdata protection through microaggregation has been intensively studied in recent years. Many techniques and methods have been proposed to deal with this problem. In this section we describe some fundamental concepts of microag-gregation.
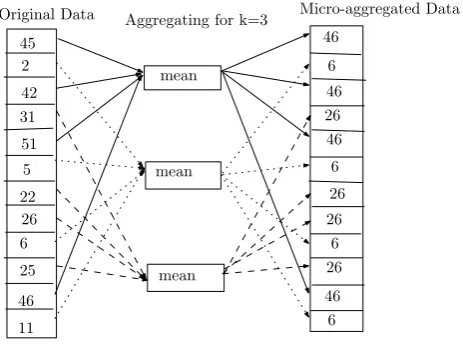
When we microaggregate data we should keep in mind two goals: data utility and preserving privacy of individuals. For preserving the data utility we should introduce as little noise as possible into the data and preserving privacy data should be sufficiently modified in such a way that it is difficult for an adver-sary to reidentify the corresponding individuals. Figure 1 shows an example of microaggregated data where the individuals in each cluster are replaced by the corresponding cluster mean. The figure shows that after aggregating the chosen elements, it is impossible to distinguish them, so that the probability of linking any respondent is inversely proportional to the number of aggregated elements. Consider a microdata setT withpnumeric attributes and nrecords, where each record is represented as a vector in a p-dimensional space. For a given positive integerk≤n, a microaggregation method partitions T into g clusters, where each cluster contains at leastkrecords (to satisfyk-anonymity), and then replaces the records in each cluster with the centroid of the cluster. Letnidenote the number of records in the ith cluster, and xij,1 ≤ j ≤ ni, denote the jth record in the ith cluster. Then, ni ≥ k for i = 1 to g, and
∑g
i=1ni =n. The centroid of the ith cluster, denoted by ¯xi is calculated as the average vector of all the records in theith cluster.
5 2 11 6 25 22 31 26 45 42 51 46 6 6 6 6 26 26 26 26 46 46 46 46 mean mean mean
[image:5.595.193.425.95.267.2]Original Data Aggregating for k=3 Micro-aggregated Data
Fig. 1. Example of Microaggregation using mean
IL=SSE
SST (1)
where SSE is the within-cluster squared error, calculated by summing the Eu-clidean distance of each recordxij to the average value ¯xi as follows:
SSE= g ∑ i=1 ni ∑ j=1
(xij−x¯i) ′
(xij−x¯i) (2)
andSST is the sum of squared error within the entire datasetT, calculated by summing the Euclidean distance of each record xij to the average value ¯x as follows: SST = g ∑ i=1 ni ∑ j=1
(xij−x¯) ′
(xij−x¯) (3)
For a given datasetT,SSTis fixed regardless of howT is partitioned. On the other hand, SSE varies of a dataset depending on the partition of the dataset. In essence, SSE measures the similarity of the records in a cluster. The lower the SSE, the higher the within-cluster homogeneity and the higher the SSE, the lower the within cluster homogeneity. If all the records in a cluster are the same, then the SSE is zero indicating no information is lost. On the other hand, if all the records in a cluster are more diverse, SSE is large indicating more informa-tion is lost. In this paper, we used SSE as a measure of similarity indicating a record will be included in a particular cluster if it causes least SSE among all other records in the dataset. Therefore, the microaggregation problem can be enumerated as a constraint optimization problem as follows:
1. Gi∩Gj=Φ, for alli̸=j= 1,2, ..., p, 2. ∪pi=1Gi=T,
3. SSEis minimized,
4. for allGi∈T,|Gi|≥kfor any Gi∈G.
The microaggregation problem stated above can be solved in polynomial time for a univariate dataset [12] but has been shown to be NP hard for multivariate dataset [14]. It is a natural expectation thatSSEis low if the number of clusters is large. Thus the number of records in each cluster should be kept close tok. Domingo-Ferrer and Mateo-Sanz [3] showed that no cluster should contain more than (2k−1) records since such clusters can always be partitioned to further reduce information loss.
4 Previous Microaggregation Methods
Previous microaggregation methods have been roughly divided into two cate-gories, namely fixed-size and data-oriented microaggregation [3, 9]. For fixed-size microaggregation, the partition is done by dividing a dataset into clusters that have sizek, except perhaps one cluster which has a size betweenkand (2k−1), depending on the total number of records n and the anonymity parameter k. For the data-oriented microaggregation, the partition is done by allowing all clusters with sizes betweenkand (2k−1). Intuitively, fixed-size methods reduce the search space, and thus are more computationally efficient than data-oriented methods [29]. However, data-oriented methods can adapt to different values ofk
and various data distributions and thus may achieve lower information loss than fixed-size methods.
Domingo-Ferrer and Mateo-Sanz [3] proposed a multivariate fixed-size mi-croaggregation method, later called the Maximum Distance (MD) method [15]. The MD method repeatedly locates the two records that are most distant to each other, and forms two clusters with their respective (k−1) nearest records until fewer than 2k records remain. If at least k records remain, it then forms a new cluster with all remaining records. Finally when there are fewer than k
records not assigned to any cluster yet, this algorithm then individually assigns these records to their closest clusters. This method has a time complexity of
O(n3) and works well for most datasets. Laszlo and Mukherjee [13] modified the last step of the MD method such that each remaining record is added to its own nearest cluster and proposed Diameter-based Fixed-size microaggregation. This method is however not a fixed size method because it allows more than one cluster to have more thank records.
The MDAV method is the most widely used microaggregation method [15]. MDAV is the same as MD except in the first step. MDAV finds the record r
the remaining records, repeat this process until fewer than 2krecords remain. If betweenkand (2k−1) records remain, MDAV simply forms a new group with all of the remaining records. On the other hand, if the number of the remaining records is belowk, it adds all of the remaining records to their nearest clusters. So MDAV is a fixed size method. Lin et al. [29] proposed a modified MDAV, called MDAV-1. The MDAV-1 is similar to MDAV except when the number of the remaining records is between k and (2k−1), a new cluster is formed with the record that is the furthest from the centroid of the remaining records, and its (k−1) nearest records. Any remaining records are then added to their respective nearest clusters. Experimental results indicate that MDAV-1 incurs slightly less information loss than MDAV [29]. Another variant of the MDAV method, called MDAV-generic, is proposed by Domingo-Ferrer and Torra [8], where by the threshold 2k is altered to 3k. If between 2kand (3k−1) records remain, then find the recordrthat is furthest from the centroid of the remaining records and form a cluster with r and its (k−1) nearest records and another cluster with the remaining records. Finally when fewer than 2krecords remain, this algorithm then forms a new cluster with all the remaining records. Laszlo and Mukherjee [13] proposed another method, called Centroid-based Fixed-size microaggregation that is also based on a centroid but builds only one cluster during each iteration. This algorithm first find a recordr that is furthest from the current centroid of the dataset and then find a cluster withrand its (k−1) nearest records. For the remaining records repeat the same process until fewer thankrecords remain. Finally add each remaining record to its nearest clusters. This method is not a fixed-size method as more than one cluster has more than
krecords. Solanaset al.[16] proposed a variable-size variant of MDAV, called V-MDAV. V-MDAV first builds a new cluster ofkrecords and then tries to extend this to up to (2k−1)records based on some criteria. V-MDAV adopts a user-defined parameter to control the threshold of adding more records to a cluster. Chang et al. [28] proposed the Two Fixed Reference Points (TFRP) method to accelerate the clustering process ofk-anonymization. During the first phase, TFRP selects two extreme points calculated from the dataset. Let Nmin and Nmax be the minimum and maximum values over all attributes in the datasets, respectively, then one reference pointG1hasNmin as its value for all attributes, and another reference pointG2hasNmaxas its value for all attributes. A cluster of krecords is then formed with the record r that is the furthest fromG1 and the (k−1) nearest records tor. Similarly another cluster ofkrecords is formed with the recordsthat is the furthest fromG2and (k−1) nearest records tos. These two steps are repeated until fewer than k records remain. Finally, these remaining records are assigned to their respective nearest clusters. This method is quite efficient as G1 and G2 are fixed throughout the iterations. When all clusters are generated, TFRP applies a enhancement step to determine whether a cluster should be retained or decomposed and added to other clusters.
highestk-density among all records that are not yet assigned to any cluster until fewer than k unassigned records remain. These remaining records are then as-signed to their respective nearest clusters. The DBA-1 partitions the dataset into some clusters, where each cluster contains no fewer than krecords. The second state of DBA (DBA-2) attempts to fine-tune all clusters by checking whether to decompose a cluster and merge its content with other clusters. Notably, all clusters are checked during the DBA-2 by the reverse of the order that they were added to clusters in the DBA-1. After several clusters are removed and their records are added to their nearest clusters in the DBA-2, some clusters may contain more than (2k−1) records. At the end of the DBA-2, the MDAV-1 algorithm is applied to each cluster with size above (2k−1) to reduce the in-formation loss. This state is finally called MDAV-2. Experimental results show that the DBA attains a reasonable dominance over the latest microaggregation methods.
All of the microaggregation methods described above repeatedly choose one/ two records according to various heuristics and form one/two cluster(s) with the chosen records and their respective (k−1) other records. However there are other microaggregation methods that build all clusters simultaneously and work by initially forming multiple clusters of records in the form of trees, where each tree represent a cluster. The multivariate k-Ward algorithm [3] first finds the two records that are furthest from each other in the dataset and build two clusters from these two records and their respective (k−1) nearest records. Each of the remaining record then forms its own cluster. These clusters are repeatedly merged until all clusters have at leastkrecords. Finally the algorithm is recursively applied to each cluster containing 2k or more records. Domingo-Ferrer et al. [10] proposed a multivariate microaggregation method called µ -Approx. This method first builds a forest and then decomposes the trees in the forest such that all trees have sizes betweenkand max(2k−1,3k−5). Finally, for any tree with size greater than (2k−1), find the node in the tree that is furthest from the centroid of the tree. Form a cluster with this node and its (k−1) nearest records in the tree and form another cluster with the remaining records in the tree.
Hansen an Mukherjee [12] proposed a microaggregation method for univariate datasets called HM. After that Domingo-Ferreret al.[9] proposed a multivariate version of the HM method, called MHM. This method first uses various heuris-tics, such as nearest point next (NPN), maximum distance (MD) or MDAV to order the multivariate records. Steps similar to the HM method are then applied to generate clusters based on this ordering. Domingo-Ferrer et al.[7] proposed a microaggregation method based on fuzzy c-means algorithm (FCM) [1]. This method repeatedly runs FCM to adjust the two parameters of FCM (one is the number of clusters c and another is the exponent for the partition matrix m) until each cluster contains at leastkrecords. The value ofcis initially large (and
5 The Proposed Approach
This section presents the proposed sorting algorithm and pairwise systematic algorithm for microaggregation that minimizes the information loss and satisfies thek-anonymity requirement.
It has been observed that the reason many of the existing techniques has high information loss is due to some clusters containing verydifferent observa-tions which increases the information of a cluster. Therefore, the initial choice of cluster(s) is often difficult since these observations are not known in advance. The proposed technique solves this problem by applying a multi-dimensional sorting on the dataset in a particular way so that the different observations are at opposite ends of the sorted dataset. This process is explained in Section 5.1. Next, a pairwise systematic method takes this sorted dataset to create two clus-ters repeatedly by minimizing information loss and observingk-anonymity. The algorithm is described in Section 5.2.
5.1 Sorting Technique
Before describing the sorting technique, first we consider a simple example. Con-sider Table 1 which consists of two variablesV1andV2. Rank/Index each of the variables in ascending order individually and create a table where the columns indicates thepositionof the value in the original data (Table 1). For example, the first rank (3) of column 1 in Table 2A indicates the position of smallest value of the first variable (1) in Table 1. Similarly, the second (4) and third (2) ranks indicate the positions of second smallest (2) and third lowest (3) values respectively. The second column is also created in the same way. Now sum the positions of each rank. For example, in Table 2B rank 1 comes from the positions of 5throw of first column and 4throw of second column, rank 2 comes from the positions of third row of first column and fifth row of second column and so on, i.e., 1(9),2(8),3(4),4(3),5(6), where first number is the rank and the number in bracket is the sum of the respective positions. The last column is the rank of the sum-values in bracket of the previous column. For example, 4(3) is ranked 1, since 3 is the smallest sum in 9,8,4,3,6. Thus according to this sorting algo-rithm, the first record in the sorted table (see Table 3) should be the 4th row, the second record should be third row of original table in Table 1 and so on. The sorted table is presented in Table 3. The algorithm of this sorting technique is presented in Table 4.
Using the algorithm in Table 5, it is expected that the first record and the last record are more distant and there is zero probability that the first record and the last recorded will be included in the same cluster.
5.2 Pairwise-Systematic microaggregation algorithm
Table 1. Original variable
V1 V2 5 6 3 10 1 3 2 1 4 2
Table 2.A.Rank of sorted values B.Sum of Ranks and final positions
R1 R2 3 4 4 5 2 3 5 1 1 2
Rank Sum R
1(5+4)=1(9) 5 2(3+5)=2(8) 4 3(1+3)=3(4) 2 4(2+1)=4(3) 1 5(4+2)=5(6) 3
Table 3.Sorted variables
V1 V2 2 1 1 3 4 2 3 10 5 6
a systematic way. Based on the information loss measure in equation (1), the sorting algorithm in Table 5 and the definition of the microaggregation problem, the Pairwise-Systematic (P-S) microaggregation algorithm is as follows. Please refer to Kabiret al. [22] for detailed of the algorithm.
According to this method, first sort all records of n in the dataset T in ascending order by using the algorithm in Table 5. Thus in the sorting dataset, the first record and the last record are the most distant to each other among all other pair records in the datasetT. The algorithm (see Table 5) repeatedly builds pair clusters using the first record and the last record in the sorting dataset and their corresponding (k−1) nearest records until fewer than 3k records remain (see steps 2-6 of Table 5). The nearest records in a cluster are chosen in such a way that the inclusion of these records causes less SSE than the other records in the dataset. If between 2kand (3k−1) records remain, then sort these records in ascending order by using the same sorting algorithm in Table 5 and find the first recordf. Form a cluster withf and its (k−1) nearest records, and another cluster with the remaining records (see step 7 of Table 5). Moreover, if fewer than 2krecords remain, then form a new cluster with all remaining records (see step 9 of Table 5).
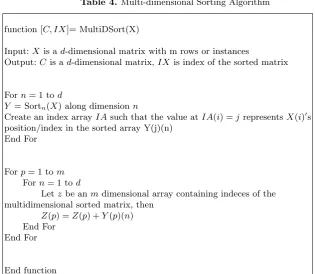
Table 4.Multi-dimensional Sorting Algorithm
function [C, IX]= MultiDSort(X)
Input:X is ad-dimensional matrix with m rows or instances
Output:C is ad-dimensional matrix,IXis index of the sorted matrix
Forn= 1 tod
Y = Sortn(X) along dimensionn
Create an index arrayIAsuch that the value atIA(i) =jrepresentsX(i)′s position/index in the sorted array Y(j)(n)
End For
Forp= 1 tom
Forn= 1 tod
Letz be anmdimensional array containing indeces of the multidimensional sorted matrix, then
Z(p) =Z(p) +Y(p)(n) End For
End For
End function
arranged in ascending order and the first record and the last record are most distant to each other, building clusters in this systematic way, the algorithm easily captures if there are any extreme values in the dataset.
Definition 2 (Systematic clustering-based microaggregation deci-sion problem) In a given datasetT ofnrecords, there is a clustering scheme
G={G1, G2, ..., Gg}such that
1. |Gi |≥ k,1 < k ≤n: the size of each cluster is greater than or equal to a positive integerk, and
2. ∑gi=1IL(Gi)< c, c >0: the total information loss of the clustering scheme is less than a positive integer c.
where each cluster Gi(i= 1,2, ..., p) contains the records that are more similar to each other such that the cluster means are close to the values of the clusters and thus cause the least information loss.
6 Experimental Results
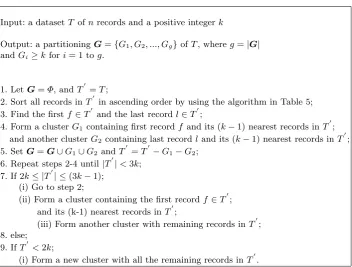
Table 5. P-S microaggregation algorithm
Input: a datasetT ofnrecords and a positive integerk
Output: a partitioningG={G1, G2, ..., Gg}ofT, whereg=|G| andGi≥kfori= 1 tog.
1. LetG=Φ, andT′=T;
2. Sort all records inT′ in ascending order by using the algorithm in Table 5; 3. Find the firstf∈T′ and the last recordl∈T′;
4. Form a clusterG1 containing first recordf and its (k−1) nearest records inT
′
; and another clusterG2 containing last recordland its (k−1) nearest records inT
′
; 5. SetG=G∪G1∪G2 andT
′
=T′−G1−G2; 6. Repeat steps 2-4 until|T′|<3k;
7. If 2k≤ |T′| ≤(3k−1); (i) Go to step 2;
(ii) Form a cluster containing the first recordf∈T′; and its (k-1) nearest records inT′;
(iii) Form another cluster with remaining records inT′; 8. else;
9. IfT′<2k;
(i) Form a new cluster with all the remaining records inT′.
effectiveness of the proposed algorithm in terms of measured information loss of represented cluster data. The following three datasets [9], which have been used as benchmarks in previous studies to evaluate various microaggregation meth-ods, were adopted in the experiments.
1. The “Tarragona” dataset contains 834 records with 13 numerical attributes. 2. The “Census” dataset contains 1,080 records with 13 numerical attributes. 3. The “EIA” dataset contains 4,092 records with 11 numeric attributes (plus
two additional categorical attributes not used here).
Table 6.Information loss comparison using Tarragona dataset
Method k= 3 k= 4 k= 5 k= 10
MDAV-MHM 16.9326 22.4617 33.1923
MD-MHM 16.9829 22.5269 33.1834
CBFS-MHM 16.9714 22.8227 33.2188
NPN-MHM 17.3949 27.0213 40.1831
M-d 16.6300 19.66 24.5000 38.5800
µ-Approx 17.10 20.51 26.04 38.80 TFRP-1 17.228 19.396 22.110 33.186 TFRP-2 16.881 19.181 21.847 33.088 MDAV-1 16.93258762 19.54578612 22.46128236 33.19235838 MDAV-2 16.38261429 19.01314997 22.07965363 33.17932950 DBA-1 20.69948803 23.82761456 26.00129826 35.39295837 DBA-2 16.15265063 22.67107728 25.45039236 34.80675148
[image:13.595.149.466.297.454.2]Multi-DSort 9.8572 11.9989 18.17 32.1338
Table 7.Information loss comparison using Census dataset
Method k= 3 k= 4 k= 5 k= 10
MDAV-MHM 5.6523 9.0870 14.2239
MD-MHM 5.69724 8.98594 14.3965
CBFS-MHM 5.6734 8.8942 13.8925
NPN-MHM 6.3498 11.3443 18.7335
M-d 6.1100 8.24 10.3000 17.1700
µ-Approx 6.25 8.47 10.78 17.01
TFRP-1 5.931 7.880 9.357 14.442
TFRP-2 5.803 7.638 8.980 13.959
MDAV-1 5.692186279 7.494699833 9.088435498 14.15593043 MDAV-2 5.656049371 7.409645342 9.012389597 13.94411775 DBA-1 6.144855154 9.127883805 10.84218735 15.78549732 DBA-2 5.581605762 7.591307664 9.046162117 13.52140518
Multi-DSort 2.0954 3.6254 3.4595 6.8497
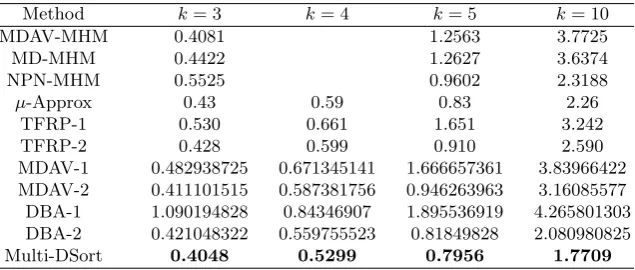
Table 8.Information loss comparison using EIA dataset
Method k= 3 k= 4 k= 5 k= 10
MDAV-MHM 0.4081 1.2563 3.7725
MD-MHM 0.4422 1.2627 3.6374
NPN-MHM 0.5525 0.9602 2.3188
µ-Approx 0.43 0.59 0.83 2.26
TFRP-1 0.530 0.661 1.651 3.242
TFRP-2 0.428 0.599 0.910 2.590
MDAV-1 0.482938725 0.671345141 1.666657361 3.83966422 MDAV-2 0.411101515 0.587381756 0.946263963 3.16085577 DBA-1 1.090194828 0.84346907 1.895536919 4.265801303 DBA-2 0.421048322 0.559755523 0.81849828 2.080980825
[image:13.595.150.468.482.617.2]3 4 5 10 0
5 10 15 20 25 30 35
K
Information Loss (%)
[image:14.595.162.444.109.337.2]Tarragona Census EIA
Fig. 2. Information Loss vskfor Tarragona, Census, and EIA datasets
834 data 1080 data
4092 data K=3
K=4
K=5
K=10 0
50 100 150 200 250 300
data instances
Execution Time (sec)
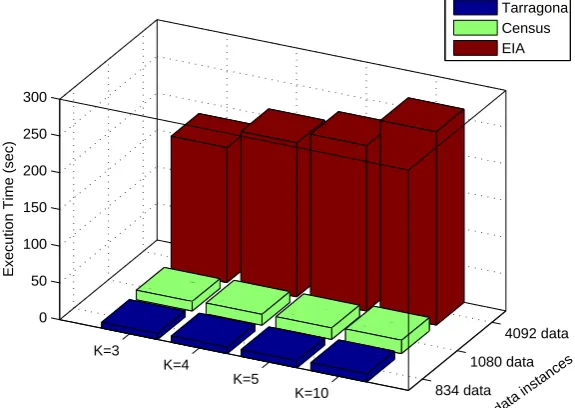
Tarragona Census EIA
[image:14.595.172.460.380.584.2]and TRFP-2 respectively. The TFRP-2 is similar to the DBA-2 but disallows merging a record to a group of size over (4k−1).
Tables 6-8 show the information loss for several values ofkand the Tarragona, Census and for the EIA datasets respectively. The information loss is compared with the proposed algorithm among the latest microaggregation methods listed above. Information loss is measured as SSESST ×100, where SST is the total sum of the squares of the dataset. Note that the within-groups sum of squares SSE is never greater than SST so that the reported information loss measure takes values in the range [0,100]. Tables 6-8 illustrate that in all of the test situations, the proposed algorithm causes significantly less information loss than any of the microaggregation methods listed in the table. This shows the utility and the effectiveness of the proposed algorithm.
Analysis:Figure 2 shows how the information loss values changes withkfor each dataset. Results indicate that information loss increases with k. This is obvious since the higher number of records in each cluster results in higher sum-of-squared-error (SSE) values due to the fact that each cluster now has more observations and possibly larger variance. Interestingly, there is little correlation between overall information loss of a dataset and its size as evident from the fact that the information loss for CIA dataset (containing 4092 instances) is much lower than the information loss for Tarragona dataset (containing 1082 instances). This may be due to the lower variance in EIA dataset resulting in clusters with lower SSE, hence lower information loss.
Figure 3 shows the how the execution time varies withk and different file sizes. Again, results show that the execution time depends on the value of k. It shows that the execution time increases slightly due to the increased number of permutations that need to be calculated for each cluster for the higher k. Furthermore, as expected the execution is also related to the file size. As shown in Figure 3 it takes the longest time to findk-anonymous clusters for the EIA dataset (4092 instances) and quickest time for the census dataset (834 instances).
7 Conclusion
show that the proposed algorithm outperforms all the tested microaggregation methods with respect to information loss. Thus the proposed method is very effective in preserving the privacy microdata sets and can be used as an effective privacy preservingk-anonymization method for Statistical Disclosure Control.
References
1. Bezdek, J.C.: Pattern recognition with fuzzy objective function algorithms. Aca-demic Publishers, Norwell (1981).
2. Domingo-Ferrer, J., Torra, V.: Privacy in data mining. Data Mining and Knowledge Discovery. 11 (2), 117–119 (2005)
3. Domingo-Ferrer, J., Mateo-Sanz, J.: Practical data-oriented microaggregation for statistical disclosure control. IEEE Transactions on Knowledge and Data Engineer-ing. 14(1), 189-201 (2002)
4. Domingo-Ferrer, J., Torra, V.: Extending microaggregation procedures using de-fuzzification methods for categorical variables. In: 1st international IEEE sympo-sium on intelligent systems, pp. 44–49. Verna (2002)
5. May, P., Ehrlich, H.C., Steinke, T.: ZIB Structure Prediction Pipeline: Composing a Complex Biological Workflow through Web Services. In: Nagel, W.E., Walter, W.V., Lehner, W. (eds.) Euro-Par 2006. LNCS, vol. 4128, pp. 1148–1158. Springer, Heidelberg (2006)
6. Domingo-Ferrer, J., Torra, V.: Towards fuzzyc-means based microaggregation. In: Grzegorzewski, P., Hryniewicz, O., Gil, A. (eds.) Soft methods in probability, statis-tics and data analysis. Advances in soft computing, vol. 16, pp. 289-294. Heidelberg: Physica-Verlag (2002)
7. Domingo-Ferrer, J. and Torra, V.: Fuzzy microaggregation for microdata protection. Journal of Advanced Computational Intelligence and Intelligent Informatics. 7(2), 153-159 (2003)
8. Domingo-Ferrer, J., Torra, V.: Ordinal, continuous and heterogeneous kanonymity through microaggregation. Data Mining and Knowledge Discovery. 11(2), 195-212 (2005)
9. Domingo-Ferrer, J., Martinez-Balleste, A., Mateo-Sanz, J.M., Sebe, F.: Efficient multivariate data-oriented microaggregation. The VLDB Journal. 15(4), 355-369 (2006)
10. Domingo-Ferrer, J., Sebe, F., Solanas, A.: A polynomial-time approximation to optimal multivariate microaggregation. Computer and Mathematics with Applica-tions. 55(4), 714-732 (2008)
11. Han, J.-M., Cen, T.,-T., Yu, H.-Q., Yu, J.: A multivariate immune clonal selection microaggregation algorithm. IEEE international conference on granular computing. pp. 252–256. Hangzhou (2008)
12. Hansen, S., Mukherjee, S.: A polynomial algorithm for optimal univariate microag-gregation. IEEE Transactions on Knowledge and Data Engineering. 15(4), 1043-1044 (2003)
13. Laszlo, M., Mukherjee, S.: Minimum spanning tree partitioning algorithm for mi-croaggregation. IEEE Transactions on Knowledge and Data Engineering. 17(7), 902-911 (2005)
15. Solanas, A.: Privacy protection with genetic algorithms. In: Yang, A. Shan, Y., Bui, L.T. (eds.) Success in evolutionary computation. Studies in Computional In-telligence, vol. 92, pp. 215-237. Heidelberg: Springer (2008)
16. Solanas, A., Martinez-Balleste, A., Domingo-Ferrer, J.:V−M DAV: A multivariate microaggregation with variable group size. In: 17th COMPSTAT Symposium of the IASC. Rome (2006).
17. Samarati, P.: Protecting respondent’s privacy in microdata release. IEEE Trans-actions on Knowledge and Data Engineering. 13(6), 1010–1027 (2001)
18. Sweeney, L.:k-Anonymity: A model for protecting privacy. International Journal on Uncertainty, Fuzziness and Knowledge-based Systems. 10(5), 557-570 (2002) 19. Torra, V.: Microaggregation for categorical variables: A median based approach.
In: Domingo-Ferrer, J., Torra, V. (eds.)PSD 2004. LNCS, vol. 3050, pp. 162-174. Heidelberg: Springer , (2004)
20. Kabir, M.E., Wang,H.: Systematic Clustering-based Microaggregation for Statisti-cal Disclosure Control. In: IEEE International Conference on Network and System Security, pp. 435-441, Melbourne (2010)
21. Kabir, M.E., Wang, H., Bertino, E., Chi, Y.: Systematic Clustering Method forl -diversity Model. In Australasian Database Conference, pp. 93-102, Brisbane (2010) 22. Kabir, M.E., Wang, H., Zhang, Y.: A Pairwise-Systematic Microaggregation for Statistical Disclosure Control. In IEEE International Conference on Data Mining, pp. 266–273, Sydney (2010)
23. Kabir, M.E., Wang, H.: Microdata Protection Method Through Microaggragation: A Median Based Approach. Information Security Journal: A Global Perspective, 20(1), 1–8 (2011)
24. Ward, J.H.J.: Hierarchical grouping to optimize an objective function. Journal of the American Statistical Association, 58 (301), 236-244 (1963)
25. Wang, H., Zhang, Y., Cao, J.: Effective collaboration with information sharing in virtual universities. IEEE Transactions on Knowledge and Data Engineering, 21(6), 840–853 (2009)
26. Willenborg, L., Waal, T.D.: Elements of statistical disclosure control. Lecture notes in statistics. 155 (2001)
27. Zahn, C.T.: Graph-theoretical methods for detecting and describing gestalt clus-ters. IEEE Transactions on Computers,C-20 (1), 68-86 (1971).
28. Chang, C.-C., Li, Y.-C., Huang, W.-H.: TFRP: An efficient microaggregation al-gorithm for statistical disclosure control. Journal of Systems and Software, 80 (11), 1866–1878 (2007)