University Of Southern Queensland
Faculty of Engineering and Surveying
LOCOMOTIVE COOLING SYSTEM STRATEGY
OPTIMISATION
A Dissertation submitted by
Mr Mark Windebank
In fulfilment of the requirements of
Bachelor of Engineering (Mechanical)
i
Abstract
This report analyses the coolant management practices and procedures implemented at rail maintenance facilities to maintain the quality of coolants used in the GE Evolution and Dash 9 Series locomotives. Key motivations for the work conducted in this analysis include the
identification of sediment observed in locomotive coolant samples and investigation into radiator core failure. In the conduct of the analysis experimental data validated the implementation of a method to determine the nitrite based corrosion inhibitor concentration through measurement of the electrical conductivity. Further experimentation confirmed that research identifying a minimum concentration of nitrite corrosion inhibitor of 500 ppm as adequate for effective inhibition could be applied as a reference minimum concentration for the corrosion inhibitor package to inhibit corrosion over the variety of metals that comprise the locomotive cooling system. Investigation into conclusions previously made as to the cause of radiator core failure in the locomotive have been determined to be
ii
Disclaimer
University of Southern Queensland
Faculty of Health, Engineering and Sciences
ENG4111 Research Project Part 1
ENG4112 Research Project Part 2
Limitations of Use
The Council of the University of Southern Queensland, its Faculty of Health, Engineering & Sciences, and the staff of the University of Southern Queensland, do not accept any responsibility for the truth, accuracy or completeness of material contained within or associated with this dissertation.
Persons using all or any part of this material do so at their own risk, and not at the risk of the Council of the University of Southern Queensland, its Faculty of Health, Engineering & Sciences or the staff of the University of Southern Queensland.
iii
Certification of Dissertation
I certify that the ideas, designs and experimental work, results, analyses and conclusions set out in this dissertation are entirely my own effort, except where otherwise indicated and acknowledged.
I further certify that the work is original and has not been previously submitted for assessment in any other course or institution, except where specifically stated.
Mark Windebank
Student Number 0061012351
__________________________ Signature
iv
Acknowledgments
Assistance in the completion of this project is thankfully acknowledged.
Mr John McArthur of Rio Tinto for identifying the initial project
requirement and providing the benefit of experience and material support.
v
Table of Contents
Abstract i
Disclaimer ii
Certification of Dissertation iii
Acknowledgments iv
List of Figures ix
List of Tables x
Nomenclature xi
Glossary of Terms xiii
Chapter 1 Introduction 1
1. 3 Expected Outcomes 2
1. 4 Safety 3
Chapter 2 Literature Review 4
2. 1 RTIO Locomotive Fleet 4
2. 2 Closed Cooling Systems 4
2. 3 Corrosion 6
2. 3. 1 The Corrosion Reaction 6
2. 3. 2 Galvanic Corrosion 8
2. 3. 3 Pitting 10
2. 3. 4 Cavitation 11
2. 3. 5 Particle Erosion and Erosion Corrosion 12
2. 3. 6 Crevice Corrosion 13
2. 3. 7 Stress Corrosion Cracking 14
2. 3. 8 Microbial Influenced Corrosion 15
2. 3. 9 Dealloying 16
2. 4 Corrosion Inhibitors 17
2. 4. 1 Nitrites 18
2. 4. 2 Azoles 18
2. 5 Debris 19
2. 5. 1 Spectrochemical Analysis 19
2. 5. 2 Particle Quantifier (PQ) Index 20
2. 6 Coolant 20
2. 6. 1 Water 20
vi
Chapter 3 Radiator Core Failure 23
3. 1 Background Information 23
3. 2 Analysis 24
3. 2. 1 pH 25
3. 2. 2 Nitrite 25
3. 2. 3 Ammonia 26
3. 2. 4 Azoles 26
3. 2. 5 Material Degradation 26
3. 3 Conclusions 27
Chapter 4 Bulk coolant mixing 29
4. 1 Current Process 29
4. 2 Coolant Mixing Procedure 30
Chapter 5 Coolant Monitoring 31
5. 1 Inhibitor Concentration Testing 31
5. 2 Coolant Condition Monitoring 32
5. 2. 1 Spectrochemical analysis 32
5. 2. 2 PQ Index 33
5. 2. 3 pH 33
5. 2. 4 Colour 33
5. 2. 5 Odour 34
5. 2. 6 Nitrite 34
5. 2. 7 Conductivity 35
5. 2. 8 Visual Debris 36
5. 3 Coolant Contaminants 37
5. 3. 1 Potential Sources of Contaminant 37
5. 3. 2 Monitoring Frequency 39
Chapter 6 Effect of Inhibitor Concentrations 40
6. 1 Experimental Method 40
6. 1. 1 Metal test Specimens 40
6. 1. 2 Corrosion Inhibitor Concentrations 41
6. 1. 3 Experiment Results 41
6. 1. 4 Conclusions 42
Chapter 7 Inhibitor Concentration Testing 44
7. 1 Current Inhibitor Concentration Test Method 44
vii
7. 1. 2 Key Concerns 46
7. 1. 3 Suitability 46
7. 2 Alternative Coolant Sampling Methods 47
7. 2. 1 Electrical Conductivity 47
7. 2. 2 Electrical Conductivity Test Units 49
7. 2. 3 Visual Colour Comparison 50
7. 3 Experiment 50
7. 3. 1 Results 50
7. 4 Conclusions 51
Chapter 8 Coolant Reclamation 53
8. 1 Analysis 53
8. 2 Improvements 54
Chapter 9 Contaminant Removal 55
9. 1 Locomotive Located Filtration 55
9. 2 Reclamation Tank Located Filtration 56
9. 3 Filtration Type 56
9. 3. 1 Solid Medium Filtration 56
9. 3. 2 Magnetic Filtration 58
9. 3. 3 Pore Size 58
Chapter 10 Recommendations 59
10. 1 Radiator Core Failure 59
10. 2 Coolant Management 59
Chapter 11 References 62
Project Specification 66
Locomotive 8125 Report Extract 68
Experiment for Effect of Corrosion Inhibitor
Concentration on Corrosion Rates 70
C.1 Experiment to Determine Levels of Corrosion Relative to
Coolant Concentration 70
C.2 Procedure 77
C.3 Results 78
Nitrite Concentration Relationship Graphs 79 Experiment for Methods of Determining Coolant
Concentration 83
E.1 Experiment Method 83
viii Recommended Corrosion Inhibitor Concentration Testing
Procedure 97
Experiment for Comparison of Coolants Corrosion
Inhibition 104
Material Compositions 105
H.1 Compositions 105
Accuracy and Equipment Error 110
I.1 Class A, 50 mL Burette 110
I.2 Thermometer 111
I.3 Scales 111
Risk Assessment 112
ix
List of Figures
Figure 2-1 Galvanic corrosion of steel pipe in a brass fitting 9
Figure 2-2 Pitting corrosion in a metal 10
Figure 2-3 Cavitation on a cylinder liner 11
Figure 2-4 Particle erosion in pipe bend 12
Figure 2-5 Particle erosion in tube inserts 13
Figure 2-6 Typical result of Microbial Corrosion 16 Figure 3-1 Radiator core removed from locomotive 8125 24 Figure 3-2 Enlarged section of the radiator cores 24 Figure 3-3 Longitudinal Stress Corrosion Cracking 27 Figure 3-4 Circumferential Stress Corrosion Cracking 27 Figure 4-1 ALS Generated Trend Analysis of Bulk Coolant Nitrite
Concentration 30
Figure 5-1 Coolant Samples 33
Figure 5-2 Evolution series sampling point 36
Figure 7-1 Locomotive Coolant Sampling Locations 44 Figure 7-2 Nitrite Concentration vs Electrical Conductivity 48 Figure 7-3 Nitrite Concentration Testing Results 52
Figure 8-1 Reclamation Tank 53
Figure 8-2 Reclamation Tank Coolant Sample 54
Figure 9-1 Coolant Tank Sight Glass 55
Figure 9-2 Cape Lambert Coolant Filtration System 57
Figure 9-3 Magnetic Trap Section 57
Figure B- 1 Coolant Analysis for 8125 supplied to Rio Tinto 68 Figure B- 2 Coolant Analysis for 8125 Conducted by Rio Tinto 69
Figure C- 1 Equipment Configuration 73
Figure C- 2 Test and Support Coupon Dimensions 75
Figure C- 3 Metal Specimen Arrangement 75
Figure D- 1 Nitrite Concentration vs Conductivity 79
Figure D- 2 TDS Concentration vs Conductivity 80
x
List of Tables
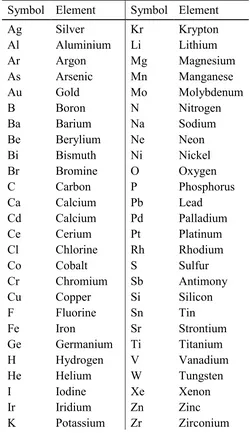
Table 1 Selected Elemental Symbols by Alphabetical Order xii
Table 2 Cooling System Component Materials 5
Table 3 Galvanic Series 9
Table 4 Spectrochemical Data Elemets (ALS 2010) 19 Table 5: Maximum Contaminant Levels in Raw Water 21
Table 6 Molar Masses 22
Table 7 Acceptable Range 32
Table 8 Nalco Recommended Contaminant Levels 38
Table 9 Sources of Elements in Cooling Systems 38 Table 10 Relationship of Elements to Components 38
Table 11 Allowable Material Weight Loss 41
Table 12 Coupon Weight Losses 42
Table 13 Coefficients of Determination 51
Table C- 1 Allowable Coupon Weight Losses 77
Table C- 2 Recorded Coupon Weight Losses 78
Table D- 1 Representative Sample Data 82
Table E- 1 Mixing Volumes for Coolant Samples 87
Table E- 2 Nitrite Concentration Values 91
Table E- 3 Total Square of Residuals 95
Table E- 4 Total Spread of Data 95
Table E- 5 Coefficients of Determination 96
xi
Nomenclature
Where appropriate SI units have been used within this dissertation.
Term Definition
cm Centimetre
mg/L Milligrams per litre ppm Parts per million
μ Mu – micro [x 106]
S Siemens
xii
Table 1 Selected Elemental Symbols by Alphabetical Order
Symbol Element Symbol Element
Ag Silver Kr Krypton
Al Aluminium Li Lithium
Ar Argon Mg Magnesium
As Arsenic Mn Manganese
Au Gold Mo Molybdenum
B Boron N Nitrogen
Ba Barium Na Sodium
Be Berylium Ne Neon
Bi Bismuth Ni Nickel
Br Bromine O Oxygen
C Carbon P Phosphorus
Ca Calcium Pb Lead
Cd Calcium Pd Palladium
Ce Cerium Pt Platinum
Cl Chlorine Rh Rhodium
Co Cobalt S Sulfur
Cr Chromium Sb Antimony
Cu Copper Si Silicon
F Fluorine Sn Tin
Fe Iron Sr Strontium
Ge Germanium Ti Titanium
H Hydrogen V Vanadium
He Helium W Tungsten
I Iodine Xe Xenon
Ir Iridium Zn Zinc
xiii
Glossary of Terms
Term Definition
AC Alternating Current
DC Direct Current
EC Electrical Conductivity GE
Nitrate
General Electrics
The negative ion consisting of one nitrogen atom and three oxygen atoms. .
Nitrite The negative ion consisting of one nitrogen atom and two oxygen atoms. .
OEM Original Equipment Manufacturer
pH Power of Hydrogen: The measure of the acidity or basicity of a solution.
PQ Index Particle Quantifier Index: The total amount of magnetisable iron.
RTIO Rio Tinto Iron Ore.
Sodium Nitrite The ionic compound. . SI Systeme International
TDS Total Dissolved Solids
1
Chapter 1
Introduction
The purpose of this project is to investigate aspects of the engine coolant used in Rio Tinto Iron Ore (RTIO) diesel electric locomotives and processes managing that coolant. The locomotives operated by RTIO are the General Electric (GE) Evolution and Dash 9 series diesel electric locomotives which run exclusively on their Pilbara rail network.
There have been concerns raised relative to the cooling systems of these locomotives and the coolant used in them. The broad aim of the project is to analyse these concerns and, where appropriate, identify and recommend actions to address those concerns.
1. 1 Initial Concerns
The initial concerns raised relative to the locomotive cooling system and the coolant used are detailed below:
RTIO have identified issues in ensuring the coolant that is to be used in the locomotives is consistently mixed to the correct
concentrations. No clear methodology exists for the mixing process.
The routine coolant samples taken from the RTIO locomotive fleet contain an unknown debris which has a magnetic characteristic.
The OEM (Original Equipment Manufacturer) has recommended RTIO change coolants to variety with a higher “azole” content. Azole is the family name given to a group of compounds that have a use in corrosion protection for copper and materials containing copper.
The current process of sampling coolants includes an analysis carried out by an independent laboratory. There is currently no procedure that references or responds to the reports and alarms raised through the results of the laboratory testing.
The alarm limits defined for use by the independent laboratory appear inconsistent with the OEM requirements for concentration levels of the coolant mix.
A radiator core has shown evidence of erosion, information and anecdotal advice indicates this may be caused by a design fault or an excessive level of ammonia in the coolant. The belief is that the ammonia may be due to organic decomposition or excessive heat sources in the cooling system.
2
1. 2 Research Objectives
The project plans to address the initial concerns through experimentation, research, independent testing and consultation with external agencies. The objectives, summarised below, are detailed Project Specification, supplied in Annex A.
Carry out a literature review for relative information on coolants and cooling systems pertaining to the initial concerns listed above in respect to their use.
Review RTIO’s current coolant sampling process.
Determine the suitability of RTIO’s current sampling process.
Determine suitable coolant testing alarm limits for the RTIO locomotive fleet.
Develop and implement a coolant sampling procedure.
Review the coolant reclamation process and determine its suitability.
Identify and recommend any improvements to the coolant reclamation process and/or equipment.
Identify any contaminants in the coolant
Identify the source of any contaminants in the coolant.
Determine the acceptable levels of contamination allowable in the coolant.
Identify and recommend a method to remove contamination from the coolant.
Examine radiator cores and assess any erosion evident.
Determine the cause of any erosion detected.
Conduct a comparison of coolants available for use and recommend changes as appropriate.
1. 3 Expected Outcomes
The outcomes of this research project are expected to assist Rio Tinto Iron Ore in managing and maintaining their locomotives. The particular
objectives addressed will provide guidance on the optimal coolant variety for use, preparation of coolant for use, sampling methods and management of the coolant whilst in use, and disposal of coolant on the conclusion of its useful life.
3
1. 4 Safety
Through the conduct of this research project, occupational hazards have been encountered and risk control measures were implemented to mitigate the risk of these hazards.
The nature of the rail transport industry presents a number of hazards in and around the maintenance workshop facility and further hazards have been introduced due to the environment and location of the workshop facility. The risks associated with these hazards have been addressed by Rio Tinto Iron Ore personnel and appropriate control measures have been
implemented and identified in their general and site specific safety
inductions. Completion of, and compliance with, these inductions is deemed the minimum level of safety required for tasks in this project that have been carried out in the workshop location. For reference, these inductions are held by Rio Tinto and are delivered as required.
In the conduct of the research and experiments described in this report, there has been a requirement to handle hazardous chemicals. In the interests of health and safety a risk assessment has been conducted and has been supplied in Appendix J This risk assessment identifies the hazards associated with the materials described in Appendix K and describes the control measures applied. The control measures applied are in compliance with the section 8, Exposure Controls/Personal Protection, of the respective MSDS’s, the Occupational Safety and Health Act 1984 (WA) and its subsequent legislation, and the code of practice Managing Risks of Hazardous Chemicals in the Workplace (Safe Work Australia 2012).
4
Chapter 2
Literature Review
This chapter will review literature to further understand the use, application, and management of coolants in diesel engines and determine possibilities for improvements in the practices and procedures conducted by RTIO.
2. 1 RTIO Locomotive Fleet
Rio Tinto Iron Ore (RTIO) primarily utilise two types of GE locomotives, the 9-44CW locomotive (referred to colloquially as the Dash 9) and the ES44DCi locomotive (referred to as the Evo). A third type, an AC version of the Evo, is now being introduced into the fleet. At the time of writing, the RTIO fleet consists of 72 Dash 9’s and 106 Evo’s.
All three types of locomotives utilise a diesel engine as a generator to produce electrical energy which is then supplied to the electric traction motors mounted to the locomotive’s axles. These diesel engines rely on closed cooling systems to transfer excess heat energy from the motor to the surrounding environment to maintain the optimal operating temperature for the engine.
2. 2 Closed Cooling Systems
In analysing the modes of heat dissipation to the environment, Mollenhauer and Tschoeke (2010) and Avallone, Baumeister and Sadegh (2007) agree that approximately 30 % of heat energy created is transferred directly to the environment in exhaust gases. The remaining heat energy is dissipated through the engine components, with the predominate portion via some form of cooling system. It is noted that a small portion of heat is transferred from the engine components through conduction and radiation, however, the combined rate of heat transfer by these modes is negligible in comparison to the rate of heat transfer by convection within the cooling system. Thus the cooling system plays a significant role in maintaining optimal engine temperatures.
5 closed circuit type of cooling system as used in the locomotives operated by Rio Tinto. All of the OEM recommended coolants (Curtin 2013; GE
Transportation 2012) for these locomotive models use a water based coolant. Curtin (2013) details the component materials and their respective surface contact areas with the water based coolant, shown in Error! Reference source not found. (chemical compositions for these materials are listed in Appendix F ).
As identified by Lazroff (2009) and Mollenhauer and Tschoke (2010), and Gershun and Woyciesjes (2003), water is the typical base component of the fluid used in the cooling systems. Whilst the use of water is convenient in supply and has very good characteristics for transferring heat, its electrolytic capacity increases the concern of corrosion in the metal cooling system components.
Table 2 Cooling System Component Materials
* Engine components may contain one or more of the following:
Ductile or grey cast, compacted graphite, or vermicular iron ASTM 1030 carbon steel
PTFE hose (Sae 100R14A)
Component Material Coolant Velocity
(m/s)
Surface Area
(m2)
All coolant pipes in radiator cabinet, tanks,
intercoolers
Steel (ASTM A53, A513,
AISI 1020 B4A9B2) <6 14.3
Plate Oil Cooler SS (AISI 316, 304)
Copper (CDA 122) <3 43.6
Shell & Tube Oil Cooler B50E183A (C12200) <2.4 52
Engine * 0 - 3 30
Other Intercoolers Cu/Ni 90/10 (C70600) <2.4 4.7
Radiator Cores
Red brass (C23000) Yellow Brass (UNS C26000, C26800,
C85200)
<1.8 72
6
2. 3 Corrosion
Callister (2007) defines corrosion as a destructive and unintentional attack on a metal. It may be noted that in some applications such as electroplating, the corrosive process may have desirable effects however, in respect to cooling systems occurrences of corrosion are typically considered to be detrimental. Particular to their cooling systems, GE (2014) describe corrosion as the destruction of a metal by chemical or electrochemical reaction with its environment, being the coolant and other metals. Marcus (2003) defines aqueous corrosion as an environment in which metal is exposed to a liquid electrolyte, being an accurate description of the typical cooling system.
Whilst the process of corrosion can be detailed by a series of common reactions, Gellings (1985) divides corrosion types as either a uniform, predictable corrosion over an entire surface or a localised attack. This localised attack is of more concern, of which Gershun and Woyciesjes (2003) identify galvanic, crevice, erosion, pitting and cavitation among the various forms that may occur in cooling systems.
2. 3. 1 The Corrosion Reaction
Callister (2007) and Askeland and Phule (2008) both describe a generalised corrosion equation for metals, Equation 1 called oxidation which occurs at the anode. In the oxidation process the anode metal gives up electrons and becomes a positive ion of the original anodic metal, with a charge
magnitude equal to the number of electrons given up by the metal atom.
This oxidation process is balanced with an equivalent reduction reaction, Equation 2, in which the opposing process occurs with the cathode material taking up electrons to become a negative ion of the original cathode
material. This negative ion’s charge is also of a magnitude equal to the number of electrons taken up by the metal ion. The balancing factor between these reactions is the number of electrons given must equal the number taken in.
7 Protopopoff and Marcus (2005) shows the neutral metal atom as a solid state and the positively charged ion in an aqueous solution, being in solution the ion has the ability to be drawn toward a negative charge.
In cases where corrosion may be unavoidable, an ideal system would have oxidation and reduction occurring uniformly throughout the metal providing the longest, and most predictable, service life for the component. In
practical systems, localised factors will encourage corrosion at particular locations within the systems.
In Equations 1 and 2, the reactions only involve the metals and transfer of electrons and their ions. In this instance the electrolyte is simply a means for the transportation of the positive ions, however, under certain conditions water may also undergo the reduction process, shown in Equation 3. When this reduction of water occurs, the positive ion created through the oxidation process combines with the negative hydroxide ion to form an insoluble compound which precipitates to from a sediment in the coolant. An example of this process (Callister 2007) is detailed in Equations 4 through 7, note that the term brackets indicates the state of the element or compound.
Equation 1 Oxidation reaction for metal
n M M ne
Equation 2 Reduction reaction for metal
n
M ne M
Equation 3: Cathodic reduction of deaerated water
2 2
2H O 2e H 2OH
Equation 4 Oxidation of Iron
2 ( )s (aq) 2
Fe Fe e
Equation 5 Formation of Ferrous Hydroxide (in deaerated water)
2
2
s aq
Fe OH Fe OH
8
Equation 6 Formation of Magnetite (black oxide)
2 3 4 2 2
3 s 2
aq
Fe OH Fe O H H O
Equation 7 Formation Ferric Oxide (red oxide / rust)
3 4 2 2 3
2Fe O s O 3Fe O s
Equations 4 to 6 detail the procession of chemical reactions within the cooling system from the iron element in the material of the cooling system component through to a magnetite sediment in the coolant. The formation of magnetite (black oxide) occurs due to the closed cooling system providing a deaerated, or low oxygen, environment. An important factor of magnetite is that it has strong magnetic properties.
Equation 7 details the final chemical reaction in which magnetite, exposed to oxygen, forms ferric oxide. Ferric oxide is the red iron oxide commonly known as rust, is non-magnetic.
2. 3. 2 Galvanic Corrosion
9
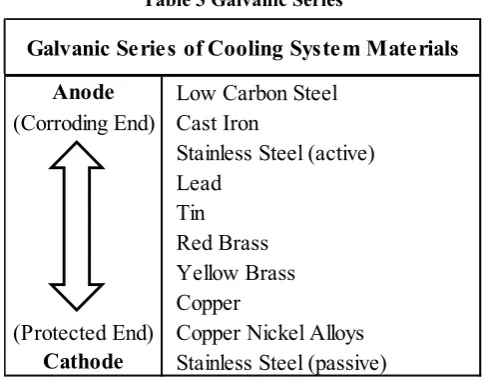
Table 3 Galvanic Series
The rate of galvanic corrosion is influenced by factors such as surface areas and separation distance. Where the surface area ratio of the anode material is large in comparison to the surface area of the cathode, the potential to produce an electrical current is reduced and galvanic corrosion is
minimised. Similarly this form of corrosion is minimised as the distance between the anode and cathode increases.
[image:23.595.197.398.532.679.2]Figure 2-1, extracted from Baboian (2003), illustrates galvanic corrosion occurring at a steel and brass coupling. This photo shows material of the steel pipe, being more active on the galvanic series than the brass fitting, has been consumed while the brass remains intact. This is an easily identifiable trait distinctive to galvanic corrosion.
Figure 2-1 Galvanic corrosion of steel pipe in a brass fitting (Baboian 2003)
Anode Low Carbon Steel (Corroding End) Cast Iron
Stainless Steel (active) Lead
Tin Red Brass Yellow Brass Copper
(Protected End) Copper Nickel Alloys Cathode Stainless Steel (passive)
10 Cathodic protection is a widely recognised technique to prevent a specific metal corroding. By electrically connecting a more anodic sacrificial material to a particular component the galvanic couple is arranged to preserve the cathode metal whilst the sacrificial anode is consumed.
2. 3. 3 Pitting
In Table 3, stainless steel has been listed separately as an active and a passive variant with very different galvanic properties. Kruger (2003) provides the distinction between the two variants in that a passive metal is one that has developed a thin corrosion resistant film over its surface where an active metal has not. Callister (2007) postulates this corrosion resistant film is produced through the active surface of the material forming a very thin, highly adherent oxide barrier. The normally active nature of the metal is reduced as this oxide barrier is far more reluctant to form positive ions. As this film is very thin, surface damage to the material will likely penetrate this passive layer to expose the active material underneath, in effect
exposing two dissimilar, electrically connected metals to the electrolyte. Frankel (2003) defines this form of localised corrosive attack on the
damaged surface of a passive filmed material as pitting, illustrated in Figure 2-2.
[image:24.595.236.359.574.703.2]Classical pitting will only occur in the presence of highly active metals, typically in the presence of chloride ions, the severity of the pitting tend to vary with the concentration of these ions (Frankel 2003). Frankel also lists temperature as a critical factor in the formation of pitting as many materials will not form pits under a certain temperature.
11 In contrast to pit initiation through the presence of chloride ions and
increased temperatures, Debaun and Alverson (2008) and Askeland and Phule (2008) describe pitting as corrosion initiating from erosion to the surface protection, exposing underlying material, caused through localised cavitation. Gellings (1985) suggests that pitting may be initiated through either mechanical damage or environmental conditions, categorising pitting by the formation, and continued growth, of an active-passive-element in the surface of a metal.
It is a consensus amongst these authors that once pitting has commenced, local conditions are altered in a manner that promotes pit growth through further corrosion highlighting the importance in preventing pitting from initiating.
2. 3. 4 Cavitation
[image:25.595.208.390.538.690.2]Whilst cavitation has been suggested as a precursor to pitting corrosion, Glaser and Wright (2003) and Gellings (2003) also describe the mechanical erosion impact of its occurrence. Cavitation is defined as the formation, and rapid collapse, of vapour bubbles in a fluid. The pressures created through the repeated collapse of these vapour bubbles cause localized deformation and cratering of the metal surface. Continued creation of these pits from ongoing cavitation eventually causes particle removal from the material, as shown in Figure 2-3. This process may be facilitated through corrosive attack in locations where cavitation has enabled pitting through removal of the corrosion resistant surface film.
12 The cavitation that occurs in a cooling system is caused by localised low pressure regions created through rapid surface vibrations (Debaun and Alverson 2008). Gershun and Woyciesjes (2003) state that cavitation may also occur by formation of vapour bubbles at high temperature points which rapidly collapse when the temperature decreases. It would be logical to assume that cavitation in cooling systems would likely occur as a result of a combination of these two conditions. Glaeser and Wright (2003) highlight the engine cylinder liners, heat-exchanger inlet tubes, and pumps as likely areas in which cavitation may occur in a cooling system.
2. 3. 5 Particle Erosion and Erosion Corrosion
Erosion in a cooling system may defined as the removal of surface material by the action of numerous solid or liquid particle impacts (Glaeser and Wright 2003). Although similar to cavitation in effect on the material, where cavitation produces microcraters, Figure 2-4, particle erosion produces imprints of the impacting particles (Glaeser and Wright 2003). Callister (2007) indicates that this form of corrosion may be identified by surface grooves, or waves, characteristic of the fluid flow as illustrated in Figure 2-4.
[image:26.595.174.421.561.681.2]Conditions that may encourage particle erosion typically involve large amounts of entrained solid particles with high velocities and/or abrupt changes in the direction of fluid flow. In particular, abrupt changes in fluid flow may lead to the concentration of eroding particles and the subsequent focused particle erosion as shown in Figure 2-5.
Figure 2-4 Particle erosion in pipe bend (Gellings 1985)
13
Figure 2-5 Particle erosion in tube inserts (Glaeser and Wright 2003)
Debaun and Alverson (2008) and Callister (2007) that erosion corrosion is more prevalent in softer metals where fluid motion shear forces, abrasive contaminants, and cavitation may cause the metals protective coating to break away exposing the underlying material to corrosion. This agrees with Boffardi (2003), who states that erosion corrosion is normally restricted to copper base alloys. Boffardi also describes the phenomenon of inlet-end erosion corrosion as a result of the higher turbulence at the pipe entrance. As shown in Figure 2-5, inlet-end erosion corrosion produces a horseshoe shaped pattern extending away from the inlet, typically a short distance for the pipe entrance.
2. 3. 6 Crevice Corrosion
Crevice corrosion, as described by Gershun and Woyciesjes (2003) and Kelly (2003), is localised in areas of stagnated fluid flow. The mechanism initiating the corrosive attack is the change in ion concentration in the electrolyte solution between two regions of the same material (Callister 2007). This potential difference creates a concentration cell, through transfer of electrons, which results in the formation of an anodic region in the
14 Kelly (2003) and Sheedy (1998) agree that the stagnant electrolyte, and the associated concentration of ions, in the crevice creates an anode within the crevice with the flowing electrolyte creating a cathode with the remaining metal surface. Due to the location of the anode, the corrosion occurs with the crevice subsequently increasing the size of the crevice and the
concentration of ions within that crevice. Similar to the self-propagating nature of pitting, both of these effects encourage further corrosion. Another important aspect of crevice corrosion highlighted by Sheedy (1998) is the relative size of the corrosion product. Where the volume of this product is larger in size than the volume of material consumed in its creation, pressure is created on the crevice walls which may accelerate the growth of the crevice.
An important observation by Kelly (2003) and Bartholomew and Shifler (2007), notes that copper based alloys are the exception to this rule
regarding the location of the anode. The concentration of ions in the crevice of these alloys renders the crevice area cathodic. The anode becomes the surrounding surface area and thus corrosion occurs outside the crevice. Cohen (2005) supports this, stating that the location of attack from crevice corrosion will be outside but immediately adjacent to the crevice.
Cohen (2005) lists high water temperatures or water flow on the outside of the crevice as conditions that will increase crevice corrosion. Cohen further states that the probability and severity of crevice corrosion increases if the area within the crevice is small in comparison to the area outside the crevice.
2. 3. 7 Stress Corrosion Cracking
Jones (2003), Bartholomew and Shifler (2007), Callister (2007) and Watkins Borenstein (1994) agree that stress corrosion cracking occurs as a combined result of stress applied to, or residual stress within, a material and a corrosive environment. Copper alloys such as red and yellow brass, are susceptible to stress corrosion cracking in the presence of ammonia.
15 cracking in copper materials has been attributed to microbial ammonia production. In contrast to the organic origin of ammonia, Warke (2003) also presents several case studies with a variety of ammonia sources including a case that identified the ammonia source as “the reduction of nitrates by hydrogen evolved during the corrosion of the steel shell and/or tubes”. Boffardi (2003) agrees with Warke, stating that ammonia may be formed through thermal degradation of nitrogen containing compounds, such as sodium nitrite, added to the cooling water to reduce ferrous corrosion. The effect of ammonia on copper based alloys remains consistent, irrespective of the source.
Both Jones (2003) and Warke (2002) state that tensile stresses are required for stress corrosion cracking to occur and that cracking will occur
perpendicular to the application of these stresses. The crack paths in copper based alloys may be intergranular, following grain boundaries, or
transgranular, crossing grain boundaries. Warke (2003) defines the pH of the electrolyte as the determining factor for which type of cracking occurs with intergranular cracking only occurring within the 6 to 8 pH range. With the coolant in the cooling system maintained above a pH of 8, only
transgranular cracking would occur. The appearance of transgranular cracking would display crack arrest marks with a cleavagelike appearance, consistent with discontinuous crack propagation (Warke 2003). Stress corrosion cracking is best identified under microscopic inspection where multiple crack branch lines would be observed, typically propagating perpendicular to applied stress, initiating in areas with the highest stress.
2. 3. 8 Microbial Influenced Corrosion
Askeland and Phule (2008) and GE (2014) agree that the presence of microorganisms, such as fungi and bacteria, coating metal surfaces produce corrosive by-products. These by-products form anodic areas under the “biofilm”, the surface of the microorganism colony, and the unaffected areas of the metal surface are cathodic. As the anodic area, and the
16 Dexter (2003) states that whilst microorganisms can survive in pH ranges from ~0 to 10.5, most bacteria that have identified with corrosion grow best in the 6 to 8 pH range. Dexter also lists a select number of organisms that have been repeatedly reported as the cause of corrosion in environments in which there would be no corrosion in their absence. Of these, only
Desulfovbrio (also known as D. desulfuricans) and Acidithibacillus thiooxidans affect copper based alloys. These bacteria prefer pH ranges
from 4 to 8 and 0.5 to 8 respectively and Dexter (2003) describes
Acidithibacillus thiooxidans as having an aerobic oxygen requirement. A
closed cooling system is considered an anaerobic environment with a pH typically in the range of 8 to 10. Under this conditions a closed cooling system would be considered an inhospitable environment for growth of these microbes, and development of microbial corrosion.
[image:30.595.167.431.303.476.2]
Figure 2-6 Typical result of Microbial Corrosion (GE Power and Water 2014)
2. 3. 9 Dealloying
17 Cohen (2005) describes an investigation into dezincification in copper based alloys and states that it can be identified by viewing a cross section of the material. Here Davis (2001), Callister (2007) and Cohen (2005) describe the affected area in copper based alloys as a dark red in comparison to the surrounding yellow brass. The mode of dezincification may also be identified as either plug type or a uniform layer. In plug type dezincification, de-alloying only occurs in localised areas with the
surrounding areas unaffected (Davis 2001). Davis (2001) and Cohen (2005) agree that plug type dezincification is typical in areas of high temperature and a pH of 7 or above. Davis (2001) states that dezincification is more severe in brasses with two phase structures, with the beta phase affected first due to its higher zinc content.
2. 4 Corrosion Inhibitors
With water being the most common fluid used in heat transfer systems and having very effective electrolytic qualities, corrosion has long been a significant issue in cooling systems. Through extensive and ongoing research across many industries, chemicals have been identified that have specific qualities of inhibiting corrosion when added to the cooling water. Whilst these chemicals generally have beneficial corrosion inhibition qualities, many have significant characteristics which have been identified as hazardous to health and the environment. Of the chemicals in use today, the most significant for the purpose of this research are nitrites, in the form of sodium nitrite, and azoles, in the form of sodium mercaptobenzothiazole, both of which are passivation inhibitors.
Passivation inhibitors are consumed in the formation of these protective layers, reducing the concentration of inhibitor remaining in the coolant. Therefore, in order to retain the required minimum concentration for corrosion inhibitor, it is general practice to develop a recommended
18 2. 4. 1 Nitrites
Gershun and Woyciesjes (2003) identify nitrite, as a sodium salt in the form NaNO2, as an effective corrosion inhibitor for ferrous materials. Nitrite is
the typical corrosion inhibitor used for the prevention of pitting in cast iron cylinder liners.
The effect of nitrite ion concentration on corrosion inhibition investigated by Karem et al. (2010) shows that effective corrosion inhibition is achieved at a concentration of 500 ppm of NaNO2 for pH levels greater than 6.
Boffardi (2003) also states that corrosion inhibition is achieved at nitrite concentration above the range of 500 to 750 ppm of NaNO2 at a pH greater
than 7.5. Research indicates that an increase in nitrite concentration above 500 ppm does not provide any significant beneficial or detrimental effect to inhibiting corrosion in the test environment.
In practical applications it becomes important to understand that nitrites are a passivation inhibitor, forming a protective layer on the surface (GE Power and Water 2014). Therefore, whilst the minimum concentration for
corrosion inhibition is 500 ppm of NaNO2, the recommended minimum
concentration advised by GE is 950 ppm of NaNO2.
2. 4. 2 Azoles
Gershun and Woyciesjes (2003) state that mercaptobenzothiazole serves as an effective corrosion inhibitor for copper and brass components, both by itself and in conjunction with other azoles.
Azoles work in similar manner to nitrites in that they form a passivation layer to inhibit corrosion. Research conducted by the Ministry of Defence (2009), shows that azoles may effectively inhibit corrosion in copper and copper based alloys at concentrations as low as 2 ppm. This is due to the affinity of copper drawing the azole from the cooling solution. Therefore it may be considered that where any concentration of azole exists in solution, any copper based components in the system have a sufficient passivation layer.
19
2. 5 Debris
Anderson, Lukas & Lynch (1998) define coolant analysis as a dual aspect process consisting of debris monitoring for the presence of contaminants and condition monitoring of the coolant itself. The processes involved in monitoring the coolant for contaminants are designed to evaluate the concentration of elements in the coolant that may indicate wearing of the cooling system components.
The particular wear elements are determined by the compositions of the materials from which the cooling system components are composed. A generalised list of the mater for OEM lists the material compositions
2. 5. 1 Spectrochemical Analysis
Spectrochemical analysis is a method of measuring the concentration of specific trace elements in a sample through comparison of the intensity of radiation in specific wavelengths emitted when that sample is vaporised by an electric discharge (Spectro Scientific 2014). An increase in the
concentration of an element specified as a wear metal above a
predetermined level indicates excessive corrosion may have occurred within the cooling system. Likewise, a rate of increase in the wear metal
[image:33.595.139.462.629.742.2]concentration between routine sampling periods at a rate greater than a predetermined level indicates that excessive corrosion may be occurring within the cooling system. A generally accepted limitation of this type of analysis is that it is restricted to detection of wear particles smaller than 8 – 10 microns. Particles larger than 10 microns are not accurately detected by this method. ALS Tribology (2010) categorise the elements detected through spectrochemical analysis as additive, wear or water elements, as shown in Table 4. Of these wear elements, the reports supplied to RTIO include the concentration of chromium (Cr) however they omit silver (Ag) and zinc (Zn).
20 2. 5. 2 Particle Quantifier (PQ) Index
Particle quantification is the relative measurement of a material content in a given sample The PQ Index provided by ALS is a relative measurement of the amount of ferrous particles in the coolant sample, independent of size shape or count of those particles (ALS ). This method of detection is not limited by size and is recommended as complimentary test to
spectrochemical analysis. Comparison against the PQ Index will indicate whether the content detected is predominately larger or smaller than the 10 micron limitation of the spectrometer.
As with the Spectrochemical Analysis, excessive or rapidly increasing levels may be indicative of problematic corrosion occurring within the cooling system.
2. 6 Coolant
The coolant used in the closed cooling systems of the locomotives is a mixture of demineralised water and a concentrated corrosion inhibitor solution. These are supplied separately and mixed on site in accordance with the concentrations advised by the supplier of the concentrate.
The concentrate supplied to Rio Tinto is the corrosion inhibitor package Alfloc 9518, supplied by Nalco as a replacement for the superseded Nalco 2100. Alfloc 9518 retains the concentration of the corrosion inhibitors supplied in Nalco 2100, with the addition of an inhibitor for preventing corrosion in aluminium. As the GE locomotives do not contain aluminium cooling system components, this additional inhibitor is not of interest.
2. 6. 1 Water
21 In contrast to the GE, Mollenhauer and Tschoke (2010) state the pH value in cooling systems, being a measure of hydrogen ion concentration, should be maintained between 6.5 and 8.5. Gershun and Woyciesjes (2003) state that some inhibitors may prefer an initially higher pH around 10, and pH between 7 and 9 whilst in use. This statement supports the higher range specified by GE as the initial requirement for the corrosion inhibitor and also Mollenhauer and Tschoke in advising a lower ongoing pH. Whilst not diminishing the validity of the work by the aforementioned authors, it is the opinion of the author of this report that GE, as the original equipment manufacturer, is the overriding subject matter expert for their locomotives and as such their standards should be adhered to as the requirements for warranty purposes.
Table 5 Maximum Contaminant Levels in Raw Water (Extract from GE Transportation 2012)
2. 6. 2 Monitoring
The current practice at Rio Tinto does not apply a life to a particular batch of coolant in the locomotive, instead the coolant is monitored at scheduled intervals and the concentration of the corrosion inhibitor is maintained to specifications through the addition of the inhibitor concentrate.
22 The concentration of the nitrite in the coolant sample is deemed indicative of the concentration of the corrosion inhibitor package in the coolant and thus dictates the required volume of inhibitor concentrate to be added to the locomotive coolant. No test method has been identified to test for azole concentration at the workshop level of operations.
It has been observed that nitrite concentrations may be reported as units in ppm of N as N, ppm of N as NO2 or ppm of N as NaNO2 depending on the
practices of the testing agency or test method standard. These units are relative but not equivalent due to the molar masses of and may calculated by multiplication with the respective ratio of molar masses as shown in Table 6, noting 1 mg/L is approximately equivalent to 1 ppm.
Table 6 Molar Masses
Substance Molar Mass (g/mol)
Mass relative to NaNO2
Na 22.990
O 15.999
N 14.007 0.2
NO2 46.005 0.67
NaNO2 68.995 1
Note that all test methods mentioned in this report determine the
concentration of sodium nitrite through measurement of either the nitrite ion or the nitrogen element. Applying the ratios from the table above, a sample concentration reported as 1500 ppm of N as NaNO2 would be approximately
23
Chapter 3
Radiator Core Failure
3. 1 Background Information
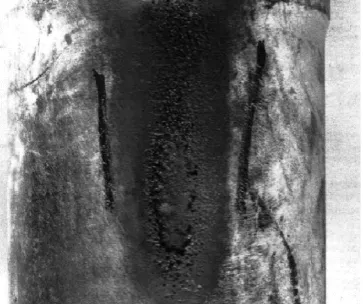
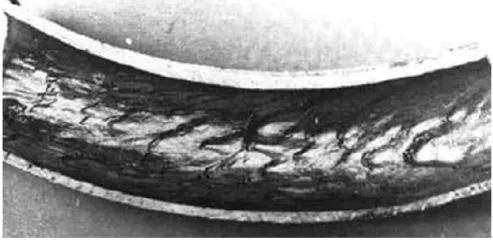
As part of routine scheduled maintenance the radiator core is removed and overhauled on a ten yearly cycle. During this overhaul process, the external contractor identified material degradation, shown in Figure 3-1, of the radiator core removed from locomotive 8125. On discovery of the degradation, the coolant in locomotive 8125 was sampled and sent for further analysis, this sample was taken after the radiator banks had been replaced.
The report supplied to Rio Tinto RSM identified the following three anomalies in the coolant sample:
A low pH value indicating a lack of proper coolant additive maintenance. [pH of 9.65]
A high ammonia level indicating there is microbial activity in the
system. [2.24 mg/L of Ammonia as N]
A low nitrite level. [203 mg/L of Nitrite as N]
The conclusions drawn from the report were that microbial activity was occurring in the locomotive cooling system and the ammonia level was highly undesirable in respect to stress corrosion cracking in the radiator tubes. The concluding recommendation was that RSM should monitor for ammonia in their normal testing program to identify the origin of the ammonia.
After the completion of this report, the radiator core was scrapped in line with normal processes. This destruction of the radiator core has
24
Figure 3-1 Radiator core removed from locomotive 8125
Figure 3-2 Enlarged section of the radiator cores
3. 2 Analysis
In response to the external analysis, further investigation was conducted into the anomalies noted in the report and the subsequent conclusion. It should be noted at this time that the radiator core is a significant component in the cooling system and its replacement involves the draining, storing, and replenishing the coolant in the system. Characteristics of the coolant samples recorded before after the change suggest that the cooling system has been replenished with the original coolant, however, there is a
reasonable likelihood of contamination via residual coolant in the storage tanks or by introduction of the new components. Therefore any sample taken after this procedure may not be strictly representative of the
25 3. 2. 1 pH
The report identified the pH of 9.5 in the coolant sample as low and
signalled this as an indicator of poor coolant management. In contrast to this statement, documentation provided by GE Transport (2012), as the OEM, and Nalco representatives, as the supplier of the corrosion inhibitor, indicate safe operating ranges of pH from 9 to 11 and 8.2 to 10.1 respectively. Historical data for the locomotive 8125 indicates the pH has been
maintained between 9.33 and 9.74. It is clear from this information that the pH was within the recommended ranges and would therefore not be
indicative of poor coolant management.
3. 2. 2 Nitrite
The report has also identified the nitrite, recorded as 203 mg/L of Nitrite as N, as low. As described in section 2. 4. 1 , an inhibitor concentration reported as a value of Nitrite as N will be five times less than that same concentration reported as a value of Nitrite as NaNO2, therefore the
equivalent concentration of this sample is 1015 mg/L of Nitrite as NaNO2.
A value given in mg/L is approximately equal to ppm and may be considered interchangeable, ergo 1015 mg/L is equivalent 1015 ppm.
As stated by Karem et al (2010), and substantiated through experimentation in Chapter 4 of this report, effective corrosion inhibition is achieved at concentrations of NaNO2 greater than 500 ppm. Concentrations greater than
500 ppm are recommended in coolants as the nitrite is depleted over time, a significantly higher concentration ensures that sufficient nitrite remains to inhibit corrosion throughout the coolant maintenance cycle.
In respect to original equipment manufacturer’s recommendations, GE Transportation (2012) state the minimum concentration required for Nalco 2100 is 950 ppm as NaNO2. Nalco representatives have advised that Alfloc
26 3. 2. 3 Ammonia
The report also concludes that the high ammonia level indicates microbial activity in the cooling system. As described by Boffardi (2003) and Warke (2003), ammonia may be produced through inorganic methods in the cooling system, for example, through the reduction of nitrite by hydrogen. Without any evidence of microbial influenced corrosion or build up
consistent of microbial activity, the strongest likelihood is that the ammonia is non-organic in origin.
No specific concentration of ammonia has been found as a minimum requirement for stress corrosion cracking to occur therefore it would be reasonable to agree that any concentration of ammonia is undesirable. It has been highlighted that, in the presence of ammonia, a tensile stress is also required for stress corrosion cracking to occur.
3. 2. 4 Azoles
Further commentary in respect to the report indicated that the azole concentration levels in the sample were low. It should be noted that the azole contained for copper based alloy protection in the corrosion inhibitor Alfloc 9158 is Sodium Mercaptobenzonthiazole and that the testing
conducted in the analysis did not include this specific azole. Therefore the conclusions made in reference to the azole levels were inaccurate by omission of a test for the relevant azole.
3. 2. 5 Material Degradation
As previously mentioned, stress corrosion cracking in copper based alloys requires the presence of ammonia and an applied tensile stress. The cracking propagates perpendicular to the applied stress which, in the case of residual hoop stress in tubing, would be circumferential resulting in longitudinal cracking. Where longitudinal stress is applied to the tube, cracking will occur circumferentially, however the location of fractures at the end of the cores is unlikely to be where any applied longitudinal stresses would be greatest. Examples of longitudinal and circumferential stress corrosion cracking are shown in Figure 3-3 and Figure 3-4 respectively
27
Figure 3-3 Longitudinal Stress Corrosion Cracking
Figure 3-4 Circumferential Stress Corrosion Cracking
3. 3 Conclusions
From the information identified in the analysis, it has been concluded that the coolants pH and corrosion inhibitor concentration are within the ranges recommended for the coolant in the given application. The observations made in the report provided to Rio Tinto stating these two factors were indicative of poor coolant additive maintenance have no discernable merit. Further to this, the presence of ammonia alone is not definitive evidence of microbial activity in the cooling system. In the absence of other indicators consistent with such activity, and given the possibility of inorganic
28 The presence of ammonia is of concern in the cooling system in respect to promoting stress corrosion cracking in the brass components. The assertion 2.24 ppm of Ammonia as N is a high concentration remains unconfirmed in respect to the causation of stress cracking corrosion. In consideration of research, it may be concluded that any concentration of ammonia is
undesirable in the coolant and rectification actions would be recommended. Investigations into the source of the ammonia should first consider non organic origins.
Although the corrosion inhibitor concentration was above the minimum concentration specified it was below the minimum concentrations set by Rio Tinto as an alarm limit. Investigations should be carried out to determine the root cause for this concentration being below that alarm limit and what, if any, effect that concentration would have on the locomotives cooling system. These investigations have been carried out later in this report.
The disposal of the radiator core prior to the completion of investigations has prohibited a conclusive analysis of the material degradation. In the absence of definitive test data, visual inspection suggests the cause of the material degradation is unlikely to be either stress corrosion cracking or microbially influenced. The red outer layer evident on the upper right side of the central tube of Figure 3-2 is consistent with the dezincification process of brass and its residual porous copper metal. This residual metal is far more brittle than the original brass and the subsequent fracture like degradation would be consistent with the exposure of the brittle material to the conditions found in the radiator core. Any observations, regardless of probability, can not be definitively confirmed without proper analysis and it would be prudent of Rio Tinto to stipulate that any further failures be quarantined and preserved to allow such analysis.
It has been identified that the coolant in locomotive 7081 has registered a concentration of 2.66 mg/L of Ammonia as N. Inspection of the radiator cores on this unit would be beneficial in evaluating the most likely cause of the material degradation in the radiator cores. The radiator cores on
29
Chapter 4
Bulk coolant mixing
Having identified that the corrosion inhibitor concentration in locomotive 8125’s coolant was below Rio Tinto target levels, a root cause analysis highlighted the corrosion inhibitor concentration of the bulk coolant concentrate for investigation.
4. 1 Current Process
The current mixing process at Rio Tinto draws a volume of demineralised water from a local supplier and adds a corrosion inhibitor package to a specific volumetric ratio. The mixing process is carried out manually onsite and stored for later use in a 55,000 L storage tank.
Anecdotal evidence indicated there was an element of confusion as to which corrosion inhibitor package was to be used in the mixing process. Through historical purchasing data and physical evidence onsite it was determined that the replacement of the Nalco product with its Alfloc successor had resulted in the supply of Alfloc 9003 and Alfloc 9518 to Rio Tinto.
Alfloc 9518 is the corrosion inhibitor concentrate package recommended to be mixed at a ratio of 1 part in 32 parts of water, producing a corrosion inhibitor concentration between 1200 and 1500 ppm of N as NaNO2. The
coolant mixed in this ratio, without subsequent addition of inhibitor, is intended for a service life of 1 year. Alfloc 9003 is a premixed coolant supplied by Nalco, with a corrosion inhibitor concentration of
approximately 2850 ppm of N as NaNO2. The higher concentration of
inhibitor is intended to increase the recommended service life out to 2 years.
30
4. 2 Coolant Mixing Procedure
[image:44.595.113.483.231.454.2]Historical test results carried out on the concentration of the bulk coolant supply over a period of 6 months indicate the current coolant mixing process has previously been inadequate in consistently maintaining the correct inhibitor concentration in the coolant. It is likely that locomotive 8125 may have had a replenishment of the cooling system prior to the radiator core failure at one of the lower concentrations indicated in Figure 4-1 below.
Figure 4-1 ALS Generated Trend Analysis of Bulk Coolant Nitrite Concentration
A procedural change had been implemented prior to this investigation to improve the consistency of the concentration in the bulk supply through the implementation of a strict volumetric ratio for mixing the corrosion inhibitor concentrate. The reduction in variation of the inhibitor concentration over the last eight readings indicates the success of this change and it is expected that ongoing tests will show a continued improvement in delivering
31
Chapter 5
Coolant Monitoring
The corrosion inhibitor package, Alfloc 9518, as advised by the
manufacturer, is added to demineralised or distilled water at a ratio of 1 part of concentrate to 32 parts of water. This produces an engine coolant
designed for use in the locomotive with an intended service life of one year, at this point the coolant is to be discarded and the cooling system be
replenished with a fresh batch of coolant.
Rio Tinto mix the corrosion inhibitor in accordance with the advised ratio however, the standard practice at the locomotive maintenance facicilities is to maintain the coolant in the locomotive indefinitely, reducing the cost of coolant replacement. In order to maintain the effectiveness of the coolant beyond the intended service life, Rio Tinto have implemented a coolant monitoring process. This coolant monitoring process is conducted in two separate procedures, the first of these is a corrosion inhibitor concentration test carried out within the maintenance facility by the locomotive
technicians. The second procedure is the off-site testing in a laboratory facility which analyses the coolant for a range of parameters.
5. 1 Inhibitor Concentration Testing
The onsite testing to determine the inhibitor concentration uses a nitrite test kit designed for use with Alfloc 9518. This kit specifies that, if the sample is visually dirty, cloudy rusty in colour or in any way contaminated, the
coolant in the locomotive should be replaced with fresh coolant. If the sample is clean, the maintainer fills a test tube with 1 mL of the coolant sample to which they add two drops of an indicating solution containing 1,10-Phenanthroline which acts as a colorimetric indicator, initially turning the solution orange. Cerium Sulphate is then added by individual drops until the Cerium Sulphate reacts with the Phenanthroline to change the sample colour to blue. Each drop of cerium sulphate required to facilitate the colour change is equivalent to 150 ppm of NaNO2 in the sample.
32 The off-site tests carried out in the laboratory use the same principles and chemicals however the process and control of volumes is much more precise through the use of calibrated apparatus and the handling and storage of the reagent chemicals. These methods are discussed further in subsequent chapters.
5. 2 Coolant Condition Monitoring
Beyond the corrosion inhibitor concentrations, the laboratory analysis also determines the concentrations of a number of elements and other physical parameters. These values are compared against an acceptable range
provided to the labaoratory, shown in Table 7, and advice is provided to Rio Tinto on actions to be carried when these values fall outside predetermined alarm limits.
Table 7 Acceptable Range
Wear Elements
(ppm) Contaminants (ppm) Physical / Chemical
Al ≤ 5 Zn < 0.1 pH 12.13
Cu ≤ 10 Si 210 Conductivity (uS/cm) 7930
Cr ≤ 3 Na 2200 Glycol Content (%) 3
Fe ≤ 10 B 515 Nitrite (ppm) 1200
Pb ≤ 5 Mo < 0.1 TDS (ppm) 5690
Sn ≤ 5 P 20 Colour Neon pink Ca 1 Clarity Clear K < 5 Visual Debris None Mg < 1 Odour Bland PQ index ≤ 59
5. 2. 1 Spectrochemical analysis
33 5. 2. 2 PQ Index
This test is designed to provide an indication of the total iron content in a sample which can be used to determine the size of iron particles. A high PQ index combined with a low Fe concentration detected through
spectrochemical analysis indicates that the majority of iron particles present in the sample are larger than 10 microns. Similarly, a low PQ index with a high Fe concentration indicates the majority of those particles would be smaller than 10 microns.
5. 2. 3 pH
The acceptable range given for the sample pH is 12.13, with an alert provided to Rio Tinto if the pH of the coolant was less than 7 or trending down rapidly. In reference to the pH range of 9 to 11 advised by GE and Nalco’s range of 8.2 to 10.1, these alarm limits would be inadequate in maintaining the pH within these ranges.
5. 2. 4 Colour
The acceptable range for colour is listed as “Neon Pink”. The pink colour of the coolant is due to the dye added to the corrosion inhibitor package by the supplier in accordance with Australian standards, which in concentrate form is a deep red. A common belief is that the concentration of the corrosion inhibitor in the coolant may be determined by the strength of the coolant colour. For the purposes of this analysis the colour is used as a general indicator of the quality of the coolant.
A review of the recent results supplied to Rio Tinto indicate that all of the samples shown Figure 5-1 were classified as “Neon Pink” suggesting this is simply being entered as a default value.
34 5. 2. 5 Odour
There has been a common practice to smell the coolant to identify any contaminants with a distinctive odour are present. The validity of this method is questionable considering ammonia has a very distinctive odour and was not detected by in the coolant of locomotive 8125. Alternative tests carried out as a result of the radiator core failure indicated that ammonia was actually present in the coolant samples, albeit in a low concentration of 2.24 ppm. Given that any presence of ammonia has been identified as detrimental to copper alloys suggests that this test method is inadequate as a tool for determining coolant quality.
Other than the adequacy of the method, of serious concern are the adverse effects on health that may arise from inhaling the chemicals. These effects include acute, or short term exposure, hazards such as irritation of the mucous membrane and chronic, or long term, hazards such as low blood pressure, withering of the testicles and the formation of carcinogenic nitrosamines. Whilst these effects are considered unlikely to occur through inhalation of the corrosion inhibitor, the questionable benefit of the practice does not warrant risk of exposure to the hazard. Internet searches indicate that artificial odour test units are available in the marketplace, the use of such equipment would remove any health implications associated with inhalation.
5. 2. 6 Nitrite
The acceptable range of nitrite concentration has been listed as 1200 ppm of Nitrite as NO2 with alerts to be issued when the concentration falls outside
the range of 950 – 1200 ppm of NO2. The disparity of units used in
reporting the nitrite concentration has caused confusion when comparing the results. In accordance with Table 6, the values of 1200 and 950 ppm of NO2
(Nitrite) is relative to the values of 1800 and 1400 ppm of NaNO2 (Sodium
Nitrite). In contrast, GE Transport (2012) list their recommended nitrite level for Nalco 2100 as 950 ppm of NaNO2. The Nalco supplied test method
for the Alfloc 9518 corrosion inhibitor package, which is the equivalent to Nalco 2100, lists 1350 ppm of NaNO2 as the minimum recommended
concentration. Through correspondence with Nalco representatives it was advised that the design range was 1250 to 2000 ppm of NaNO2 however,
35 Given that the recommended concentration from GE, as the OEM, is a minimum concentration of 950 ppm of NaNO2, the acceptable range of
1200 ppm of NO2 and the associated alarm level of 950 ppm of NO2 appear
to have been incorrectly determined through omission of clarification on the reporting units. Such confusion could be avoided if all concentrations were converted to ppm of NaNO2 to standardise measurements.
Historical reporting data has shown the corrosion inhibitor concentration in the Rio Tinto locomotives has varied between extreme values of 626 and 2084 ppm of NaNO2. These values fall outside the predetermined ranges
and show that concentrations have fallen below the minimum recommended by GE however research has indicated that a concentration of 500 ppm of NaNO2 is sufficient to prevent corrosion. Given that Sodium Nitrite is a
passive type corrosion inhibitor, when added to a cooling system, a portion of the Sodium Nitrite is drawn from the solution to form the protective passivation layer on the metal surfaces. The resultant concentration corrosion inhibitor remaining in the coolant will be lower than the initial concentration applied and will continue to deplete over the coolants service life. In reference to this depletion, the value of 950 ppm of NaNO2
recommended by GE (2012) is referenced for new or newly overhauled engines, where creation of the passivation layer will occur. As this is the recommended initial concentrations, the ongoing concentrations are
expected to fall below this however the effect of lower concentrations on the inhibition of corrosion have not be defined at Rio Tinto. Procedures for coolant management specify that coolants with a low inhibitor concentration are to have concentrate added to increase the concentration to a level within the acceptable range. Whilst it would be prudent of Rio Tinto to continue this practice, it would be of interest in the maintenance of the locomotive cooling systems to confirm that the lower concentrations detected have maintained effective corrosion inhibition. An experiment investigating the effect of corrosion inhibitor concentration on corrosion rates has been conducted and is detailed in Chapter 6.
5. 2. 7 Conductivity
36 to corrosion inhibition. It should be noted however that all ions contribute to the conductivity including the nitrite ions in the corrosion inhibitor package. Comparing the nitrite concentrations to conductivity over the historical analysis results, indicates a proportional relationship exists these values. Further investigation into this relationship is discussed in 0 of this report.
5. 2. 8 Visual Debris
This test procedure simply involves identifying the presence visual debris and, to limited capacity, some physical characteristics with no quantitative measurement. Historically, the observations have been recorded as none, dirt, or black magnetic. The distinction between dirt and black magnetic has been identified by the response of the debris to a magnetic field.
[image:50.595.212.384.478.697.2]A concern raised regarding the GE Evolution series locomotives is that the location of the sampling point in relation to the surrounding structure, illustrated in Figure 5-2, requires the fitment of hose to facilitate retrieval of a coolant sample. The concern is that this hose will collect contaminates which will then be collected in the sample and identified as debris from the cooling system.
37 Debris described as black magnetic would be consistent with the corrosion of iron in a low oxygen, high temperature environment such as a closed cooling system. In these environments the iron oxidation process typically results in the formation of magnetite, Fe3O4, rather than the ferric oxide,
Fe2O3, produced from the complete oxidation of iron. In comparison to the
more familiar ferric oxide, which is red in colour, magnetite is black and has relatively strong magnetic properties. However, magnetite is also a naturally occurring iron oxide and considering Rio Tinto use these locomotives for the transport of iron ore from mine sites, the presence of magnetite, and it’s collection in the coolant sampling hose, is possible. Identification of debris in the coolant as dirt reinforces the probability of introducing external contaminates by this sampling method. The possibility of such
contamination must be removed to be certain that the debris identified has originated from within the cooling system.
5. 3 Coolant Contaminants
The maximum parameters for the contaminants, as advised by Nalco’s, the corrosion inhibitor supplier, product specialists are presented in Table 8. Of the wear elements, Nalco recommend lower tolerances for both copper (Cu) and iron (Fe) than are currently observed in the coolant analysis. Notably, Nalco also include a total wear elements limit of less than 15 ppm.
5. 3.