Wind load sharing and vertical load transfer from roof to wall in a timber-framed house
293
0
0
Full text
(2) JAMES COOK UNIVERSITY COLLEGE OF SCIENCE AND ENGINEERING. Wind Load Sharing and Vertical Load Transfer from Roof to Wall in a Timber-Framed House. Satheeskumar Navaratnam MSc (Eng). DOCTORAL THESIS. Thesis submitted to the College of Science and Engineering in partial fulfilment of the requirements for the degree of Doctor of Philosophy (Civil Engineering). August, 16th 2016. i.
(3) Statement of access I, the undersigned, the author of this thesis, understand that James Cook University will make it available for use within the University Library and via the Australian Digital Theses network for use elsewhere. I understand that as an unpublished work a thesis has significant protection under Copyright act and I do not wish to place restriction on access to this work.. 16/08/2016 Satheeskumar Navaratnam. Date. ii.
(4) Statement of Sources I declare that this thesis is my work and has not been submitted for another degree or diploma at any university or other institution of tertiary education. Information derived from published or unpublished work of others has been acknowledged in the text and a list of references given.. 16/08/2016 Satheeskumar Navaratnam. Date. iii.
(5) Statement on the contribution of others Grants: This research work was supported by CSIRO “Climate Adaptation Engineering for Extreme Events Cluster”, managed by CSIRO Land and Water Business Unit. Additional funding was received from the College of Science and Engineering, and the Cyclone Testing Station (CTS) at James Cook University (JCU). A CSIRO Top-Up Scholarship was awarded for stipend (living allowance) and travel support, and additional travel stipend was also awarded by the Graduate Research School (GRS) at James Cook University to present the papers at international and national conferences. Supervision: Prof. J.D. Ginger (JCU) was the principle supervisor of this work. Other supervision was provided by Dr. D.J. Henderson (JCU) and Dr. C-H. Wang (CSIRO). Editorial Assistance: The editorial assistance was provided by Prof J.D. Ginger (JCU), Dr. D.J. Henderson (JCU), Dr. C-H. Wang (CSIRO) and Adjunct Prof. G.R. Walker (JCU).. iv.
(6) Acknowledgements I am extremely grateful and deeply indebted to acknowledge the valuable contributions of the many people who have helped to make this research possible. First and foremost thank Prof. John Ginger for his excellent, guidance, support, patience and encouragement throughout this research. I also thank Dr. David Henderson for his advice, guidance and invaluable discussions. I acknowledge the funding support of CSIRO, Australia. I would like to thank Dr. ChiHsiang Wang (CSIRO) for his support, advice and feedback about this project. I would like to thank Prof. Geoffrey Boughton and for many interesting discussions pertaining to his experiences with full-scale testing and damage investigations. I also thank Prof. George Walker for his advice and feedback about this project. I also would like to thank staff and the technicians of Cyclone Testing Station for their support, assistance and advice. Specially, I would like to thank Mr. Dennis Smith and Mr. Don Braddick for their support on the construction of the test structure. Many thanks go to fellow post graduate student at JCU, Mr. Mitchell Humphreys for his support to setting up and assisting with conducting the structural tests. Finally, I would like to thank my family and friends for their steady support and encouragement. I am especially thankful to my mum, Mrs Indiradevi, for her patience and support.. v.
(7) ABSTRACT Windstorms are one of the major causes of severe damage to houses and other infrastructure. Damage investigations indicate that the roof is the most vulnerable part of a timber-framed house, and that failures take place at inter component connections; hence there is a need to study the load sharing and structural response of these timber-framed house structural systems to assess their performance. Contemporary houses in many parts of Australia are brick veneer structures with metal or tile clad roofs that are built to National Construction Code of Australia’s design specifications. Full-scale tests were carried out on a representative part of a brick veneer contemporary house to assess the loading effects on roof to wall connections and load sharing. Tests were conducted for each stage of construction: bare frame followed by the installation of roof battens and cladding, wall lining, ceiling, etc. These construction stages were used to assess the contribution of the structural and lining (i.e. ceiling, ceiling cornice and wall lining) elements to the load sharing and response of the timber-framed house structure to wind loading. Results show that the vertical load sharing of the timber-framed house through the roof to wall connection depends on the stiffness of the roof to wall connection and the truss location (i.e. whether located at the end or middle). The contribution of the lining elements to the vertical load sharing is about 15% to 20%. In addition, individual component tests were conducted on the roof to wall framing anchor (i.e. triple grip and truss grip) connections to examine their structural response to loading. This study also showed that construction defects in roof to wall connections influence the design uplift capacity. Two missing nails out of ten in the hand nailed triple grip connection (i.e. one nail from the truss and other one from the top plate) reduces the design uplift capacity by about 40 % of the “Ideal” hand nailed triple grip connection. Finite element models were also developed for part of the timber framed house and roof to wall connections (i.e. triple grip and truss grip connections) using ABAQUS finite element software. Results obtained from the finite element models were compared with the experimental tests, showing good agreement. This finite element model can be used to predict the roof to wall connection response and truss hold-down force variation with a range of construction defects and truss bay configurations. The overall outcomes can be used to evaluate house structure vulnerability to wind loading, and to improve the design and standards of timber-framed houses. vi.
(8) Table of Contents CHAPTER 1:. INTRODUCTION ................................................................................ 1. 1.1. Objective ............................................................................................................ 6. 1.2. Thesis outline ..................................................................................................... 7. CHAPTER 2:. LITERATURE REVIEW ..................................................................... 9. 2.1. Introduction ........................................................................................................ 9. 2.2. Windstorm damage .......................................................................................... 10. 2.3. Contemporary house structural system ............................................................ 12. 2.3.1. Roof structure .......................................................................................... 14. 2.3.2. Wall structure .......................................................................................... 15. 2.3.3. Inter-component connections .................................................................. 15. 2.4. Wind loading on houses ................................................................................... 20. 2.4.1. Load Path ................................................................................................ 21. 2.5. Full-scale testing .............................................................................................. 23. 2.6. Numerical model analysis of house structural system ..................................... 29. 2.7. Summary of the literature survey ..................................................................... 32. CHAPTER 3:. REPRESENTATIVE CONTEMPORARY HOUSE ......................... 33. 3.1. Introduction ...................................................................................................... 33. 3.2. Representative one storey Brisbane/ Melbourne house ................................... 34. 3.2.1. Structural system of the representative contemporary house .................. 35. 3.2.2. Common construction defects in the RWCs ........................................... 37. 3.3. Summary and discussion .................................................................................. 40. CHAPTER 4:. EXPERIMENTAL TESTS ON INDIVIDUAL CONNECTIONS AND JOINTS ............................................................................................... 41. 4.1. Introduction ...................................................................................................... 41. 4.2. Test set-up for RWCs ....................................................................................... 42. 4.2.1. Detail of “Ideal” triple grip connection test specimens .......................... 42 vii.
(9) 4.2.2. Triple grip connection with construction defects .................................... 45. 4.2.3. Results and analysis of the roof to wall triple grip connections ............. 47. 4.2.4. Detail of truss grip connection test specimen ......................................... 59. 4.2.5. Test results and analysis of the roof to wall truss grip connection ......... 59. 4.3. RWCs design uplift capacity ............................................................................ 61. 4.4. Experimental tests on the joint between the timber and plasterboard .............. 63. 4.4.1. Experimental test set-up for the timber to plasterboard joints ................ 65. 4.4.2. Results and analysis ................................................................................ 67. 4.5. Summary and discussion .................................................................................. 71. CHAPTER 5:. FULL-SCALE STRUCTURAL TEST .............................................. 73. 5.1. Introduction ...................................................................................................... 73. 5.2. Full-scale test structure .................................................................................... 73. 5.2.1. Construction detail of the full-scale test structure................................... 75. 5.2.2. Loading and measuring systems ............................................................. 78. 5.3. Test results and analysis ................................................................................... 83. 5.3.1. Point loading on roof structure ................................................................ 84. 5.3.2. Influence coefficients .............................................................................. 98. 5.3.3. Patch-loads on the roof.......................................................................... 101. 5.3.4. Testing on the full-scale structure with shear walls (Stage S8) ............ 104. 5.3.5. Line loading on the test structure .......................................................... 114. 5.4. Summary of full-scale tests ............................................................................ 125. CHAPTER 6:. FEM OF THE FULL-SCALE TEST STRUCTURE ....................... 127. 6.1. Introduction .................................................................................................... 127. 6.2. FEM of the test structure ................................................................................ 128. 6.3. Inter-component connections in the FEM ...................................................... 131. 6.4. Validation of the FEM full-scale test structure .............................................. 136. 6.4.1. Structural response when load applied on the roof ............................... 138 viii.
(10) 6.5. Reaction forces at the RWCs.......................................................................... 141. 6.6. Summary of the FEM of the test structure ..................................................... 143. CHAPTER 7: 7.1. WIND LOAD SHARING ON THE ROOF ..................................... 145. Wind loads on the RWC by using loads on tributary area (i.e. traditional design method)......................................................................................................... 146. 7.1.1. Wind loads on the RWC by using load sharing .................................... 149. 7.2. Truss hold-down forces .................................................................................. 155. 7.3. Summary of the wind load sharing ................................................................ 160. CHAPTER 8:. CONCLUSIONS AND RECOMMENDATIONS ........................... 162. 8.1. Key findings ................................................................................................... 162. 8.2. Implications and Recommendations for further research .............................. 165. REFERENCES. ......................................................................................................... 168. APPENDIX A: INDIVIDUAL JOINT TESTS DETAILS ........................................ 178 APPENDIX B: FULL-SCALE STRUCTURAL TEST DETAILS ........................... 183 APPENDIX C: NUMERICAL MODEL OF THE RWC .......................................... 209 C.1. Introduction .................................................................................................... 209. C.2. Single nail joint .............................................................................................. 210. C.3. FEM development .......................................................................................... 214. C.4. Numerical model analysis of roof to wall triple grip connections ................. 221. C.4.1. Verification against test results ............................................................. 223. C.4.2. Combination loading effect on the roof to wall triple grip connection ....... ............................................................................................................... 229. APPENDIX D: DETAILS AND MORE RESULTS OF FEM OF FULL-SCALE TEST STRUCTURE ................................................................................... 243 D.1. Compression loading FEM of batten to truss connection .............................. 243. D.2. Compression loading FEM of plasterboard to timber joint ........................... 244. D.3. VRC comparison between the full-scale test and FEM ................................. 246. D.4. VRCs at the inter-component connections ..................................................... 252 ix.
(11) D.5. VRCs comparison to the FEM of test structure with and without construction defects........................................................................................................... 258. D.6. Lateral load (i.e. horizontally perpendicular to ridge) response .................... 261. D.7. Horizontal load response (parallel to the ridge line) ...................................... 264. APPENDIX E:. WIND LOAD ANALYSIS .............................................................. 268. E.1. Pressure tap layout and the sample wind load calculation ............................. 268. E.2. Truss hold-down force using AS 1170.2.2011 ............................................... 272. x.
(12) List of Figures Figure 1.1. Roof removed and exterior walls collapsed in a pre1980’s house at Yeppoon (photo courtesy of CTS)................................................................................. 4 Figure 1.2. A metal-clad building with wood post frame construction destroyed (Prevatt et al., 2015) .................................................................................................... 4 Figure 1.3. Schematic diagram of the vertical load path of the timber-framed house ...... 6 Figure 2.1. Wind regions of Australia (AS/NZS 1170.2, 2011) ....................................... 9 Figure 2.2. Roof loss after failure of door on the windward wall (Boughton et al., 2011) ........................................................................................................................................ 11 Figure 2.3. Partial withdrawal of nails in batten to rafter connection (Boughton et al., 2011) ............................................................................................................ 11 Figure 2.4. Typical arrangement of timber-framed house, (AS1684.3, 2010) ............... 13 Figure 2.5. Schematic diagram of a brick veneer contemporary house structural system ........................................................................................................................................ 14 Figure 2.6. Roof loss after failure of windward side timber post (located at veranda) connection at floor (Photo courtesy of CTS) ............................................... 18 Figure 2.7. Roof loss due to the RWCs failure (Photo courtesy of CTS) ...................... 19 Figure 2.8. Schematic diagram of wind load transmission from roof to foundation in a timber-framed structure ............................................................................... 22 Figure 2.9. Schematic diagram of idealised vertical load path of low rise timber-framed structure (highlighted in blue dash line) ...................................................... 23 Figure 2.10. Full-scale tested houses at CTS (Photo courtesy of CTS).......................... 24 Figure 2.11. Change in lateral response with addition of elements (Reardon and Henderson, 1996) ......................................................................................... 25 Figure 2.12. The full-scale test house at UWO (Morrison, 2010) .................................. 26 Figure 2.13. The full-scale test house of Doudak et al (2012) study .............................. 28 Figure 2.14. Basic Element Unit in He et al (2001) model analysis ............................... 31 Figure 3.1. House under construction in Brisbane (photo courtesy of CTS).................. 33 Figure 3.2. House under construction in Melbourne (photo courtesy of CTS) .............. 34 Figure 3.3. Representative contemporary house ............................................................. 35 Figure 3.4. Schematic diagram of the truss layout of representative contemporary house: a) General truss, b) Truncated truss and c) Jack truss.................................. 35. xi.
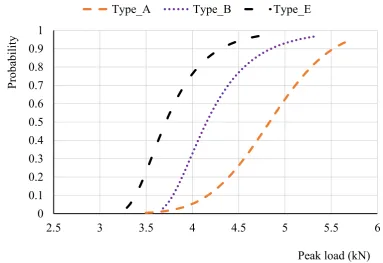
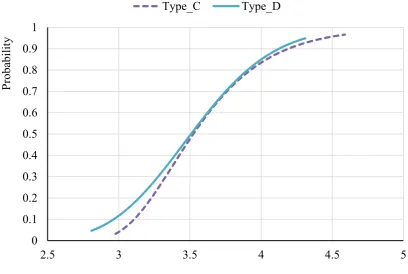
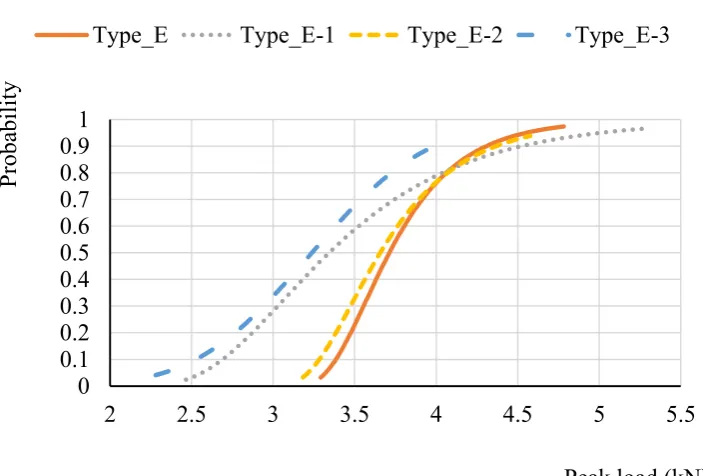
(13) Figure 3.5. Common RWCs of representative contemporary house: a) Triple grip connection, b) Truss grip connection and c) strap connection ..................... 36 Figure 3.6. Common construction defects on the roof to wall triple grip connection: a) Missing nail and triple grip bending, and b) Grouping nails and nail bending ...................................................................................................................... 38 Figure 3.7. Common construction defects on the roof to wall truss grip connection ..... 39 Figure 3.8. Common construction defects on the roof to wall strap connection ............ 39 Figure 4.1. Triple grip connection test arrangements ..................................................... 42 Figure 4.2. Hand nailed triple grip connection specimens: a) Type A, b) Type B, c) Type C, and d) hand nail (2.8 x 30 mm) ............................................................... 44 Figure 4.3. Gun nailed triple grip connection specimens: a) Type D, b) Type E, and c) gun nail (2.5 x 32 mm) ................................................................................. 44 Figure 4.4. Test specimen Type A -showing Nails N1 to N10 ....................................... 45 Figure 4.5. Defective gun nailed triple grip connection specimens: a) Type E-1, b) Type E-2, and c) Type E-3 .................................................................................... 46 Figure 4.6. Average applied force-displacement relationships for “Ideal” Triple Grip connections .................................................................................................. 49 Figure 4.7. Average applied force-displacement relationships for triple grip connection Type A with construction defects ................................................................ 50 Figure 4.8. Comparison of the force-displacement relationships for the triple grip connection Type E with construction defects .............................................. 51 Figure 4.9. Most common failure modes of hand nailed “Ideal” triple grip connections: a) Type A, b) Type B, and c) Type C .......................................................... 54 Figure 4.10. Failure modes of gun nailed “Ideal” triple grip connections: a) Type D, and b) Type E...................................................................................................... 55 Figure 4.11. The most common failure modes of defective hand nailed triple grip connections: a) Type A-N1, and b) Type A-N6 .......................................... 56 Figure 4.12. Most common failure modes of defective hand nailed triple grip connections: a) Type A-N9, b) Type A-(N1-N6), and c) Type A-(N1-N8) ..................... 57 Figure 4.13. Common failure modes of defective gun nailed triple grip connections: a) Type E-1, b) Type E-2, and c) Type E-3 ..................................................... 58 Figure 4.14. Truss grip connection test specimen .......................................................... 59 Figure 4.15. Applied force-displacement relationship for the Truss grip connection .... 60 Figure 4.16. Common failure modes of truss grip connection ....................................... 61 xii.
(14) Figure 4.17. Timber to plasterboard shear joint test arrangements ................................ 65 Figure 4.18. Shear load test specimens: a) Type S.S, and b) Type S.G ......................... 66 Figure 4.19. Tension load test specimens: a) Type T.S, and b) Type T.G ..................... 67 Figure 4.20. The applied load versus vertical displacement for Types S.G and S.S ...... 68 Figure 4.21. Most common failure modes of the shear load test specimens: a) Type S.G, b) Type S.G, c) Type S.S, and d) Type S.S ................................................. 69 Figure 4.22. Applied load versus vertical displacement for Types T.G and T.S ............ 70 Figure 4.23. Common failure mode of the tension load test specimens: a) Type T.G, b) Type T.G, c) Type T.S, and d) Type T.S ..................................................... 71 Figure 5.1. Full-scale test structure ................................................................................. 74 Figure 5.2. Schematic diagram of the plan view and nomenclature of the full-scale test structure........................................................................................................ 74 Figure 5.3. Schematic diagram of the roof structure ...................................................... 76 Figure 5.4. Type of fasteners used to construct the wall and roof: a) Batten to cladding fastener, b) batten to cladding fasteners locations, c) batten to truss fastener, and d) plasterboard to timber fastener ......................................................... 76 Figure 5.5. Location of fasteners and adhesive in the ceiling......................................... 77 Figure 5.6. Location of fasteners and adhesive in the wall lining .................................. 77 Figure 5.7. Schematic diagram of the structural frame and test loading locations on the roof (•) .......................................................................................................... 79 Figure 5.8. Loading systems for: a) Stage S1, b) Stage S2, and c) Stages S3 to S7 ....... 81 Figure 5.9. Locations of measuring devices ................................................................... 82 Figure 5.10. Schematic diagram of the steel rod connection from top-plate to load cell ... ........................................................................................................................................ 83 Figure 5.11. VRC, when loading on Battens B1 at Truss A (i.e. TA) ............................ 85 Figure 5.12. VRC, when loading on Battens B2 at Truss A (i.e. TA) ............................ 86 Figure 5.13. VRC, when loading on Battens B3 at Truss A (i.e. TA) ............................ 86 Figure 5.14. VRC, when loading on Battens B1 at Truss B (i.e. TB) ............................ 87 Figure 5.15. VRC, when loading on Battens B2 at Truss B (i.e. TB) ............................ 88 Figure 5.16. VRC, when loading on Battens B3 at Truss B (i.e. TB) ............................ 88 Figure 5.17. VRC, when loading on Battens B1 at Truss C (i.e. TC) ............................ 89 Figure 5.18. VRC, when loading on Battens B2 at Truss C (i.e. TC) ............................ 90 Figure 5.19. VRC, when loading on Battens B3 at Truss C (i.e. TC) ............................ 90 xiii.
(15) Figure 5.20. RWC vertical displacement variation at Truss A, loaded side support L.A ........................................................................................................................................ 91 Figure 5.21. RWC vertical displacement variation at Truss B, Loaded side support L.B ........................................................................................................................................ 92 Figure 5.22. RWC vertical displacement variation at Truss C, Loaded side support L.C ........................................................................................................................................ 93 Figure 5.23. RWC stiffness variation at Trusses A (i.e. TA), B (i.e. TB) and C (i.e. TC), supports L.A, L.B and L.C at Stage S1 ........................................................ 94 Figure 5.24. Percentage of applied loads were shared to the adjacent trusses when the applied loads were along Truss A (i.e. TA) ................................................. 96 Figure 5.25. Percentage of applied loads were shared to the adjacent trusses when the applied loads were along Truss B (i.e. TB) ................................................. 97 Figure 5.26. Percentage of applied loads were shared to the adjacent trusses when the applied loads were Truss C (i.e. TC) ........................................................... 98 Figure 5.27. Vertical reaction influence coefficient variation of Truss B’s loading side support (L.B) between S1 to S4: a) Stage S1; b) Stage S2; c) Stage S3, and d) Stage S4 ..................................................................................................... 100 Figure 5.28. Vertical reaction influence coefficient variation of Truss B’s loading side support (L.B) between S5 to S7: a) Stage S5; b) Stage S6, and c) Stage S7 ... .................................................................................................................... 101 Figure 5.29. Schematic diagram of the patch-load locations ........................................ 102 Figure 5.30. Applied loading system for the patch-load test ........................................ 102 Figure 5.31. Plan view of the test structure after construction of the shear walls (Stage S8) .............................................................................................................. 105 Figure 5.32. Elevation of the test structure with shear walls ........................................ 106 Figure 5.33. VRCs’ at the bottom plates of the wall and shear wall when load was applied to Batten B1 at Trusses A (i.e. TA) and B (i.e. TB) at Stage S7 and S8 ... 108 Figure 5.34. VRCs’ at the bottom plates of the wall and shear wall when load was applied to Batten B1 at Truss C (i.e. TC) at Stage S7 and S8 ................................ 108 Figure 5.35. Comparison of the vertical flexibility of the RW.C between Stages S7 and S8, when load was applied to Batten B1 at Truss A (i.e. TA) ................... 109 Figure 5.36. Comparison of the vertical flexibility of the RWC between Stages S7 and S8, when load was applied to Batten B1 at Truss B (i.e. TB) ................... 110 xiv.
(16) Figure 5.37. Comparison of the vertical flexibility of the RWC between Stages S7 and S8, when load was applied to Batten B1 at Truss C (i.e. TC) ................... 111 Figure 5.38. Comparison of the total lateral reaction force variation between Stage S7 and Stage S8 Types S.B and S.T tests, when load was applied to Batten B1 .. 112 Figure 5.39. Comparison of the lateral flexibility of the wall and shear walls’ bottom plate and top-plate between Stage S7 and Stage S8’s Types S.B and S.T, when load was applied to Batten B1 at Trusses A (i.e. TA) and B (i.e. TB) .............. 113 Figure 5.40. Comparison of the lateral flexibility of the wall and shear walls bottom plate and top-plate between Stage S7, and Types S.B and S.T, when load was applied to Batten B1 at Truss C (i.e. TC) .................................................. 114 Figure 5.41. Schematic diagram of loading systems for line load test ......................... 115 Figure 5.42. Applied load versus vertical displacement of RWCs at Truss C (i.e. L.C and R.C) ............................................................................................................ 117 Figure 5.43. Lateral displacement of RWC versus applied load at Truss C (i.e. L.C and R.C) ............................................................................................................ 118 Figure 5.44. The failure modes of the roof to wall triple grip connection of Truss C, at loading side during line load test ............................................................... 120 Figure 5.45. The failure modes of the roof to wall triple grip connection of Truss C, at non-loading side during line load test ........................................................ 121 Figure 5.46. Hair-line crack on loading side ceiling cornice ........................................ 122 Figure 5.47. Hair-line crack on non-loading side ceiling cornice ................................ 123 Figure 5.48. Comparison of the ceiling glue joint failure mode between the full-scale test and individual joint test: a) full-scale test, and b) individual joint test ...... 124 Figure 5.49. Comparison of the ceiling screw joint failure mode between the full-scale test and individual joint test: a) full-scale test, and b) individual joint test ..... .................................................................................................................... 125 Figure 6.1. Elevation view of the FEM of the full-scale test structure ......................... 128 Figure 6.2. Side view of the FEM of the full-scale test structure ................................. 129 Figure 6.3. Force displacement relationship for the RWC ........................................... 132 Figure 6.4. Force displacement relationship for the batten to truss connection in y’ direction (Fowler, 2003) ............................................................................ 133 Figure 6.5. Force displacement relationship for the glue joint between the ceiling and bottom chord of the truss ........................................................................... 134 xv.
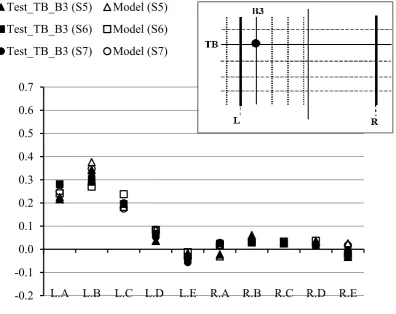
(17) Figure 6.6. Force displacement relationship for the screw joint between the ceiling and bottom chord of the truss ........................................................................... 134 Figure 6.7. Force displacement relationship for the glue joint between the wall lining and wall frame .................................................................................................. 135 Figure 6.8. Force displacement relationship for the screw joint between the wall lining and wall frame............................................................................................ 136 Figure 6.9. Comparison of VRCs between the full-scale test and FEM with and without modified stiffness, when loading at Truss D along Batten B2 at Stage S2. .................................................................................................................... 138 Figure 6.10. Comparison of the VRCs when load was applied at Batten B3 along Truss B at Stage S1, S2, S3 and S4 with full-scale test and the FEM ..................... 139 Figure 6.11. Comparison of the VRCs when load was applied at Batten B3 along Truss B at Stage S5, S6 and S7 with full-scale test and the FEM ........................... 140 Figure 6.12. Comparison of the total lateral reaction coefficients when load was applied at battens B1and B3 along Truss C (i.e. TC) with full-scale test and the FEM .................................................................................................................... 141 Figure 6.13. Von-mises stress (in Pascal) at the bottom plates of the Wall L and Wall R, when horizontal load was applied to the web members of Truss A .......... 142 Figure 6.14. Vertical reaction influence coefficient of Truss B’s RWC (i.e. LB) ........ 143 Figure 7.1. 1/50 scale wind tunnel model of representative contemporary house........ 145 Figure 7.2. Schematic diagram of roof structural system of the representative contemporary house general truss region; showing 𝑨𝒊 and vertical reaction forces .......................................................................................................... 147 Figure 7.3. Trusses’ layout and the pressure taps’ location of the representative contemporary house general trusses’ region .............................................. 147 Figure 7.4. Vertical reaction load time history for windward side supports at Stage S7: a) T1_L, b) T2_L, c) T3_L and d) T4_L at a wind speed of 57 m/s and a 320 o wind angle .................................................................................................. 151 Figure 7.5. Vertical reaction load time history for leeward side supports at Stage S7: a) T1_R, b) T2_R, c) T3_R and d) T4_R at a wind speed of 57 m/s and a 320o wind angle .................................................................................................. 152 Figure 7.6. Cp variation on the general truss region roof at the time stamp 2704 ........ 154 Figure 7.7. Cp variation on the general truss region roof at the time stamp 9208 ........ 154 Figure 7.8. Cp variation on the general truss region roof at the time stamp 9652 ........ 157 xvi.
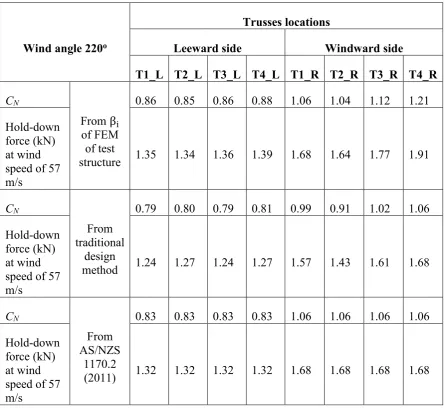
(18) Figure 7.9. General truss region of the contemporary representative house, circles showing the defective RWC locations ....................................................... 159. List of Tables Table 4.1. Detail of the "Ideal" triple grip connections test specimens .......................... 43 Table 4.2. Detail of the triple grip connections with construction defects ..................... 47 Table 4.3. The average peak load of the roof to wall triple grip connections ................ 52 Table 4.4. Design uplift capacity of different types of RWCs ....................................... 63 Table 4.5. Test specimens’ details for the timber to plasterboard .................................. 66 Table 5.1. Detail of each stage of the full-scale test ....................................................... 80 Table 5.2. RWC stiffness at Trusses A, B and C calculated for the six construction stages (S1, S2, S3, S4, S6, S7)................................................................................ 95 Table 5.3. Comparison of the VRCs between the patch-load test and calculated from the superposition of point load tests ................................................................ 103 Table 5.4. Comparison of vertical reaction force difference between the line load Test and SPM when load was applied along the Truss C at Battens B1, B2, B3 and B4 .................................................................................................................... 116 Table 6.1. Material parameters and member sizes used in the FEM ............................ 131 Table 6.2. Comparison between the FEM and full-scale test of the VRCs at loaded side RWCs ......................................................................................................... 137 Table 7.1. Maximum hold-down force at general trusses’ T1, T2, T3 and T4 supports ...................................................................................................................................... 149 Table 7.2. Maximum reaction load at bottom plate support with a 320o wind angle ......... ...................................................................................................................................... 153 Table 7.3. Maximum reaction load at the RWC for wind angles 210o, 220o and 320o ...... ...................................................................................................................................... 156 Table 7.4. Comparison of the maximum truss hold-down forces between the FEM of test structure, single truss analysis and AS/NZS 1170.2 (2011) ...................... 158 Table 7.5. Details of the general truss region with and without construction defects on the RWC .......................................................................................................... 160 Table 7.6. CN at the RWCs of the general trusses when the maximum CN obtained at the Truss T3 at time stamp 9652 from the wind tunnel data ........................... 160. xvii.
(19) NOMENCLATURE Ai. Tributary Area. 𝐶𝑝. Pressure Coefficient. 𝐶𝑁. Dimension-Less Hold-Down Force. 𝐶𝑑𝑦𝑛. Dynamic Response Factor. 𝐶𝑓𝑖𝑔. Aerodynamic Shape Factor. COV. Coefficient of Variation. CTS. Cyclone Testing Station. DAQ. Data Acquisition. FE. Finite Element. FEM. Finite Element Model. 𝐺𝑢. Gust Factor. 𝐼𝑢𝑢. Turbulent Intensity. JCU. James Cook University. LVDT. Linear Variable Displacement Transducer. MGP. Machine Graded Pine. PLA. Pressure Load Actuator. RWC. Roof to Wall Connection. SPM. Superposition Method. ̅ℎ 𝑈. Mean Wind Velocity at Mid Roof Height h. UWO. University of Western Ontario, Canada. 𝑉𝑑𝑒𝑠,𝜃. Design Gust Wind Speed at Mid Roof Height h. VRC. Vertical Reaction Coefficient. (𝑡). Fluctuating Reaction Force at Time t. ρ. Density of Air. 𝛽𝑖. Influence Coefficient xviii.
(20) LIST OF PUBLICATIONS. Journal Publications . Satheeskumar, N., Henderson, D. J., Ginger, J. D. and Wang, C.H. (2016). “Wind Uplift Strength Capacity Variation in Roof-to-Wall Connections of TimberFramed. Houses.”. Journal. of. Architectural. Engineering,. 10.1061/(ASCE)AE.1943-5568.0000204 , 04016003. . Satheeskumar, N., Henderson, D. J., Ginger, J. D., Humphreys, M.T. and Wang, C.H. (2016). “Load Sharing and Structural Response of roof-wall system in a Timber-Framed House.” Engineering Structures 122:310-322.. . Satheeskumar, N., Henderson, D. J., Ginger, J. D. and Wang, C.H. (2016). “Finite Element Modelling of the Structural Response of Roof to Wall Framing Connections in Timber-Framed Houses.” Engineering Structures 134:25-36.. . Satheeskumar, N., Henderson, D. J., Ginger, J. D. and Wang, C.H. (2016). “ThreeDimensional Finite Element Modelling and Validation of a Timber-Framed House to Wind Loading.” Paper submitted to Journal of Structural Engineering (ASCE).. xix.
(21) Conference Publications. . Satheeskumar, N., Henderson, D. J., Ginger, J. D. and Wang, C.H. (2015). “Loading Effects on Timber Truss to Wall Connection in a Contemporary House”. 17th AWES Workshop, Wellington, NZ in February 2015.. . Satheeskumar, N., Henderson, D. J., Ginger, J. D. and Wang, C.H. (2015). “Wind Loading Effects on Roof to Wall Connection in a Timber Frame Structure”. 14th ICWE, Porto Alegre, Brazil – June 21-26, 2015. . Satheeskumar, N., Henderson, D. J., Ginger, J. D. and Wang, C.H. (2015). “Load Sharing and Structural Response of Timber-Framed House”, Second International Conference on Performance-based and Life-cycle Structural Engineering (PLSE 2015), Brisbane, Australia, 9-11 December 2015.. . Satheeskumar, N., Henderson, D. J., Ginger, J. D. and Wang, C.H. (2016). “ThreeDimensional Modelling of the Timber- Framed Houses to Uplift Loading”. 24th Australian Conference on the Mechanics and Structures and Materials (ACMSM24), Perth, Australia, December 6-10, 2016.. xx.
(22) CHAPTER 1: INTRODUCTION Windstorms have caused billions of dollars in damage to infrastructure (buildings, houses, transport etc.), significant insurance payouts and loss of lives to coastal regions around the world. Two extreme wind events that led to significant changes in building codes were; Cyclone Tracy which caused extreme damage in Darwin, Australia (Walker, 1975), and Hurricane Andrew in the United States (US) (Department of Housing and Urban Development, 1993). During Cyclone Tracy, the loss of roof cladding in houses resulted in extreme damage, leading to a significant loss of strength in house structure, which resulted in progressive collapse (Walker, 1975). These failures have shown that timber-framed residential structures can be highly vulnerable to windstorms. After Cyclone Tracy, all levels of government, researchers, insurance companies and structural engineers raised questions about the vulnerability of the timber-framed houses in Australia. As a result, research studies and investigations were conducted by way of wind tunnel testing, wind climate measurements and modelling, structural analysis, full-scale field testing and full-scale laboratory testing in order to assess the strength, revise the design codes and improve the structural stability of the house structure. Individual components’ (i.e. wall, ceiling, connections, etc.) laboratory tests were carried out at the Cyclone Testing Station (CTS), James Cook University by Walker and Gonano (1981, 1982 and 1983) and Reardon (1979) to evaluate the load transmission, strength and stiffness of timber-framed houses and their structural and non-structural elements. Two basic forms of load transmission were found from these laboratory tests: (i) transmission of vertical uplift loads from the roof to the foundations, primarily achieved by ensuring a direct load path from the main roof structure to the foundations, and (ii) transmission of lateral loads. To evaluate vertical transfer, most experiments focused on testing various types of connections between roof cladding and battens, between battens and trusses, between trusses and the top-plates, and between the top-plates and the foundations. Transmission of lateral loads was more complex, involving transmission of the lateral loads on the walls, and the lateral component of roof loads to transverse walls by diaphragm action of the ceiling linings. These forces were transmitted to the foundations by diaphragm action of the transverse walls. In each case (i.e. vertical and lateral loads’ transmission) connections were a very important part of the structural system to transfer 1.
(23) the loads. These individual components’ tests were ‘deemed-to-comply’ with construction standards for wind loading, which were developed to cover most conventional forms of houses. All the members, including the connections, ceiling diaphragm and transverse walls, were assumed to transmit the loads and were regarded as structural elements. The members were rated in terms of strength, and the structural transmission was assumed to be taken by a limited number of walls designed to meet these requirements, with the rest of the walls regarded as non-structural. The full-scale house tests under simulated wind loads, including houses designed for cyclone areas, were carried out at the CTS by Boughton and Reardon (1982, 1983a, 1983b, and 1984). Houses were tested to failure, with the failure loads compared with design loads. The full-scale test results showed that the new design approach was mostly conservative in terms of assumed structural behaviour, as Boughton and Reardon (1982) found there were inherent redundancies in the structural behaviour of houses as a whole unit. Based on the simplifications of load transmission assumed in the design, these redundancies provided more wind resistance in houses than estimated. The complexity of the actual load transmission was difficult to incorporate in design, without full-scale testing of individual house designs. The full-scale tests (Boughton and Reardon, 1982, 1983 and 1984; Reardon, 1986 and 1990; Reardon and Mahendran, 1988; Reardon and Henderson, 1996) qualitatively showed the strength, stiffness and load transfer of the house system subjected to wind load, with various structural and lining components such as wall lining, ceiling and ceiling cornice. Therefore, quantitative analysis of load sharing and contribution of the structural and lining elements to the load sharing of the timberframed house structure are needed. Recently, several other full-scale house tests have been carried out to evaluate the structural response and load transmission of the North American and Canadian residential houses (Morrison, 2010; Datin et al., 2007; Doudak et al., 2012; Canino et al., 2011). However, the usefulness of these experimental results to assess the structural response of Australian residential house is limited, as their construction types are different. In nonhurricane regions of North America, houses are generally light-framed wood structural systems and have wood sheathing on the walls and roof, and roof trusses are toe-nailed to the wall top-plate. Modern houses in non-cyclone regions of Australia are brick veneer wall, metal roof cladding and roof trusses that are tied with triple grip connections to the 2.
(24) wall top-plate. These variations in construction result in differences in their structural response to wind load. Both the full-scale and individual components’ test (Boughton and Reardon, 1982, 1983 and 1984; Reardon, 1986 and 1979; Reardon et al, 1988; Walker and Gonano, 1981, 1982 and 1983) results assisted in the developing building standards for housing and recommendations that houses should be structurally designed to resist extreme winds in cyclone prone areas. The recommendations were largely implemented by the early 1980’s, and by the early 1990’s had been extended Australia-wide through the Building Code of Australia and a range of standards (AS 1684.1, 2002; AS 1684.2, 2010; AS 1684.3, 2010; AS 1720.1, 2010). Similar process were adopted around the same time in respect of earthquakes in New Zealand. In the 1990’s, following damage from Hurricane Andrew, similar type of recommendations were adopted in many hurricane prone areas of the US (Khan et al., 1993; Gurley et al., 2006). In very broad-brush terms, houses in Australia are categorised into two types: Pre1980s and Post 1980s. Pre1980s houses were generally built by skilled labourers and builders, with limited engineering design input, and their sizes were smaller compared to post 1980s houses. Post 1980s houses (contemporary houses) are built by trained builders, using skilled and/or semi-skilled labourers to engineering design specifications (i.e. AS 4055, 2012). Houses are constructed using a range of structural components (battens, trusses, top and bottom plates, wall, roof cladding, foundation, etc.) and connected by inter-component connections, which are usually cladding to batten, batten to truss, truss to wall and wall to foundation connections. Differences in design and construction will cause variable damage to houses within a community during windstorms as shown recently in Australia after Cyclone Yasi, Cyclone Larry and the Brisbane Thunderstorms. The roof of a house generally experiences the highest wind loads, and has typically been the most vulnerable part of a house to wind loads. Post windstorm disaster investigations (Walker, 1975; Boughton et al., 2011; Leitch et al., 2009; Shanmugasundaram et al., 1995 and 2000) indicated that failures of many house structures were due to loss of the roof cladding system. These type of failures were due to the high internal pressure generated by a dominant opening on the windward wall (resulting from wind pressure or windborne debris impact) and construction defects. The damage investigations and research have clearly shown that the wind introduced external and internal pressure on a building, construction defects (i.e. missing fasteners, overdriving of nails and improper placement 3.
(25) of anchor bolts) and the resulting structural response must be accurately determined, in order to assess the fragility of structural components in houses. The damage in recent windstorms, such as in Cyclone Marcia (2015, Figure 1.1), Cyclone Olwyn (2015), the Brisbane Severe Storm (2014), and the Tornado in Oklahoma (2015, Figure 1.2) show the roof structure failures due to the high wind speed, which caused cascading failure. These failures indicate that timber-framed houses remain vulnerable in cyclonic and noncyclonic regions.. Figure 1.1. Roof removed and exterior walls collapsed in a pre1980’s house at Yeppoon (photo courtesy of CTS). Figure 1.2. A metal-clad building with wood post frame construction destroyed (Prevatt et al., 2015). 4.
(26) Post 1980s houses of Australia are designed and built for a low internal pressure in noncyclonic regions, whilst the houses in cyclonic regions are designed and built to the high internal pressure resulting from dominant opening (AS 4055, 2012). Therefore, potentially Post1980s houses in non-cyclonic regions of Australia are more vulnerable than those in cyclonic regions (Ginger et al., 2015) when a dominant wall opening is created. As a result, there has been an increasing focus within the structural engineering research community to assess the actual performance of structures under extreme events, particularly timber-framed houses because of their importance in respect of disaster mitigation. The wind disaster mitigation policies for residential houses are specified based on the investigation of the vulnerability of a houses, damage estimation and cost of repair or replacement (Walker, 2011; Smith et al, 2015; Pinelli et al, 2008). Damage estimation in terms of loading depends on the load on each structural member and the inter-component connection along with their capacities. This requires a good understanding of their structural response to wind loading. Several studies have been conducted to evaluate the response and behavior of many of the components (i.e. roof to wall connection, cladding to battens connection, battens to truss connection) of timber house structures. However, there is only limited data available on the load distributions through inter-component connections, and progressive damage due to connection failure to wind loading. Moreover, construction defects and lack of knowledge in load sharing systems also increases the probability of structural failures in extreme wind events. The evaluation of the structural adequacy of house design to windstorms is also needed due to the introduction of new materials, and the type of construction with new and old materials in current house construction (i.e. similar to retrofitted house after damage) (Dorey and Schriever, 1957; Smith et al, 2015). To assess the structural adequacy of house design, more sub-assembly tests on the structural elements and inter-component connections as well as full-scale house tests are required. Recent studies at the CTS, James Cook University, investigated the response of roof cladding to batten connection by Henderson (2010) and Lovisa (2015), and batten to truss connections by Jayasinghe (2012) in the vertical load path of the house (Figure 1.3) by testing sub-assembly systems. One of the unresolved issues pertaining to timber-framed residential structures is the load. 5.
(27) sharing between adjacent trusses and roof to wall connections during uplift loading (Henderson et al., 2013).. Figure 1.3. Schematic diagram of the vertical load path of the timber-framed house. The current study, investigates the “response of roof structure and its connections to the wall of a house to wind loading”. Wind tunnel model test, full-scale test, individual joint tests (i.e. roof to wall connections and glued and screwed fastener joints between the plasterboard and timber) and numerical model analysis are used assess the structural response of contemporary house to wind loads. 1.1. Objective. The aim is to quantify the load sharing and transfer of the load from roof to wall through the truss to wall connection of a timber-framed house. The load sharing and load transfer of the timber framed house are dependent on the structural response and capacity of their inter-component connections and, structural (i.e. truss, cladding, battens, studs, etc.) and lining elements (i.e. ceiling, ceiling cornice and wall lining). 6.
(28) Full-scale tests were conducted on the general truss region of a contemporary representative house to determine the influence coefficients for critical load effects, and evaluate the contribution of the structural and lining elements to the load sharing in timber-framed house. In addition, following supplementary tasks were used to achieve these objectives; . Define the contemporary representative house and its inter-component connections and construction types from the field survey.. . Investigate the roof to wall connections’ structural response by conducting sub assembly tests.. . Develop a finite element model (FEM) of the full-scale tested structure, and validate the model using full-scale test results. The model was developed to represent a real house.. . Evaluate the wind loading on a part of contemporary representative house using wind tunnel studies and FEM.. 1.2. Thesis outline. The contents of this thesis are: Chapter 2 reviews the fundamental concepts in wind load distributions and timber-framed house structural system design and construction. This Chapter also reviewed the full-scale tests and numerical modelling of the timber-framed structure and inter-component connections. Chapter 3 presents details of the field survey and defines the contemporary representative house and its common roof to wall connections and construction defects. The experimental investigation on the individual joints, such as common roof to wall connections with and without construction defects and, glued and screwed joint between the timber and plasterboard are discussed in Chapter 4.. 7.
(29) Chapter 5 reports the findings of full-scale tests on the representative contemporary house’s general truss region. The load sharing and the contribution of the structural and lining elements to the load sharing are also detailed in this Chapter. The FEM development, analysis and validation for the full-scale test structure are presented in the Chapter 6. This Chapter also discusses the FEM of the representative house, and the influence coefficients at the roof to wall connection. Chapter 7 describes the wind tunnel model studies on the contemporary representative house and the wind pressure distribution on the full-scale test structure. This chapter also revealed the comparison of the truss hold-down force between the standards and fullscale test results. Chapter 8 highlights the major conclusions drawn from this research, recommendations and potential areas for further research. Appendix A reports the method to determine the design uplift capacity from laboratory test results. The calibration details of the measuring devises and full-scale test setups are presented in Appendix B. The FEM development and validation for the roof to wall connection, and additional results from the FEM of full-scale test structure are presented in Appendix C and D, respectively. Appendix E describes the sample wind load calculation.. 8.
(30) CHAPTER 2: LITERATURE REVIEW 2.1. Introduction. The design approach to ensuring stability of a house structure under wind loading is to transfer wind loads from the roof and wall structure to the foundation, through secure inter-component connections. Although this approach has been shown as adequate, the complex structural system in a house (i.e. compared to other buildings) may result in nonoptimal design (Walker and Reardon, 1987). Timber-framed construction is widely used for residential building in Australia. The design and construction of contemporary houses in Australia is based on the wind region (Figure 2.1) and wind classification. The wind load Standard and Building Codes of Australia (AS/NZS 1170.2, 2011; BCA, 2011) provide the parameters such as design wind speed and aerodynamic shape factors to determine wind loads on buildings.. Figure 2.1. Wind regions of Australia (AS/NZS 1170.2, 2011) The design of a timber-framed house structure aims to contest the strength (i.e. capacity) of structural components and connections with the loads applied during a windstorm, is sufficient to avoid structural failure. Prevention of structural damage to houses due to wind loading requires the connections to be robust and structural components able to transfer the fluctuating wind load. 9.
(31) The failure of components (i.e. wall, roof, etc.) and the modes of progressive damage are dependent on the load distribution, structural response, load sharing and the strength of structural members and connections. The load sharing of the timber-framed house structure is influenced by the type of roof system, geometry, cladding, battens, truss, ceiling, wall, and types of inter-component connections. This literature review examines the timber-framed house structural system design and construction, load distribution, structural response and load sharing. 2.2. Windstorm damage. Windstorms in Australia (Cyclone Tracy, Cyclone Yasi, Cyclone Larry, Brisbane Thunderstorms, Cyclone Marcia, etc.) have caused severe damage to houses due to high gust wind speeds. After these events, research and investigations were conducted in order to assess design and structural strength of timber-framed houses (Walker, 1975; Boughton and Reardon, 1982, 1983, 1984; Leitch et al., 2009; Boughton et al., 2011). During Cyclone Tracy, the loss of roof cladding led to extreme damage, a subsequent significant loss of strength in connections, creating progressive collapse (Walker, 1975). Walker (1975) also found that engineered structures performed better compared to nonengineered structures. His report strongly recommended that houses in Australia be engineered, and their structural design should be certified by a structural engineer and to have their construction adequately supervised. More recently Cyclone Yasi caused failures of roof, roofing components (batten to cladding connection, the batten to rafter connections, etc.) and roller doors especially in older houses (i.e. built before 1980s). Boughton et al (2011) found that the reason for these types of failures was due to the high internal pressure created by a dominant opening on the windward wall (resulting from wind pressure or windborne debris impact) as shown in Figure 2.2. This type of failure was also found in Cyclone Tracy (Walker, 1975) and the Brisbane Thunderstorms (Leitch et al., 2009). In addition, Boughton et al (2011) also found that there were hidden or partial failures of the structural connections within the roof (Figure 2.3). These hidden failures reduced the strength and stiffness of the connections. This stiffness reduction in the connections will affect the load sharing and creates progressive failures (Morrison, 2010). Hence, these hidden failures should be repaired otherwise they will cause significant damage to the timber-framed house structure in future events (Boughton et al., 2011). 10.
(32) Figure 2.2. Roof loss after failure of door on the windward wall (Boughton et al., 2011). Figure 2.3. Partial withdrawal of nails in batten to rafter connection (Boughton et al., 2011). 11.
(33) Hurricane Andrew (1992) and Hurricane Katrina (2005) caused severe damage to houses in the US, with most of the failures being the roof sheathing. Hurricane Andrew estimated that about 77% of houses had failures of roof covering and about 64% of houses had failure of windows and/or doors (Department of Housing and Urban Development, 1993). These window and door failures increased the internal pressure and that caused most of roof failures (Keith and Rose, 1994). Hurricane Katrina’s damage indicated that more detailed concern needs to be paid to all connections, especially the correct use of all straps and ties to securely convey the load from roof to foundation (Van de Lindt et al., 2007). These research studies and damage investigations showed that the roof, roofing components and connections are the most vulnerable structural elements in the timberframed house structural system. Furthermore, a detailed knowledge of the wind load distribution and load sharing from the roof to foundation is required to assess the performance of houses to windstorms. 2.3. Contemporary house structural system. The structural system of timber-framed houses vary from country to country and region to region, and have developed over time. In most parts of Australia, residential structures are a timber-framed construction, which enables quicker construction. Depending on the location (Figure 2.1), Australian houses can be categorised into two types: cyclonic region and non-cyclonic region houses. Moreover, houses can be catergorised as Pre1980s and Post 1980s houses. Pre 1980s houses in cyclonic regions are generally timber-framed nail constructions with studded walls and inset diagonal timber bracing and that had limited engineering inputs. Roofing is bolted truss or orthodox framing construction with galvanized-iron sheeting and diagonal timber bracing. Houses built between 1968 and 1972 were structurally similar, except for the use of gang-nails on trusses and triple-grips for the connection between purlin and truss (i.e. strap type connectors were replaced with simple nail connections). Since then, trusses have become the dominant roofing structural system, but bracing between trusses has been largely removed (Walker, 1975), under the supposition that the roof sheeting resisted the wind load and acted as bracing. Houses built towards the end of this era incorporated cyclone provisions such as more effective use of cyclone rods and the use of screws instead of nails for fixing roofing material. Post 1980s houses in cyclonic regions are generally engineered structures that are designed to standards (AS 12.
(34) 1684.3, 2010; AS 4055, 2012); consisting of a slab on the ground, one storey, and timberframed or reinforced masonry block wall houses with steel clad low roofs with short eaves. These types of houses were the most commonly built immediately after Cyclone Tracy. The layout of a timber-framed house structural system in Australia is shown in Figure 2.4.. Figure 2.4. Typical arrangement of timber-framed house, (AS1684.3, 2010) Contemporary houses in cyclonic regions of Australia are generally masonry block construction systems (Jayasinghe, 2012). This type of house is constructed on a concrete slab on the ground and concrete filled masonry blocks with regular spaced continuous reinforcement from slab to bond beam. The roof shapes of these cyclonic region houses are gable or hip, or a combination of both. The contemporary houses in non-cyclonic regions are generally brick veneer (i.e. external wall cladding) construction systems with the roof shapes similar to cyclonic region houses. Tiles and metal cladding are used in these non-cyclonic region house roofs, the tiles are attached to timber battens, and the metal cladding is fixed to metal top-hat battens. Shear walls in these contemporary house are based on the length of the house and 13.
(35) wind speed. The schematic diagram of a brick veneer contemporary house structural system is shown in Figure 2.5.. Figure 2.5. Schematic diagram of a brick veneer contemporary house structural system. 2.3.1 Roof structure The roof system of a timber-framed house consists of cladding, battens, trusses, topplates, etc. Tiles and metal cladding are the common roof cladding materials used in Australia, and are dependent on the climate and aesthetics. The installation of roof tiles is specified in Australian Standard AS 2050 (2002), which strongly recommends that every full tile should be mechanically fastened according to wind classification AS 4055 (2012). The structural response of the roof structural system to windstorm is strongly influenced by the connections: cladding to batten, batten to trusses and truss to top-plate. In addition, response of the roof structure also depends on the ceiling and ceiling cornice, which distributes or transfers the wind loads from the roof structure to wall.. 14.
(36) 2.3.2 Wall structure The wall structure plays an important role in the timber-framed house, resisting racking loads as well as vertical loads by transfer of the loads to the foundation. Plywood sheathing, plasterboard, brick veneer, metal cladding and reinforced masonry blocks are commonly used in Australian house wall structures. The structural behavior and response of plywood sheathing walls to wind loading mainly depends on the nail force-slip characteristics. Moreover, plywood sheathing’s structural response also depends on studs and the sheathing stiffness and strength (Gupta et al., 1985). Commonly, this type of wall structure is used in the US, Canada, UK and Australia, while brick veneer type walls are commonly used in low rise buildings in some part of the world (i.e. Australia, US, India, France, China, etc.). The brick veneer is used in conjunction with inner timber frame units, where brick ties are used to connect the timber frame to the brick veneer. The advantage of a brick veneer wall is excellent thermal performance and prevention of water penetration. This brick veneer is not designed to carry lateral loads but it can convey the lateral loads through the brick ties to the frame (Reardon et al., 1988; Choi et al., 2004). Masonry block wall constructions are popular in the cyclone regions of Australia. Masonry blocks have large hollow cores allowing steel reinforcing to run through walls, and some cores to be filled with concrete. Normally, brick veneer construction and masonry blocks are built onto the slab with starter bars running through the cores. Horizontal steel reinforcement is used along with shear ties in the concrete bond beam at the top of the walls, and vertical reinforcing steel is tied to the starter bars and runs the entire height of the wall. 2.3.3 Inter-component connections In a house structural system, connections are designed to transfer uplift and lateral loads during a strong wind event, and should provide a continuous load path from the roof to the foundation. Common types of connections used in timber-framed construction are cladding to batten, batten to truss, truss or rafter to top-plate, top-plate to wall frame, and wall to foundation connections. The strength of the connections varies with type, design, material, construction practices and workmanship (Jayasinghe, 2012). The intercomponent connections of timber-framed houses are commonly made by nails, nail plates, bolts and nuts, screws, glue and straps, or a combination of these. They are simple 15.
(37) to install but their response to wind loads are more complex compared to other building connections (i.e. steel joints, concrete and steel connection, etc.) (Guha et al., 2012). Many windstorm damage investigations including those by Boughton et al (2011), Walker (1975), and Shanmugasundaram et al (1995) have shown that the failure of connections between structural components is mainly responsible for major damage to timber-framed houses. The failure of connections can often be attributed to construction defects which result from inadequate quality assurance, missing fasteners, overdriving of nails and improper placement of anchor bolts (Leitch et al., 2009). 2.3.3.1 Cladding to batten connection The number and type of fasteners for cladding to batten connection are specified in the standard (AS 1684.2, 2010; AS 1684.3, 2010) and manufacturer’s specifications. This cladding to batten connection is designed to transfer the wind load to the battens. A common failure in the metal roof cladding system is fatigue failure (Mahendran, 1995; Walker, 1975; Boughton et al., 2011). The large number of low level load cycles or fewer cycles at a level closer to the ultimate static capacity can create this fatigue failure (Henderson, 2010; Henderson and Ginger, 2005). In addition, metal roof cladding may cause tearing of sheeting due to the profile of the roof cladding carrying part of the racking forces (Mahendran, 1998). Boughton et al (2011) found that the performance of the metal roof cladding is better than the tile roof in a house during windstorm. In the case of tile roof cladding systems, half the tiles are tied down by use of metal clips. However, “Clips may suffer from a low cycle fatigue failure under the fluctuating wind loading, which results in the loss of tiles” (Boughton et al., 2011). A study by Henderson (2010) showed that the roof cladding system construction and design require improvements to enable innovative, efficient and economic use of materials. Such as additional screws in highly loaded corners and gable ends and reduced the number of screws in central area of roof. Henderson (2010) also suggested that manufactures’ load span design tables should be improved to incorporate the peak loading pressures that are underestimated in AS/NZS 1170.2 (2002).. 16.
(38) 2.3.3.2 Batten to truss connection Battens are located immediately under the roof cladding, and are fixed to the rafters or trusses in house structural systems. Screws, nails and metal straps, either singly or in combination, are commonly used to fix battens and trusses or rafters. Recent research studies carried out by Jayasinghe (2012) found that loads on the batten to truss connection are strongly influenced by the behaviour of the structural system and the wind pressure distribution on the roof. Moreover, Jayasinghe (2012) found that the conventional connection tributary area used in normal design practice can be unreliable, and can lead to underestimation of the connection load. In cyclonic regions, the batten to truss connection may suffer from fatigue failure due to the battens’ locations experiencing the high wind load (Mahendran, 1995). 2.3.3.3 Roof to wall connection (RWC) The roof to wall connection (RWC) is another vulnerable structural component in the load path of a house structural system. This connection should provide a continuous load path from the roof to the wall. Discontinuity in the load path will cause severe damage to the roof structure in extreme windstorm events (Guha et al., 2012). Common RWCs are made by nails, metal plates and clips connected with nails. The RWC should be designed to resist the uplift load as well as the lateral load component. Several experimental studies and numerical analyses were conducted to evaluate the performance of RWCs (Guha et al., 2012; Shanmugam et al., 2009; Cheng et al., 2003; Reed et al., 1997; Morrison et al., 2012; Henderson et al., 2013; etc.). Some of these studies applied static loads and cyclic loads which were able to capture the hysteretic and normal behavior of the connections at low levels of deformation. Figures 2.6 and 2.7 show the roof loss due to RWCs failures during Cyclone Marcia. Figure 2.6 illustrates the roof to wall triple grip connection failure of the roof. The house’s open veranda roof structure was held by timber posts and the veranda region was exposed to the windward direction. During cyclone Marcia, the high wind speeds initiated the failure of the connection between the floor and timber post. The failure of this floor to the timber post’s connection created the cascading failure to the veranda RWCs, conveying it to the whole roof.. 17.
(39) Figure 2.6. Roof loss after failure of windward side timber post (located at veranda) connection at floor (Photo courtesy of CTS). Figure 2.7 shows the whole roof loss of a house during Cyclone Marcia. This is an old house where the roof structure’s cladding, battens, batten to truss connections and batten to cladding connections were replaced recently. The RWCs were not replaced or repaired and that resulted in the whole roof failure during Cyclone Marcia. These failures indicate poor construction practice and high gust wind speed increase the probability of these RWCs failures.. 18.
(40) Figure 2.7. Roof loss due to the RWCs failure (Photo courtesy of CTS). 2.3.3.4 Wall to foundation connection The major contribution of this type of connection in a timber-framed structural system is to transfer the total lateral and uplift loads from the wall to the foundation. Full-scale studies by Tuomi et al (1974) found that the wall to foundation connections needed strengthening to provide adequate racking resistance for houses. Removal of an entire house’s structural system is a result of the foundation failures in a windstorm (Walker, 1975). However, this type of failure due to windstorms is very rare for contemporary houses because the uplift on the roof and ceiling combination must be greater than the weight of the entire house. Moreover, it may happen only when the roof is well secured to the walls and without the walls being secured to the foundation (Liu, et al., 1989). Adequate anchorage of the structure to the foundation will reduce the wall to foundation connection failure.. 19.
(41) 2.4. Wind loading on houses. Fluctuating wind velocity in the approach flow, and the flow around the building generates a spatially and temporally varying pressure field on the external surface. This varying wind pressure generates fluctuating wind loads and fluctuating stresses on the structure (Holmes, 2002). The fluctuating pressure generally creates the high suction pressure found on a roof, especially on the roof corners and wall edges. Thus, it is essential to thoroughly understand the spatial and temporal characteristics of the pressure on this area. This fluctuating and increasing wind speeds can produce progressive damage to the timber-framed structures. Wind tunnel studies are the most common way to obtain pressure distribution on timberframed houses. The geometry of the roof is the main characteristic to dominate the pressure distribution of a house. Meecham et al (1991) indicated that the roof of a house should be designed based on the relationship between the pressure distribution and the underlying structural framing. In addition, their study found that the pressures on the full span trusses of the gable roof can be approximately twice those of the full span hip roof trusses at the same wind speed. Previous studies and research (Holmes, 1979; Uematsu et al., 1999; Stathopoulos et al., 1979; Vickery, 1986, 1991, 1992, 1994; Surry, 1991; Scruton, 1971; Kopp et al., 2008; Tieleman, et al., 1996; Ginger, 1997; McKinnon,2003; etc.) clearly show that the proper evaluation of internal and external pressure is important for calculating the wind load on the house, otherwise it will initiate damage on the vulnerable part of house structures (connections, roof, wall, ceiling, etc.). The internal pressure mainly depends on the external pressure and the sizes and positions of the openings in the envelope of the building. The failure of a door or window in a windstorm can produce a dominant opening and generate large internal pressures. This type of failure had been observed during the Cyclone Tracy (Walker, 1975), Cyclone that hit South India in November 1996 (Shanmugasundaram et al., 2000), when Hurricane Andrew hit the Florida District of the US in 1992 (Shanmugasundaram et al., 1995) and Cyclone Yasi (Boughton et al., 2011). Recent windstorm damage to contemporary houses in non-cyclonic regions of Australia indicates that the failures are mostly contributed by the high gust wind speed and internal pressure. Moreover, in non-cyclonic region houses are designed for low internal pressure (AS 4055, 2012); this highlights the magnitude of. 20.
Figure

+7
Related documents
