White Rose Research Online
[email protected]
Universities of Leeds, Sheffield and York
http://eprints.whiterose.ac.uk/
This is the author’s post-print version of an article published in
Weather, 68 (1)
White Rose Research Online URL for this paper:
http://eprints.whiterose.ac.uk/id/eprint/76589
Published article:
Baker, L, Martinez-Alvarado, O, Methven, J and Knippertz, P (2013)
Flying
through extratropical cyclone Friedhelm.
Weather, 68 (1). 9 - 13. ISSN
0043-1656
For Peer Review
Flying through extratropical cyclone Friedhelm
Journal: Weather
Manuscript ID: WEA-12-0075.R1 Wiley - Manuscript type: Research Article Date Submitted by the Author: n/a
Complete List of Authors: Baker, Laura; University of Reading, Meteorology
Martinez-Alvarado, Oscar; University of Reading, Meteorology Methven, John; University of Reading, Meteorology
Knippertz, Peter; University of Leeds, School of Earth & Env.
Keywords: extratropical cyclone, strong winds, sting jet, observations, windstorm
For Peer Review
Introduction
On 8 December 2011, an explosively deepening extratropical cyclone (also known as a low pressure system, depression or mid-latitude cyclone) passed across the UK, causing exceptionally strong winds over Scotland and strong winds over much of the UK. The low pressure system was named Friedhelm by the Free University of Berlin’s Adopt-a-Vortex scheme
(http://www.met.fu-berlin.de/adopt-a-vortex/). The extratropical cyclone deepened by 44 mbar in a 24 hour period, meaning that it more than satisfied the conditions for a “bomb” (Sanders and Gyakum, 1980), and its deepening rate puts it in the tail end of the distribution of explosive cyclones (Lim and Simmonds, 2002).
The most serious wind damage occurred in southern and central parts of Scotland, where it caused extensive disruption to roads and public transport, closure of airports and schools, and loss of power to thousands of homes. The strongest recorded gust was 165 mph at Cairngorm Summit (source:
http://www.metoffice.gov.uk/news/releases/archive/2011/research-flight), with gusts of over 80 mph in some more densely populated areas in Scotland.
The exceptionally strong gusts and the developmental structure of the system indicate that it may have contained a sting jet. The sting jet is a mesoscale jet that descends from the tip of the cloud head into the dry slot air ahead (Browning, 2004; Clark et al., 2005; Baker, 2009), which can cause strong and potentially damaging gusts at the surface.
Despite its disruptive and damaging strength, it was fortunate, from the scientific point of view, that this exceptional extratropical cyclone occurred during a 3-week field campaign period of the DIAMET (DIAbatic influences on Mesoscale structures in ExtraTropical storms) project. This made it possible for the Facility for Airborne Atmospheric Measurements (FAAM) BAe146 aircraft to be used to fly through the storm as it passed over the UK, taking measurements of key parts of the system. This was the first research flight ever to be designed specifically to take in-situ measurements of a potential sting-jet cyclone.
This article describes the objectives of this research flight and gives an overview of the obtained measurements. Several members of the DIAMET team were aboard the aircraft and photographs taken during the flight are shown to give a flavour of the cloud structures observed. For two of the authors (L. Baker and O. Martínez-Alvarado) this was their first research flight. Having the
opportunity to be involved in such a flight campaign is exciting in itself, but flying through such an exceptional storm that grounded many commercial planes was a truly unique experience.
The DIAMET project
DIAMET is a collaborative project involving researchers from the Universities of Manchester,
Reading, Leeds and East Anglia and the Met Office. DIAMET is funded by the United Kingdom Natural Environment Research Council (NERC) as part of the larger Storm Risk Mitigation project
(http://www.bgs.ac.uk/stormrm/home.html).
The aim of the DIAMET project is to improve the ability to forecast mesoscale structures of cyclonic storms at mid-latitudes. While cyclonic storms, such as the one described in this article, are generally forecast well at synoptic scales, smaller-scale details of the dynamics and physics within them, called 2
For Peer Review
mesoscale processes, are much more difficult to forecast accurately. Understanding these processes is vital in being able to forecast extreme events such as heavy rain and localised strong winds.
A key component of the DIAMET project is a series of four field campaigns, two in 2011 (September and November-December) and two in 2012 (May and July-August). These campaigns involve the use of FAAM, a modified BAe 146-301 large Atmospheric Research Aircraft (Figure 1). The aircraft contains instruments for taking in-situ measurements of atmospheric properties such as
temperature, pressure, wind speed and humidity, as well as more specialised instruments such as cloud imaging probes, broadband radiometers and turbulence probes. Dropsondes can also be released from the aircraft to record vertical profiles of the atmosphere.
Data recorded during the field campaigns, combined with high-resolution modelling, will help to improve our understanding and our ability to predict mesoscale processes within cyclonic storms. Other components of the project aim to improve existing data assimilation schemes and develop new data assimilation techniques.
Cyclonic structure and sting jet characteristics
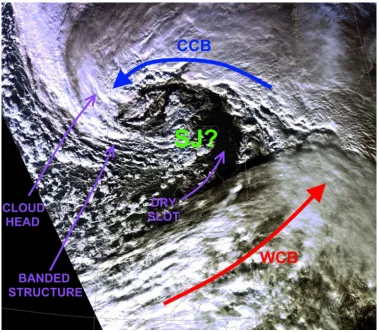
The extratropical cyclone Friedhelm was of particular interest because its development was similar to that of previously identified sting jet storms (e.g. Baker, 2009; Parton et al., 2009; Martinez-Alvarado et al., 2010). Sting jets descend from the tip of the cloud head, beneath the dry intrusion air ahead (Baker, 2009) (Figure 2), and can result in very strong low-level winds in a relatively localised region not associated with strong winds in more classical paradigms of extratropical cyclones (e.g. the conveyor-belt paradigm (Carlson, 1980; Browning and Roberts, 1994; Schultz, 2001)). These strong winds can cause potentially damaging surface gusts, the most extreme sting jet case being the Great Storm of October 1987, in which surface gusts of over 50 ms-1 were recorded (Browning, 2004; Clark et al., 2005). The sting jet is distinct from the jets associated with the warm and cold conveyor-belts, which are also known to produce strong surface winds, and from the descending dry intrusion air. While several sting-jet cases have been documented, as referenced above, there are so far no cases of confirmed sting-jet storms where in-situ measurements have been made within the developing cyclone. The passage of extratropical cyclone Friedhelm gave a rare opportunity for such measurements.
Synoptic analysis and forecast strong winds
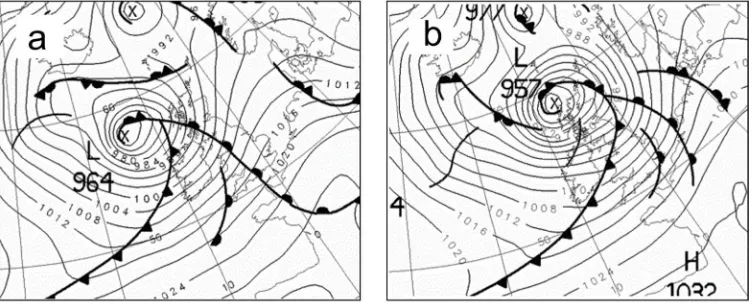
The location of the extratropical cyclone was well forecast by the Met Office several days in advance of its arrival over the UK, with the low pressure centre forecast to be just off the west coast of Scotland, approximately over the Isle of Lewis, at 1200 UTC 8 December in the 84-hour forecast. However, its intensity was underestimated in earlier forecasts, with a central pressure of 975 mbar predicted for 12 UTC 8 December in the 84-hour forecast, compared with 957 mbar in reality. The cyclone deepened rapidly as it approached the UK, with the central pressure dropping by 44mbar between 1200 UTC 7 December and 1200 UTC 8 December ( from 1001 mbar to 957 mbar). Figure 3(a) shows the 0600 UTC analysis chart on 8 December. At this time the cyclone was still out to the west of the UK. By 1200 UTC (i.e. during the DIAMET research flight), the low pressure centre was located approximately over Lewis (Figure 3(b)), as predicted in the forecasts.
For Peer Review
High-resolution forecasts using the Met Office’s UKV model, which has a horizontal grid spacing of 1.5km, started at 0300 UTC on 8 December showed wind speeds of over 60 kn (30 ms-1) off the west coast of Scotland at 1200 UTC, most likely associated with the cold conveyor-belt (Fig 4(a)). By 1500 UTC (Figure 4(b)), this forecast region of strong winds was located to the east of Scotland. While the wind speed appeared weaker than at 1200 UTC, wind gusts exceeding 75 kn (39 ms-1) were forecast over the ocean to the east of Scotland (not shown). The location of these strong winds ahead of the cloud-head tip suggests a possible connection with a sting jet. Further regions of strong winds (and co-located gusts, not shown) can be seen further north, near the top edge of Figure 4(b). This indicates that the cyclone has a strong cold conveyor-belt associated with the hooked cloud head, a common feature in observed sting jet storms (e.g. windstorm Gudrun, Baker (2009)). A further similarity between this case and observed sting jet cases is the banded structure towards the tip of the cloud head (Figure 2).
Flight details
The main aims of the flight were
1. to sample the banded structure in the cloud head and the “fingers” of cloud at the tip of the cloud head (see Figs. 2 and 7)
and
2. to take in-situ measurements of the low-level regions of strong winds that could be attributed to a sting jet.
The research aircraft was based at Exeter Airport during the field campaign. Since the location of interest was in the area around Scotland, the flight plan needed to be split into two parts. Originally the intention was to land and refuel at Aberdeen airport; however, due to the exceptionally strong winds in Scotland, many Scottish airports were forced to close, so it was necessary to refuel at Teesside Airport instead, which avoided the worst of the winds due to its location further south.
The first flight took off at 1030 UTC from Exeter Airport and headed north, just off the west coast of Scotland (Figure 5 (a)). The first part of the flight was designed to sample the region of relatively dry air just ahead of the cloud head tip, crossing the area where a sting jet may be evident as it descends from the cloud head tip. Ten dropsondes were released to provide vertical profiles of this region (Fig 5(a)).
We continued north, reaching the low-pressure centre, which by this time was located near the Isle of Lewis, at around 1230 UTC. From there we headed west, flying at around 7.4 km, above the top of the cloud head (Figure 5(b)). A further seven dropsondes were released, providing a transect across the cloud head and the cold conveyor-belt. These measurements sampled the banded structure in the cloud head (indicated in Figure 2), a feature often observed in satellite imagery of intense extratropical cyclones, but which has been rarely measured in such detail. These bands were visible from the aircraft (Figure 6). A distinct “wall” of cloud can be seen, corresponding to one of the cloud bands (the third from the cyclone centre) seen in the satellite image (Figure 2). When flying between the bands, it was sometimes possible to see right down to the surface, showing the vertical
orientation of the bands. 2
For Peer Review
The aircraft then headed back towards the storm centre, turning south after reaching Lewis. The purpose of the next part of this flight was to take in-situ measurements of the cloud bands near to the cloud-head tip. This involved descending and flying in three transects across the cloud bands at 3700m, 1500m and 700m (Figure 5(b)). The bands can be seen as “fingers” of cloud near the tip of the cloud head in the satellite image (Figure 7). Figure 8(a) shows a photograph taken during the descent to the low-level run, as we flew south off the west coast of Islay (an island off the west coast of Scotland), at about 2450m altitude. Figure 8(b) shows a photograph taken during the lowest-level run, at an altitude of 780m. The streaks in the sea surface are parallel to the direction of the
strongest winds (at this time recorded to be around 50 ms-1 at the altitude of the aircraft). It can be seen from the large white caps on the waves in this photo how rough the sea was below.
We then ascended to cruise altitude and headed towards Teesside Airport for a quick (and rather bumpy!) landing shortly after 1600 UTC. After refuelling we took off again at 1730 UTC for the second flight, this time heading north off the east coast of Scotland (Figure 5(a)). The purpose of this flight was to sample the dry intrusion air, ahead of the hooked-round tip of the cloud head, where strong low-level winds were forecast. Figure 9 shows the part of the cyclone sampled during this flight. The satellite image reveals that in the region crossed by the aircraft the cloud tops were at a lower level than those of the main part of the cloud head. Four dropsondes were released from an altitude of around 7300m as we headed north, with the aim of identifying the levels of the strongest winds. The strongest winds recorded by the dropsondes at this time were around 48 ms-1 (107 mph) at around 1400m altitude.
After turning back towards the south, the plane then descended and flew in three transects, approximately orientated north-south, at 3700m, 1900m and 840m. The purpose of this second set of low-level runs was to take in-situ measurements in this region of very strong winds, which could be due to a sting jet. The low-level section of the flight was even more turbulent than the earlier run since it was through such strong winds, but it was not possible to see how choppy the sea was since it was dark by this time. After this turbulent stretch, the aircraft ascended to cruise altitude and headed back to Exeter, landing shortly after 2100 UTC.
Concluding remarks
Several research groups within the DIAMET project are investigating this extratropical cyclone due to its remarkable characteristics. Preliminary analyses include comparisons between the data taken during the flight and forecasts from operational models. These comparisons show good agreement although there are differences in mesoscale details. For instance, the NAE (12km horizontal resolution) forecast (from analysis at 0600 UTC 8 December) has even stronger winds at low levels than recorded by the dropsondes at 1200 UTC. Preliminary analyses seem to show strong winds descending from the cloud head into the region normally associated with sting jets. These winds would be consistent with the hypothesis of sting jets embedded within this system. If this is
confirmed, it would be the first time that a research flight has taken in-situ measurements of a sting jet within an extratropical cyclone.
For Peer Review
Research groups at the Universities of Leeds and Reading are performing new simulations (hindcasts) of the extratropical cyclone using two different numerical weather prediction models. The team at the University of Leeds is using the Weather Research and Forecasting (WRF) model to look in detail at the influence that several parameterisations of large-scale cloud and precipitations have on the extratropical cyclone’s development. Researchers at the University of Reading are using the Met Office Unified Model to investigate several aspects of the development of sting jets during the cyclone’s life-cycle. Furthermore, researchers at the Met Office are investigating the
predictability of this kind of storm by means of high-resolution ensemble modelling using the MOGREPS-UK ensemble at 2.2km resolution.
Acknowledgements
We gratefully acknowledge funding for this flight as part of the DIAMET field campaign, through NERC. We also thank all members of the DIAMET team for their contributions to the field campaign and observations. We would also like to thank the staff at FAAM and the crew both on the aircraft and on the ground during this flight for enabling us to fly through such an exceptional case in such severe weather conditions.
References
Baker, L. H. (2009). Sting jets in severe northern European wind storms. Weather, 64, 143–148. Browning, K. A. (2004). The sting at the end of the tail: Damaging winds associated with extratropical cyclones. Q. J. R. Meteorol. Soc., 130, 375–399.
Browning, K. A. and Roberts, N. M. (1994). Structure of a frontal cyclone. Q. J. R. Meteorol. Soc., 120, 1535-1557.
Carlson, T. N. (1980). Airflow through midlatitude cyclones and the comma cloud pattern. Mon. Weather Rev., 108, 1498–1509.
Clark, P. A., Browning, K. A., and Wang, C. (2005). The sting at the end of the tail: Model diagnostics of fine-scale three-dimensional structure of the cloud head. Q. J. R. Meteorol. Soc., 131, 2263–2292.
Lim, E.-P. and Simmonds, I. (2002). Explosive cyclone development in the southern hemisphere and a comparison with northern hemisphere events. Mon. Weather Rev., 130, 2188-2209.
Martínez-Alvarado, O., Weidle, F., and Gray, S. L. (2010). Sting jets in simulations of a real cyclone by two mesoscale models. Mon. Weather Rev., 138, 4054–4075.
Parton, G. A., Vaughan, G., Norton, E. G., Browning, K. A., and Clark, P. A. (2009). Wind profiler observations of a sting jet. Q. J. R. Meteorol. Soc., 135, 663–680.
Sanders, F. and Gyakum, J. R. (1980). Synoptic-dynamic climatology of the ‘bomb’. Mon. Weather Rev., 108, 1589–1606.
Schultz, D. M. (2001). Reexamining the cold conveyor belt. Mon. Weather Rev., 129, 2205-2225. 2
For Peer Review
Figure 1: DIAMET scientists and FAAM staff preparing to board the research aircraft. Photo by Laura Baker. 914x685mm (72 x 72 DPI)
For Peer Review
[image:9.612.117.496.111.443.2]Figure 2: Visible satellite image at 1226 UTC 8 December 2011 with key features marked. Thick arrows indicate the approximate locations of the warm conveyor-belt (labelled WCB) and cold conveyor-belt (labelled CCB). “SJ?” indicates the location in which a sting jet could occur. Original satellite image courtesy
of NERC Satellite Receiving Station, Dundee University, Scotland (http://www.sat.dundee.ac.uk/). 54x47mm (300 x 300 DPI)
For Peer Review
Figure 3: Met Office surface analysis charts at (a) 0600 UTC and (b) 1200 UTC 8 December 2011. Crown copyright.
157x104mm (300 x 300 DPI)
For Peer Review
Figure 4: Met Office UKV forecasts starting at 0300 UTC 8 December. Panels show 10m wind speeds forecast for (a) 1200 UTC and (b) 1500 UTC. Images courtesy of the Met Office. Crown Copyright.
222x158mm (300 x 300 DPI)
For Peer Review
(a)
(b)
http://mc.manuscriptcentral.com/weather
For Peer Review
Figure 6: Photographs taken during the flight, as the plane flew over the bands near the tip of the cloud head. (a) Taken at 1313UTC from a side window (looking south-east) and (b) taken at 1317UTC through the
front window (looking west) (at positions labelled 1 and 2 in Fig. 5(a)). (a) taken by Peter Knippertz. (b) by John Methven.
571x831mm (300 x 300 DPI)
For Peer Review
Figure 7: Visible satellite image at 1404UTC 8 December 2011. The red circle highlights the location of the cloud bands crossed by the aircraft. Note that this image is almost an hour earlier than the time that the aircraft crossed the bands but the blue line marks the approximate position of the transects relative to the
cloud bands. Original satellite image courtesy of NERC Satellite Receiving Station, Dundee University, Scotland (http://www.sat.dundee.ac.uk/).
36x37mm (300 x 300 DPI) 2
For Peer Review
Figure 8: Photographs taken during the low-level flight leg (at positions labelled 3 and 4 in Fig. 5(a)). (a) Taken at 1503 UTC at 2450m altitude during the first transect. The land is the west coast of Islay (an island
off the west coast of Scotland). (b) Taken at 1518 UTC at 780m during the final, lowest-level transect. Photos taken by Peter Knippertz from a side window of the aircraft (both looking east).
1092x1593mm (600 x 600 DPI)
For Peer Review
[image:16.612.251.361.112.225.2]Figure 9: Infra-red satellite image at 1942UTC 8 December. The red line shows the position of the low-level section of the flight relative to the system, with the locations of the dropsondes shown by green dots.
Original satellite image courtesy of NERC Satellite Receiving Station, Dundee University, Scotland (http://www.sat.dundee.ac.uk/).
12x12mm (300 x 300 DPI)