This is a repository copy of Surface water quality. White Rose Research Online URL for this paper: http://eprints.whiterose.ac.uk/81153/
Version: Accepted Version
Book Section:
Chapman, PJ, Kay, P, Mitchell, GN et al. (1 more author) (2013) Surface water quality. In: Holden, J, (ed.) Water resources: an integrated approach. Routledge , 79 - 122. ISBN 0415602823
[email protected] https://eprints.whiterose.ac.uk/ Reuse
Unless indicated otherwise, fulltext items are protected by copyright with all rights reserved. The copyright exception in section 29 of the Copyright, Designs and Patents Act 1988 allows the making of a single copy solely for the purpose of non-commercial research or private study within the limits of fair dealing. The publisher or other rights-holder may allow further reproduction and re-use of this version - refer to the White Rose Research Online record for this item. Where records identify the publisher as the copyright holder, users can verify any specific terms of use on the publisher’s website.
Takedown
If you consider content in White Rose Research Online to be in breach of UK law, please notify us by
Chapter 4
SURFACE WATER QUALITY
1
Pippa J Chapman, 1Paul Kay, 1Gordon Mitchell and 2Colin Pitts
1
water@leeds, School of Geography, University of Leeds
2
water@leeds, School of Earth and Environment, University of Leeds
Learning objectives
After reading this chapter you should be able to:
Understand the natural factors that control surface water chemistry
Understand how spatial and temporal patterns in surface water chemistry occur
Explain how water use by humans leads to a deterioration in water quality
Define the different sources of pollution to surface waters
Explain how changes in agricultural practices and urbanization affect water quality
Discuss the causes of acid rain and acid mine drainage, and their impact on water
quality
Understand the role of national and international polices and legislation in reducing
water pollution
4.1 Introduction
Surface waters refer to rivers, streams, lakes, ponds and reservoirs. When rain falls on the
land it either seeps into the ground to recharge groundwater aquifers (see Chapter 5) or
becomes runoff which flows downhill over and through the soil into streams, rivers, ponds
and lakes (see Chapter 3). However, surface water bodies do not just receive water from
generally increases during periods of low flow. Streams and rivers form where surface water
accumulates and flows from land of higher altitude to lower altitude on its journey towards
the oceans. Lakes or ponds form where surface runoff accumulates in a flat area, relative to
the surrounding land, and the water entering the lake or pond comes in faster than it can
escape, either via outflow in a river, seepage to groundwater, or by evaporation. This means
that lakes and ponds are standing or very slow moving bodies of water while rivers and
streams are distinguished by a fast-moving current. While most lakes contain freshwater,
some, especially those where water cannot escape via a river, are salty). In fact, some lakes
are saltier than the oceans (see also Chapter 3, section 3.3.2 on closed basins). The terms
‘lakes and ponds’ and ‘rivers and streams’ are often used interchangeably, because in reality
there is no obvious distinction between them, although the latter term is typically used when
describing a ‘smaller’ standing body of water or running water course, respectively.
Reservoirs, also called impoundments, are human-made lakes. However, they can display
characteristics of both rivers and lakes because they are created by building a dam across a
river and flooding the valley. This damming and flooding creates an artificial lake, filled by
the river inflow.Thus the upstream section of the reservoir has predominantly river-like
qualities, meaning there is often still some current, while the area closest to the dam is more
lake-like.
Stream and river networks drain more than 75 % of the Earth’s land surface. The
precipitation that falls on the land percolates over and through vegetation and soil picking up
solutes (dissolved matter) and sediment along its route to surface waters. Runoff delivers
different amounts of solutes and sediment to rivers depending on the hydrological pathway
it has taken through the catchment and the characteristics of the surrounding landscape (see
river’s basin. Thus any changes that occur in the catchment also lead to a change in surface
water chemistry. River systems also provide a vital linkage between the terrestrial and aquatic
ecosystems. Thus streams and rivers have been referred to as “the environment’s circulatory
system” (Wetzel, 2001).
This chapter will first consider the natural processes and factors that control the spatial and
temporal patterns of surface water chemistry before considering how water use by humans
impacts upon water quality. In particular, it will explain how changes in agriculture practices
and urbanisation affect water quality and the mitigation factors that are being used to try and
reduce water pollution from these sources. This chapter also describes the causes of acid
mine drainage, its impact on water quality and mitigation options that exist. The causes of
acid rain, its impact on water quality and the how legislation in Europe and North America
has lead to the reduction in acid rain are discussed. Finally the chapter will look at the role of
national and international polices and legislation in reducing water pollution and how climate
change and population growth may affect surface water quality in the future.
4.2 Characteristics of surface waters
It is important to understand the natural processes that control surface water chemistry before
exploring the affect of human activities on water quality. The concentration and form of
chemical elements and compounds are constantly changing as a result of hydrological,
physical, chemical and biological processes. This section briefly discusses the roles of these
processes in controlling surface water chemistry.
Precipitation falling on the land takes a variety of different routes, known as hydrological
pathways, through the catchment to reach surface waters as shown in Figure 4.1.
Precipitation, which has low solute concentrations, may flow downhill over the soil surface,
as infiltration-excess overland flow (see Chapter 3), or rapidly through the soil via
macropores to reach rivers and lakes. As the residence time of this water within the
catchment is short, the solute concentration of this runoff is usually very similar to that of
precipitation. Alternatively precipitation may flow through the soil horizons, where the
residence time is longer, before reaching surface waters and solute concentrations increase
due to inputs from weathering reactions and microbial activity. Sometimes when the soil is
saturated then saturation-excess overland flow occurs (see Chapter 3) and this water can be
a mix of fresh precipitation and water which has more solutes from within the soil. Lastly
precipitation may percolate through the soil into the bedrock below, if it is permeable. At a
certain depth below the land surface, called the water table, the ground becomes saturated
with water, whereas the ground above the water table is unsaturated. If a river cuts into this
saturated layer, as shown in Figure 4.1, then water may flow out of the groundwater into the
river. This is why even during dry periods there is usually some water flowing in streams and
rivers. In addition, due to the longer residence time of this pathway, groundwater tends to be
enriched in solutes derived from weathering reactions.
4.2.1 Chemistry
All surface waters contain dissolved (solutes) and suspended (particulate) inorganic and
organic substances. The distinction between dissolved and suspended substances is based on
filtration, usually through a 0.45 m membrane filter although other size filters are also used.
Particulate matter can impact the turbidity (a measure of the amount of suspended particles
impact aquatic life as it reduces the opportunity for photosynthesis and impacts animals and
plants in the water. Chapter 6 describes such impacts of turbidity changes in more detail.
When some compounds (mainly inorganic) dissolve in water they break down (dissociate) to
form ions, for example, NaCl (sodium chloride) added to water produces Na+ + Cl- ions (see Chapter 1). Ions are charged atoms or molecules caused by having an unequal number of
protons (positively charged) and electrons (negatively charged); positively and negatively
charged ions are normally attracted to each other. Cations are positively charged as they have
more protons than electrons. Anions are negatively charged ions. Some elements and ions are
very soluble, while others have a strong affinity to stay as particulate matter or become
attached to suspended matter.
The major dissolved ions in surface waters, which occur at concentrations exceeding 1 mg L
-1
, are bicarbonate (HCO3-), sulphate (SO42-), chloride (Cl-), calcium (Ca2+), magnesium
(Mg2+), sodium (Na+) and potassium (K+). In fact these seven ions along with silica (which occurs as Si(OH)4 at the pH of most natural waters) constitute ~95% of the total dissolved
inorganic solutes in surface waters. This reflects their relative abundance in the Earth’s crust
and the fact that they are moderately to very soluble. In contrast, the metals and metalloids,
which occur at much lower concentrations, are generally found in or bound to the particulate
matter in surface waters.
[Insert Figure 4.2 near here]
Some elements exist in a number of different forms while others occur in more than one
oxidation state. For example, the most common ionic forms of dissolved inorganic nitrogen
in aquatic ecosystems are ammonium (NH4+), nitrite (NO2-) and nitrate (NO3-), while iron can
element is mainly controlled by environmental factors, particularly pH and redox potential
(see Box 4.1 for definitions of these terms), and has an important control on the solubility and
toxicity of an element. The influence of pH and redox potential on the oxidation state and
hence form of solute in freshwaters is illustrated for iron in Figure 4.2. It can be seen that
soluble Fe2+ occurs in highly acidic, but well oxidized waters, such as acid mine drainage, and also waters of neutral pH and reducing conditions. However, at neutral pH and oxidizing
conditions Fe2+ is converted to the insoluble Fe3+, in the form of iron hydroxide (Fe(OH)3).
Therefore the iron will precipitate out of solution to become solid matter within the water.
This is what occurs when acid mine drainage mixes with surface waters of a higher pH and
the iron hydroxide can be observed as a red precipitate on the bed of the river (see Figure
4.13). Other major elements found in surface waters that are strongly influenced by redox
reactions are carbon, nitrogen, sulphur and manganese.
Box 4.1
TECHNIQUES
pH and redox potential
Whether a water body is acidic, neutral or alkaline is determined by measuring the hydrogen ion concentration
in solution. In pure water at 24oC, water ionizes (forms ions) to give equal concentrations of hydrogen (H+) and
hydroxide (OH-) ions: H2O «» H+ + OH-. The concentration of both H+ and OH- ions is 1 x 10⁻⁷ (0.000 000 1)
moles per litre. To overcome using these very small concentrations of H+ ions, a simpler method of using the
negative logarithmic of the hydrogen ion concentration was developed, known as pH: pH = -log10 [H+].
Although the pH scale ranges from 1 to 14, with low values the most acidic and high values the most alkaline,
most surface waters have a pH range of 4 to 9. As the pH scale is logarithmic it should be remembered that a
change of one unit represents a 10-fold change in H+ ion concentration.
A redox reaction is one where the oxygen state of the substance is changed. For example, a redox reaction
occurs when carbon reacts with oxygen to become carbon dioxide. Oxidation involves the increase of oxidation
state of a substance (such as in carbon to carbon dioxide) and is associated in a loss of electrons. Reduction is
the reverse case. Redox potential (also known as oxidising or reducing potential or Eh) is a measure (in volts) of
the tendency of a substance to acquire electrons compared with a standard. The standard used is hydrogen and
As the redox potential decreases, the solution is more reduced (i.e. has more electrons to give) and as the redox
potential increases, the solution is more oxidized (i.e. will accept more electrons).
The sum of all the dissolved solutes plus silica (SiO2) present in a water body is known as the
total dissolved solids (TDS). The TDS can be determined gravimetrically by evaporating a
known volume of water and measuring the mass of the residue left. Alternatively it can be
determined by the measurement of electrical conductivity as the dissolved ions present in the
water create the ability for water to conduct an electric current. When correlated with
gravimetric measurements of TDS, conductivity provides an approximation of the TDS
concentration of a water sample. However, in very low electrical conductivity waters where
the TDS is small such as in some peatland streamwaters, a conductivity meter will not work
because an electrical circuit will not be completed. Total dissolved solids in streams and
rivers can vary between 50 and 1000 mg L-1, which is at least 20 times the concentration in rain water (Meybeck et al., 1996). In lakes with outlets, TDS are similar to streams and
rivers, whereas for lakes without outlets, TDS can range from 1000 to 100 000 mg L-1
(Meybeck et al., 1996). Most bottles of mineral water will indicate the value of TDS on their
label. Try comparing different brands in relation to the source of the water.
The Biochemical Oxygen Demand (BOD) is a commonly measured feature of water quality
in surface waters. It equates to the amount of dissolved oxygen (in milligrams) needed by
biological organisms in a water body so that they can break down organic matter in a sample
of water (normally 1 litre) over a set time period (normally 5 days) for a given temperature
untreated sewage might have a BOD of 50-500 mg L-1 (see section 9.3.1 In Chapter 9). If there is a discharge of organic pollutants into a river the oxygen concentration will quickly
drop which might result in death of many aquatic animals that need to extract oxygen from
the water to survive. This drop of dissolved oxygen concentration after a pollution incident is
often known as a sag curve and is shown in Chapter 9 (Figure 9.5). Useful methods for
measuring BOD can be found at http://water.epa.gov/type/rsl/monitoring/vms52.cfm.
Another variation of the BOD is the sediment oxygen demand (SOD) which is the usage of
dissolved oxygen in the overlying water by sediment chemicals and organisms that live in the
sediment on the bed of the water body. Such organisms include burrowing fauna, worms,
insect larvae, bacteria, protozoa and fungi. To measure SOD, sediment cores are normally
extracted and then oxygen use is measured in the laboratory over a certain period of time at a
controlled temperature.
The Chemical Oxygen Demand (COD) is another measure of pollution by organic
compounds but one which tests the chemical demand for oxygen within the water body
without including the biological processing. The COD is a measure of the amount of
dissolved oxygen needed to oxidise the organic matter within a litre of water using a standard
chemical oxidizing agent. COD is measured in milligrams of oxygen per L of water and is
more commonly used in testing wastewater than surface waters in rivers and lakes.
4.2.2 Hydrological processes
Surface water chemistry is strongly influenced by the hydrology of a water body. The
residence time of water in streams and rivers usually ranges between two to six months, while
stream flow is unidirectional, usually with good lateral and vertical mixing, but may vary
greatly depending on climatic conditions and season. In general, the higher the annual runoff
of a river the lower the concentration of solutes, and hence TDS, in a river (Figure 4.3a). This
inverse relationship can be explained simply by the dilution of the available solutes as surface
runoff volumes increase. However, as the volume of runoff increases so does the total amount
of solutes released from the catchment and hence available for transport (Figure 4.3b). This is
known as the solute load or flux and is determined by multiplying the solute concentration
by the discharge at a specific location on a river at a certain time. To calculate the annual load
of a specific solute, continuous measurements of discharge and concentration are required.
However, while discharge can be measured regularly, solute concentration is usually
measured less frequently, due to the expense of collecting and analysing water samples. This
means that solute concentration must be estimated between sampling periods. Several studies
have compared different methods for estimating solute and sediment loads (e.g. Littlewood,
1992; Webb et al., 1997) and have found that regular monitoring programmes tend to
over-emphasise base flow components which is compounded the longer the time interval between
samples. Webb et al. (1997) investigated the effect of different methods to estimate chemical
fluxes for the River Derwent in Yorkshire, UK, and found that for 20 out of the 36
determinands investigated, the difference between the minimum and maximum load estimate,
expressed as a percentage of the minimum value, exceeded 50%, and for five determinands,
the difference was greater than a 100%.
[Insert Figure 4.3 near here]
In catchment studies, the annual dissolved load serves as an integrated measure of all the
processes that occur within the river basin that affect stream water chemistry. While
a specific point in time and is useful for comparing with water quality standards, solute loads
can be used to quantify the amount of solute entering a specific water body, such as a lake or
ocean, from terrestrial sources or the impact of environmental changes on the terrestrial cycle
of nutrients. In order to compare solute loads from catchments of different size the load is
divided by the area of the catchment and is generally expressed in tonnes per km2 per year (which is equivalent to g m-2 yr-1) (see Box 4.2).
Box 4.2
TECHNIQUES
Calculating solute loads for Eagle Creek, Indiana
Table 4.1 shows some example data for stream discharge and nitrate concentrations at hourly intervals
for Eagle Creek at Zionsville in Indiana which were obtained from the USGS database which is a
public domain source. Data are for one day in January 2013. The drainage area is 274.5 km2. We
would like to determine the total flux of nitrate from the catchment and, so we can fairly compare it to
data from other sites, to calculate the solute load for the day per unit catchment area.
Table 4.1 Nitrate-N concentrations and discharge for a 24 hour period 2-3 January 2013 for Eagle
Creek, at Zionsville, Indiana.
Time
Discharge m3 s-1
Nitrate-N, mg
L-1
18:00 2.18 3.22
19:00 2.15 3.31
20:00 2.10 3.34
21:00 2.18 3.39
22:00 2.35 3.36
23:00 2.29 3.39
00:00 2.29 3.39
01:00 2.35 3.40
02:00 2.38 3.36
03:00 2.55 3.37
04:00 2.55 3.40
05:00 2.61 3.42
06:00 2.61 3.45
08:00 2.80 3.48
09:00 2.97 3.40
10:00 3.14 3.45
11:00 3.37 3.47
12:00 3.60 3.40
13:00 3.09 3.36
14:00 2.61 3.37
15:00 2.10 3.45
16:00 1.95 3.50
17:00 2.01 3.60
Multiplying the discharge value for each hour by the number of seconds in each hour gives us an
estimate of total discharge in that hour in m3. In order to put everything in the same units we can
divide the concentration of nitrate by 1000 to express it as mg per m3 of water (since there are 1000
litres in a m3). If we then assume that the concentration of nitrate applies for the whole hour then
multiplying that concentration by the total discharge for the hour we end up with a value of mg of
nitrate that has moved passed the gauging point on the river. Taking the first row of data from Table
4.1 as an example gives us 7849.4 m3 of water for that hour (multiply 2.18 m3 s-1 by 3600 s). If we
multiply 0.0032 mg m-3 of nitrate by 7849.4 m3 of water we obtain a total flux for the hour of 25.3 mg
of nitrate. Repeating this for each hour and summing the total provides us with an estimate of 747 mg
of nitrate for the 24 hour period shown in the table. As the catchment area is 274.5 km2 we can
suggest that for one 24 hour period the nitrate flux from Eagle Creek was equivalent to 2.7 mg km-2.
This is a very low value (equivalent to under 1 g km-2 yr-1, but the sampling occurred in a cold winter
month when there is some frozen ground and we only used one day as an example. Obviously we
could repeat this for the whole year quite easily in a spreadsheet to provide a more realistic annual
flux estimate.
In many cases we do not have data at such high frequency as presented above. While we might have
good discharge data collected at high frequency (e.g. every 15 minutes) often water quality samples
for different solutes are taken once per week or sometimes less frequently, occasionally supplemented
by sampling during some storm events. In these instances it is not suitable simply to multiply
discharge at the time of sampling by concentration of the solute and then sum the values. That is
and concentrations might be quite different). Therefore we need to interpolate values between sample
points to produce a value of annual solute load. The methods most commonly used vary depending on
what data is available and are described in Walling and Webb (1985).
Lakes and reservoirs are characterised by alternating periods of stratification and vertical
mixing which has an effect on water chemistry. Stratification in lakes or reservoirs occurs
when the water acts as two different bodies with different densities, one floating on the other.
It is most commonly caused by temperature differences within the water column, particularly
in deep (> 10 m) temperate lakes and reservoirs because of seasonal changes in temperature.
It is less common in tropical lakes where temperature varies little over the year. Stratification
results in different processes dominating in the different layers of the lake. In temperate
regions during the summer, the surface layer, known as the epilimnion, receives more
sunlight, is warmer and has an oxidizing environment because it is exposed to the
atmosphere. In contrast, the deeper layer, known as the hypolimnion is separated from the
epilimnion by a thermocline (see Chapter 6). Due to the isolation of the hypolimnion from
the atmosphere, it is cooler and receives less oxygen leading to anoxic conditions developing
in the lake bottom sediments. This gradient of dissolved oxygen means that elements that
have more than one oxidation state occur in the oxidised state in the epilimnion and the
reduced form in the hypolimnion (Figure 4.4). Thus stratification of reservoirs can lead to
concentrations of iron and manganese exceeding drinking water quality standards. This is
because the reduced forms of these metals are much more soluble than the oxidised forms.
Therefore the metals within the sediments on the reservoir bottom will leach out and dissolve
in the water and if water is abstracted from the hypolimnion in the reservoir then high
concentrations of dissolved lead and manganese will be found in the abstracted water.
Reflective question
What is a redox reaction?
4.3 Spatial variation in surface water chemistry
In natural conditions, the chemistry of surface waters is controlled by three main processes
(Gibbs, 1970; Meybeck et al., 1996; Walling and Webb, 1986): (i) atmospheric inputs, (ii)
weathering of bedrock and (iii) climate (evaporation-crystallisation processes). The main
source of atmospheric inputs is from oceanic aerosols (Na and Cl), however other sources
include volcanic emissions (such as SO2), and dissolution of soil-derived particulates (such as
Ca, HCO3 and SO4). The distance from the ocean will determine the extent to which
sea-spray rich in Na, Cl, Mg and SO4 influences surface water chemistry. In coastal areas, where
oceanic inputs may dominate over all other sources, Na and Cl are the most abundant solutes
in surface waters. These solutes may also dominate in areas where rocks are extremely
resistant to weathering, such as in central Amazon.
In nearly all major rivers of the world, calcium is the dominate cation and bicarbonate the
major anion. In fact, 80% of the dissolved load of the major rivers of the world is made up of
just four solutes; calcium, bicarbonate, sulphate and silica (Walling and Webb, 1986). The
major source of these solutes is the weathering of bedrock. The susceptibility of rocks to
weathering varies from low for plutonic and metamorphic crystalline rocks to high for
sedimentary rocks such as limestone and chalk. Thus TDS in rivers and streams draining
catchments underlain by sedimentary rocks are five times greater than in rivers draining
catchments dominated by crystalline rocks and about two and a half times greater than
rock type is very homogeneous, such as the Canadian and African shields and the Amazon
and Congo basins, stream water chemistry may vary very little over large areas. In contrast,
stream water chemistry can be highly variable in areas where geology varies on the finer
scale. Overall, approximately 60 % of all the solutes present in surface waters are derived
from the weathering of rocks (Walling and Webb, 1986).
The influence of climate on surface water chemistry is very important at the global scale. As
well as controlling the rate of weathering, through its influence on temperature and water
availability, climate controls the water balance. In areas where evaporation exceeds
precipitation, solutes derived from both weathering and atmospheric inputs are gradually
concentrated. If evaporation is high enough, some minerals will start to precipitate, such as
calcite (CaCO3) and dolomite (MgCO3). The precipitation of minerals results in the surface
waters containing lower concentrations of Ca and HCO3 and higher concentrations of Na, Cl,
Mg and SO4. In contrast, in areas where annual rainfall is high, the concentration of solutes in
surface waters is diluted.
It has been proposed that because the above three processes influence the concentration of the
major solutes in different ways, the relative abundance of the dominant cation and anion can
be used to evaluate which of the processes is most significant in controlling surface water
chemistry (Figure 4.5). High concentrations of Na and Cl, with low TDS, are observed in wet
coastal regions where atmospheric inputs are the dominant source of solutes and inputs
derived from weathering are low. Sodium and Cl can also dominate in semi-arid areas where
evaporation-crystallization processes dominate resulting in very high TDS. However, Gibb
(1970) found that most surface waters were dominated by Ca and HCO3 derived from the
findings of Meybeck (1981) in his survey of global rivers (representing about 60 % of the
water discharge to the oceans), where he observed that 97 % of rivers were dominated by Ca
and bicarbonate and that Na was the dominant cation in only 1.7 % of rivers and Cl and SO4
were dominant in just over 1 % of rivers. Thus the classification of Gibbs (1970), although
attractive in its simplicity, is of limited value. In addition, other surface waters deviate from
the plot in Figure 4.5, due to extreme geological or climatic conditions. For example, very
acidic waters are often found in active volcanic regions or in sedimentary rocks rich in metal
sulphides.
[Insert Figure 4.5 near here]
Reflective question
Are TDS in surface waters likely to be greater or smaller in warmer, drier climates than
elsewhere?
4.4 Temporal variations in surface water chemistry
Surface water chemistry varies over time for two main reasons. Firstly the processes
controlling the supply of solutes available for leaching vary over time and secondly the
hydrological processes that generate runoff within a catchment are dynamic and vary with
climate and season. The major temporal patterns in surface waters can be considered at the
following timescales:
1. During storms (hours) as a result of changes in hydrological flowpaths delivering
different sources and amounts of solutes.
2. Diurnal (24-hour) variations in for example pH and dissolved oxygen, resulting from
biological processes and changes in daylight.
3. Seasonal variations associated with biological and hydrological cycles.
Fluctuations in dissolved oxygen concentration and pH are primarily related to
photosynthesis and aerobic respiration of aquatic plants. Photosynthesis, which is driven by
sunlight, removes carbon dioxide (CO2) from the water and produces free oxygen, which
causes an increase in surface water pH and dissolved oxygen. However, stream water pH and
dissolved oxygen concentrations are also affected by changes in air pressure and temperature.
The solubility of gases increases as air pressure increases; this can influence the pH of water,
as more CO2 will dissolve in the water as air pressure rises. In contract, increases in
temperature reduce the solubility of most gases; cold water can hold more dissolved oxygen
than warm water. Therefore the dissolved oxygen content of surface water has both a
seasonal and diurnal cycle, as shown in Figure 4.6. This diurnal variation in dissolved oxygen
is not generally observed from collecting regular water samples as this typically occurs in the
daytime. However, the use of continuous monitoring probes has enabled these small diurnal
variations to be clearly observed (Figure 4.6).
[Insert Figure 4.6 near here]
During storms, changes in dominant hydrological flowpaths though the catchment (Chapter
3) can lead to large changes in solute concentrations, over relatively short periods of time.
For some solutes, an increase in river discharge can lead to an increase in concentration as
solutes are moved rapidly into the river by overland flow and shallow throughflow. For
example, dissolved organic carbon (DOC) concentrations can increase with stream discharge
during storms in some catchments (Chapman et al., 1993; Hinton et al., 1992; Figure 4.7a).
This reflects the change in hydrological flowpaths with more flow through the upper organic
surface soil horizon in the catchment where DOC is produced. In contrast, other solutes that
surface waters by deep soil throughflow and groundwater display a negative relationship with
discharge during storms (Figure 4.7b) as their concentrations are diluted by surface runoff.
[Insert Figure 4.7 near here]
Many solutes display strong seasonal patterns (Figure 4.8). These patterns can be divided into
those that are controlled by seasonal changes in hydrology and those that are mediated by
biological processes. In streams and rivers, pH and concentrations of Ca and Mg often
display a maximum in summer and minimum in winter, which reflects seasonal changes in
the dominant source of water (Figure 4.8a). In summer, groundwater enriched in base cations
often dominates stream flow, whereas in winter soil water and surface runoff, that is more
acidic and contains lower concentrations of base cations, dominates. In natural waters, nitrate
(NO3) and potassium (K) also display strong seasonal patterns with a summer minima and
winter maxima (Figure 4.8b). This reflects seasonal changes in the availability of these
nutrients for leaching as plant uptake during the summer reduces the concentration of these
nutrients in soil solution. Dissolved organic carbon (DOC) is also strongly mediated by
biological processes; being produced via the decomposition of organic matter during summer
and washed from the soil during the autumn. Hence DOC displays a maximum in late
summer and autumn and a minimum in early spring (Figure 4.8c).
[Insert Figure 4.8 near here]
Long-term patterns in surface water chemistry are usually driven by climatic variability, and
anthropogenic activities, such as changes in land management or atmospheric pollution.
However, it is often difficult to identify the main driver of change as many of these factors
are changing at the same time or the record of solute concentration (often referred to as a
needed in interpretation of ‘long-term’ river and lake water chemistry and that misleading
conclusions may be drawn from data sets of 10 years or less (e.g. Burt et al.,1988; Driscoll et
al., 1989). For example, analysis of stream water NO3 concentrations from the Hubbard
Brook Experimental catchment, northeast United States, for the period 1964-1974 suggested
a strong increasing trend (Liken et al., 1977). However, no long-term trend was observed in
the data set for the period 1964-1987 (Driscoll et al., 1989). This illustrates the importance of
maintaining long-term sites and networks of surface water chemistry.
Long-term records of surface water NO3 concentrations for semi-natural catchments
generally show no evidence of time trends, despite an increase in atmospheric nitrogen
deposition at many of these sites caused by air pollution. However, peak winter
concentrations do vary markedly between years (e.g. Reynolds et al., 1992; Mitchell et al.,
1996). This variability has been explained by inter-annual variation in climatic factors,
including drought, summer temperature and winter freeze-thaw. For upland lakes and streams
across the UK, Monteith et al. (2000) observed that the mean December-March North
Atlantic Oscillation (NAO) index (a measure of large scale climate conditions a bit like the
El Nino Southern Oscillation) was a good indicator of peak NO3 concentration. Highest peak
NO3 concentrations were observed when the NAO values were lowest, which indicates drier,
colder weather in north-west Europe. Therefore, Monteith et al. (2000) suggested that
freezing of the soil leads to the death of some of the soil microbial biomass and damage to
plant roots and subsequent thawing leads to the release of this material available for
mineralization and leaching to surface waters.
In the 1980s and 1990s, many countries set up atmospheric and stream or lake monitoring
stations on improving air and water quality. Although atmospheric SO4 deposition has
declined rapidly across North America and Europe over the last 20 years (e.g. Jeffries et al.,
2003; Forsius et al., 2003; Fowler et al., 2005) surface water acidification remains an issue,
despite many studies observing a decline in stream water SO4 concentrations (Stoddard et al.,
1999; Davis et al, 2005; Skjelkvale et al., 2005; Burns et al., 2006; Figure 4.9). This lag in
surface water acidification recovery has been attributed to a range of processes, including
deposition of N remaining high, depletion of base cations and increase in dissolved organic
carbon (DOC) concentrations. This demonstrates the long-term influence of biogeochemical
processes occurring within a catchment on surface water chemistry.
[Insert Figure 4.9 near here]
Reflective question
Ignoring human influence, what are the key reasons that solute concentrations naturally vary
over time in surface waters?
4.5 Water use and water quality deterioration
Although surface freshwater which is not locked up in ice sheets, glaciers or permafrost only
accounts for less than 1 % of all the non-saline water on Earth, it is essential for the survival
of terrestrial life and without it humans could not survive. In addition to providing drinking
water, humans use water for a wide variety of purposes that both consume and contaminate
the water. Since ancient times, surface waters have been used as a convenient disposal route
for our waste. However, this use (or abuse) of surface waters for waste disposal conflicts with
almost all others uses of water and most seriously with the use of surface waters for drinking
The industrialisation of a country leads to a shift in the pattern of water use from rural and
agricultural to urban and industrial and the growth of large cities has been accompanied by
increasing stress on the aquatic environment leading to a reduction in the quality of the water
(McDonald et al., 2011 and see section 4.6.2 on urbanisation). Poorer water quality means
water pollution.
Water pollution is usually defined as ‘where one or more substances have built up in a water
body to such an extent that it can be harmful to organisms and plants which live in the water
body and to animals and humans that may drink the water’. Although water pollution usually
refers to a deterioration in water quality caused by human activities, the same effect may
occur naturally. For example, large amounts of sediment can be washed into streams and
rivers during rainstorms and toxic metals find their way into surface waters where
concentrations of metal ores occur. These are natural processes and the environment will be
able to neutralise affects on water quality with time. Pollution caused by human activities, on
the other hand, are usually on a larger scale, can often happen rapidly and can take a much
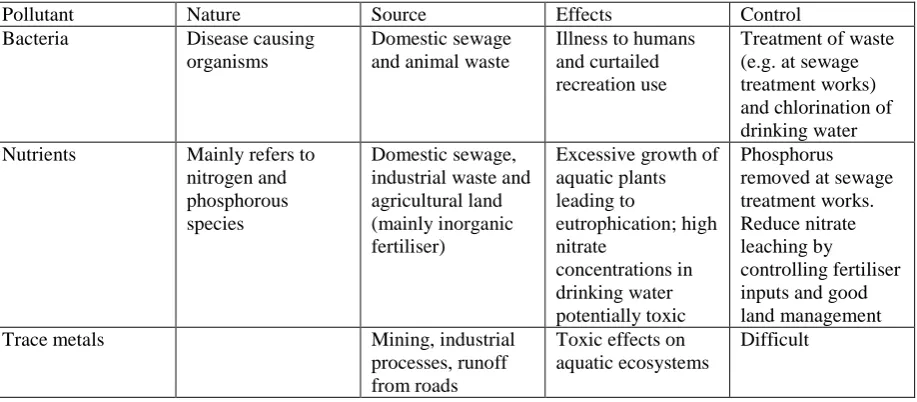
[image:21.595.71.530.568.769.2]wider variety of forms as outlined in Table 4.2.
Table 4.2 The nature, sources, effects and control of some major types of pollutants.
Pollutant Nature Source Effects Control
Bacteria Disease causing
organisms
Domestic sewage and animal waste
Illness to humans and curtailed recreation use
Treatment of waste (e.g. at sewage treatment works) and chlorination of drinking water Nutrients Mainly refers to
nitrogen and phosphorous species
Domestic sewage, industrial waste and agricultural land (mainly inorganic fertiliser)
Excessive growth of aquatic plants leading to eutrophication; high nitrate concentrations in drinking water potentially toxic Phosphorus removed at sewage treatment works. Reduce nitrate leaching by
controlling fertiliser inputs and good land management
Trace metals Mining, industrial
processes, runoff from roads
Toxic effects on aquatic ecosystems
Organic chemicals Pesticides, detergents, industrial by-products and pharmaceutics. Domestic sewage, industrial waste and farms
Toxic – threat to fish and other aquatic fauna; possible impacts on human health
Difficult to control as not removed by conventional sewage or water treatment works Natural organic matter Biodegradable organic material decomposed by aerobic bacteria (requires dissolved oxygen) Domestic sewage, animal manure, food-processing
Causes depletion in dissolved oxygen content that has an impact on aquatic fauna and flora.
Treatment of sewage, containment of sewage, animal slurry and manure and silage effluent. Sediment Mainly soil material
(organic & inorganic); industrial by-products
Land erosion by water and wind, construction sites, some quarrying and mining processes
Removal of fertile soil, filling of reservoirs and lakes, sedimentation of gravel beds; reduced aquatic life
Controlled by soil conservation and best management practices; use of settling ponds; flood control
Heat Heated water
returned to rivers and lakes
Power stations, steel mills and refineries and other industrial cooling units.
Reduces dissolved oxygen content of water and potential harm to aquatic life.
Minimised by recirculation and reuse of industrial cooling waters.
Pollution sources that affect surface water are usually separated into two categories:
(i) Point sources
(ii) Non-point sources or diffuse pollution.
If pollution comes from a single location, such as a discharge pipe attached to a factory, it is
known as point-source pollution. Other point sources include sewage treatment plants,
industrial discharges, or any other type of discharge from a specific location (commonly a
pipe) into a stream. By contrast, non-point sources are diffuse sources of pollutants that are
not as easily identified or measured as point sources. Common examples include:
Excess fertilizers and pesticides from agricultural and residential lands
Sediment from agricultural and forest lands, construction sites, and eroding stream and
river banks
Bacteria and nutrients from livestock wastes and leaking septic tank systems
Salt, oil, grease and heavy metals from urban runoff
Acid drainage from abandoned mines
When point-source pollution enters the aquatic environment, the place most affected is
usually the area immediately around the source. However, it is also dependent on the capacity
of the receiving water body to dilute the input and the ecological sensitivity of the receiving
water. In contrast, the location most affected by diffuse pollution may be far downstream
from the location where the pollutant entered the watercourse as it is often the cumulative
effect of small amounts of contaminants gathered from a large area that results in an impact.
Where pollution enters the environment in one place but has an effect hundreds or even
thousands of miles away, this is known as transboundary pollution. An example of this is
the emission of pollutants, such as sulphur dioxide (SO2), into the atmosphere in one country
which is then deposited in another country having an impact on water quality (see section
4.6.4 on acid rain).
Different sources of pollution respond to storms in contrasting ways. Usually, the
concentration of pollutants from non-point sources will increase as flow increases during
storm runoff. In contrast, concentrations of pollutants from point sources generally decrease
through dilution during storm runoff. Thus water monitoring programmes that collect water
samples at regular time intervals (usually weekly or monthly) are much more likely to
identify point sources of pollution which can be treated. In contrast, pollution from diffuse
sources can only be controlled by prevention and remain the major challenge to improving
surface water quality globally.
There are two main ways of measuring the quality of water. One is to take water samples and
measure the concentrations of different solutes and sediments that it contains. If the
concentrations exceed a certain limit, we can regard the water as polluted. Measurements like
the fish, insects, and other invertebrates that live in the aquatic environment. A widely used
system focuses on macroinvertebrate benthic fauna and utilises the Biological Monitoring
Working Party (BMWP) scoring system (Armitage et al., 1983) to assess water quality.
Measurements like this are called biological indicators of water quality. Often both types of
measurements are made to classify the quality of a water body. For example, the European
Water Framework Directive (WFD) requires member states to use chemical and biological
indicators, along with hydrogeomorphological parameters, to rank the ecological status of
rivers (see Box 6.3 in Chapter 6).
Reflective question
Why might the people responsible for diffuse pollution often be difficult to trace?
4.6 Surface water pollution: causes, consequences and management
4.6.1 Agriculture
Farm type can be split generally into arable and livestock. Common arable crops include
wheat, barley, rice, oats and oil seed rape, as well as vegetables, such as potatoes and other
root crops. Livestock farms tend to focus on one particular type of production, which might
be dairy, beef, sheep or pigs. Some of these farms will operate intensive indoor systems
whilst others will use more extensive outdoor production techniques.
4.6.1.1 Impacts of agriculture on water quality
Agriculture can have a huge impact on water quality due to the vast array of chemicals that
are used to increase production. It is thought that the aquatic life in the Gulf of Mexico is
severely degraded by agricultural pollution brought down the Mississippi river from the
phosphorus that enters the Gulf of Mexico comes from agricultural sources in the USA. This
compares to 9-12 % from urban sources. Nutrients are one of the most well studied
agricultural pollutants and comprise largely of nitrogen and phosphorus which are applied to
land in manure and slurry (Figure 4.10) as well as in inorganic fertiliser. Moreover, dung is
deposited on fields by grazing livestock. Nitrate is the major form of nitrogen found in
surface waters and is very mobile, unlike some other forms, such as ammonium, which is
more strongly retained by soils (Hatch et al., 2002). Nitrate leaching is a problem in most
agricultural areas and peak concentrations in rivers usually exceed 10 mg N L-1, although the other nitrogen species will be found at much lower concentrations (Neal et al., 2006).
Although not particularly toxic in the environment, nitrate must be removed from drinking
waters which is costly to water utilities and consumers (Pretty et al., 2000). In contrast,
phosphate tends to form complexes with soil particles and concentrations in rivers are, thus,
often associated with levels of suspended solids. Nevertheless, orthophosphate is soluble and
is therefore bioavailable to aquatic organisms, which can lead to eutrophication (an
unwelcome bloom of plants in water which has a detrimental effect on other organisms) as
plants can quickly use the phosphate to encourage rapid growth (Jarvie et al., 2007).
[Insert Figure 4.10 near here]
Pesticides, including herbicides, insecticides and fungicides, are applied to a wide variety of
crops in order to improve growth by eliminating competitors and parasites. Residues of these
chemicals are frequently transported from crops and soils to waters in runoff (Garrod et al.,
2007). The extent to which these substances are present in waters will depend largely on their
physicochemical properties, which determine their degradation and sorption (how one
substance becomes attached to another) characteristics (Kladivko et al., 1991). The
for the substance to degrade to 50 % of its original concentration). Sorption characteristics
are expressed as values representing the amount (per kg) of a substance that will attach to soil
(abbreviated to Kd). As for phosphorus though, sorption of a pesticide to soil does not mean
that it will be immobile as substances can be transported in the particulate phase in overland
flow and subsurface drainflow (Øygarden et al., 1997). Concentrations of pesticides detected
in water bodies range from nanograms per litre, ng L-1, (billionths of a gram) up to tens of micrograms per litre, µg L-1 (millionths of a gram),although they are commonly measured in streams at peak concentrations below 10 µg L-1, (Du Preez et al., 2005).
Veterinary medicines have similar physicochemical properties to pesticides but reach the land
following administration to livestock to prevent and treat disease. Residues of these
compounds can be found in manure and slurry applied to land and in dung deposited by
grazing livestock. Moreover, wash-off can occur following topical application. Antibiotics
are the most commonly used group of veterinary medicines and have been measured in rivers
at concentrations up to a few µg L-1. Toxic impacts are unusual in the aquatic environment although concern exists about the spread of antibiotic resistance (Kay et al., 2004).
Other important water quality issues resulting from agricultural production include sediment
loss (Edwards and Withers, 2008) and organic pollution from manures and silage effluent
leading to significant reductions in the dissolved oxygen content of water bodies (Hooda et
al., 2000).
4.6.1.2 Agricultural stewardship
Due to the known impacts that agriculture can have on the environment, the implementation
of stewardship measures is now common place and many of the subsidies available to
measures have long been proposed to reduce the impacts of agriculture on water quality.
Stewardship measures can be split into three general categories; those that reduce inputs of
pollutants; others that limit transport to waterbodies; and edge of field measures (Kay et al.,
2009). Hundreds of measures are available that can be implemented by farmers but some of
the most common include buffer zones, wetlands and specific soil management practices.
Buffer zones involve creating areas of land near waterbodies that are not used for farming.
These buffers use a protected strip of vegetation (perhaps 8-50 m wide) to trap and consume
pollutants, including sediment, before they enter watercourses. The use of buffer zones has
been found to be very successful in reducing pollution of water bodies, but farmers have to
accept that valuable land is taken out of production in such schemes. There are many
examples of agricultural stewardship schemes around the world, including work undertaken
by the Environmental Protection Agency in the US and the Landcare scheme in Australia.
Furthermore, many stewardship measures have been implemented in the UK through the
England Catchment Sensitive Farming Delivery Initiative (ECSFDI) in recent years (Figure
4.11). This is a scheme set up to encourage farmers to adopt environmentally friendly
practices through programmes of advice and the availability of subsidies paid through Cross
Compliance and the Entry and Higher Level Schemes.
[Insert Figure 4.11 near here]
4.6.1.3 The future
There are a number of contemporary issues that are particularly pertinent as to future impacts
of agriculture on water quality. Whilst stewardship measures have been implemented for a
number of years and with renewed vigour since reform of the European Common
Agricultural Policy in 2003 there is a limited amount of data to support their use to improve
to be site and pollutant specific and for many measures no data are available. Crucially,
limited data exist to describe the impact of stewardship at the catchment scale (Kay et al.,
2009).
Furthermore, subsidies for agricultural stewardship may change in the future with little
certainty that current regimes will remain. It has been postulated that human population
growth will require agricultural production to be increased and therefore subsidies for
environmental protection could be replaced once more by production related payments.
At present, agriculture remains one of the key sources of surface water pollution and there is
currently little evidence to suggest that this situation is improving, despite concerted efforts to
employ more environmentally friendly practices.
BOX 4.3
CONTEMPORARY CHALLENGES
Long-term nitrate trends in rivers
The use of fertilisers in agriculture has helped to ensure the production of plentiful, cheap food supplies in the
developed world, although one of the consequences of this has been nitrate pollution of rivers. Subsequently,
policies have been developed that have attempted to reduce this contamination; including the EU Nitrates
Directive (EC, 1991) and the Clean Water Act in the US (US Senate, 2002), which have set regulatory limits for
nitrate concentrations in rivers of 11.3 and 10 mg N L-1, respectively. Recent studies to assess how effective
these policies have been have determined that nitrate concentrations in polluted rivers have generally changed
little in recent decades (since the 1970s) (Worrall et al., 2009; Burt et al., 2011; Kay et al., 2012; Figure 4.12).
In the Mississippi basin, for example, despite efforts to reduce pollution, nitrate losses to the Gulf of Mexico
were actually 10 % higher in 2008 than they were in 1980 (Sprague et al., 2011). This has been attributed to
increased concentrations at upstream sites which, when normalised for changes in flow, have risen by around 75
%. A particular problem is that nitrate can take decades to reach groundwater and then be transported to streams
and so the impacts of land management actions may not be evident for many years. Moreover, some work has
fertiliser applications) to reduce nitrate pollution that is the problem but rather the need for robust
implementation of these by regulators and farmers (Kay et al., 2012). Taking these factors into account, it may
not be possible to achieve some policy goals, such as compliance with the EU Water Framework Directive by
2015. If progress is to be made though, continued efforts will be needed on farms to control nitrogen inputs and
transport to waters, as will long-term (covering several decades) water quality data sets to assess their impacts.
[Insert Figure 4.12 in here]
4.6.2 Urbanization
4.6.2.1 Urban pollution and non-point sources
Many towns and cities develop in close proximity to lakes and rivers. The construction of
housing, commercial buildings, roads and other infrastructure, reduces the permeability of the
surrounding land, and so alters the hydrological characteristics of stormwater flowing to
those lakes and rivers. Runoff volumes increase and most obviously discharges become
‘flashy’, with a shorter time to a greater peak discharge, resulting in increased bed and bank
scour and increased risk of flooding. Loss of in stream and riparian biodiversity also occurs,
exacerbated by the low or zero flows that can then occur during dry weather. Such
urbanisation also has major impacts on water quality. Historically, impacts of most concern
were those associated with sewage disposal and end-of-pipe (e.g. factory) discharges.
Investment in sewers and wastewater treatment processes, driven by public health
imperatives (see Chapter 9), and greater regulation of commercial point source discharges
have led to dramatic improvements in the quality of urban surface waters in many countries
over the last 150 years. However, urban waters often remain unacceptably polluted, due to
emissions from non-point sources which originate over an area. These emissions comprise a
diverse mix of pollutants that accumulate on built surfaces, until they are washed off during
rivers (e.g. light loss, gill rot in fish), dissolved oxygen depletion, eutrophication,
transmission of infectious pathogens, and a wide range of toxic effects from metals, biocides
and other persistent organic pollutants.
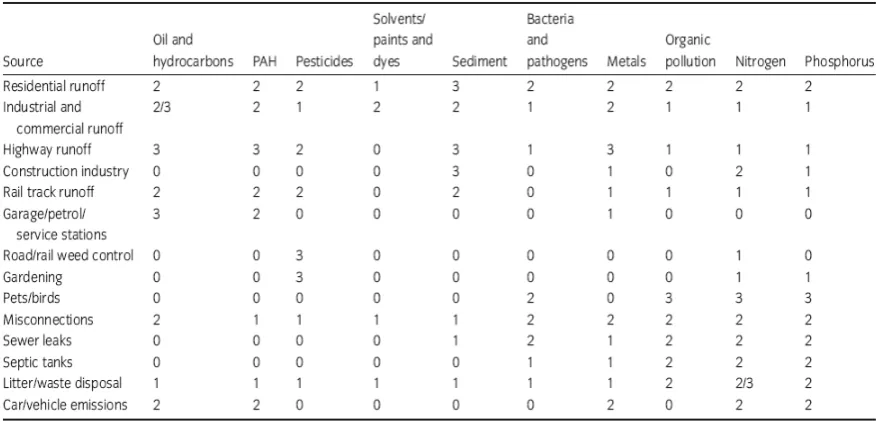
Table 4.3 indicates the range of urban pollutants involved, and their principal sources. While
most pesticide pollution is associated with agriculture, some pesticides are often used in
gardens in urban areas which can be problematic (e.g. metaldehyde products are used to kill
slugs). Table 4.4 reveals that the concentration of many of these pollutants in urban
stormwater exceeds that of untreated sewage or from combined sewage overflows (CSOs)
which comprise a mix of untreated sewage and storm water, discharged to river when storm
discharges would otherwise exceed sewer capacities. Data limitations mean that it is difficult
to understand precisely the role of urban diffuse sources in river degradation, but evidence
(see for example Table 4.5), suggests that in developed countries urban diffuse pollution is
now one of the main reasons that rivers fail to reach their water quality objectives. Note that
when CSOs are also considered, urban storm water pollution accounts for more kilometres of
poor water quality than any other cause.
It should also be noted that many possible urban water pollutants are not yet being monitored
as the detection techniques are only just becoming available. These pollutants include those
derived from pharmaceuticals and personal care products such as steroids, antibiotics, fire
retardants, fragrances and flavours, insect repellents, disinfectants, cosmetics, solvents, hair
dyes and so on. In many cases it is not known what effects many of these substances might
have on aquatic organisms or human health and this is an emerging area of study for water
the aquatic environment. This means they can cause the sex of some creatures to be altered at
[image:31.595.77.516.349.560.2]the foetal stage. Much further research is required on a wide range of these urban pollutants.
Table 4.3 Some urban diffuse pollutants and their sources (from Ellis and Mitchell, 2006). Reproduced with kind permission of John Wiley & Sons from Ellis, J.B. and Mitchell, G. 2006. Urban diffuse pollution: key management issues for the Water Framework Directive. Journal of the Chartered Institution of Water and Environmental Management 20: 19-26.
Table 4.4 Pollutant concentrations in wastewater and storm water across Europe (data from
Mitchell, 2001; Novotny, 2002 and Rule et al., 2006b)
Untreated sewage CSO Urban stormwater
BOD mg L-1 160 60-200 10-250
SS mg L-1 225 100-1100 3000-11000
Total N mg L-1 35 3-24 3-10
Total P mg L-1 10 1-11 0.2-1.7
Coliforms MPN/100mL 107-109 105-107 103-108
Cadmium g L-1
0.15-0.38 1.4-9.6 0.2-63
Copper g L-1
[image:31.595.69.529.668.768.2]Zinc g L-1 85-180 100-1070 17-3550
Table 4.5 Causes of low river quality in Scotland (data from SEPA, 1996)
Cause % of river length
Abandoned mines 22
Sewage from treatment works 21
Urban diffuse sources 20
Combined sewer overflows (CSOs) 12
Industry 12
Agricultural point sources 4
Agricultural diffuse sources 1
Other 8
Box 4.4
CONTEMPORARY CHALLENGES
De-icing agents and diffuse pollution
In cold regions, highway authorities often undertake preventative measures to avoid road icing in winter. Salt is
the most common de-icing agent and typically comprises about 90% sodium chloride, with the remainder made
up of insoluble residues such as clay marl, and trace amounts of metals. Colwill et al. (1984), estimated that
de-icing contributed 25 % of suspended loadings and 90 % of soluble loadings in winter road runoff from a rural
motorway in England, although clearly this will vary greatly with frequency and extent of salt application. The
chloride contained in road salt is a concern due to its impact on ground and surface waters used for drinking
supply and aquatic habitat. The metals contained in de-icer salt, including nickel, lead, zinc, and chromium are
toxic in runoff, whilst the salt itself increases the solubility and mobility of metals previously deposited on road
surfaces by vehicles. De-icer salt also contains sodium ferrocyanide, added as an anti-caking agent, which in
strong sunlight and acidic conditions can generate toxic cyanide forms, although in surface waters this usually
evaporates as hydrogen cyanide.
Monitoring in northeastern USA from 1991-2004 indicated chloride concentrations exceeded environmental
standards in around 2 % of the 1300 groundwater wells analyzed, whilst 15 of 100 catchments had winter
chloride concentration in excess of aquatic habitat standards (Mullaney et al., 2009). Concentrations were
urban areas, chloride: bromide ratio analysis indicated that much of the chloride was due to de-icer application,
although septic systems, wastewater discharge, and saline groundwater plumes from landfills and salt-storage
areas were also significant sources. The increasing load in chloride, consistent with literature reports of long
term increases in chloride concentrations, was attributed to the expansion of road networks and impervious areas
that require deicing.
Reductions in de-icer application have been achieved through highway design, such as snow fences, from
improved weather forecasting and ice prediction that allows more targeted applications in space and time, and
by measurement of residual salt loadings, so that less salt is used when topping up. Because salt is corrosive, not
only to vehicles, but also to critical structures such as bridges, alternative de-icers, most commonly urea and
ethylene glycol, may be used on parts of a highway. Theses de-icing chemicals are also used by the aviation
industry on runways and aircraft. However, these de-icers also pose a risk to water quality. For example, urea
can mobilize metals such as copper, which occur in high concentrations on heavily trafficked roads. Urea also
hydrolyses to ammonia, which exerts an oxygen demand on water and, in its un-ionized form, is also toxic. In
the aviation industry, the use of urea as a de-icer is being replaced by calcium and magnesium acetate based
products.
4.6.2.2 Mitigation of urban pollution
The areal nature of diffuse sources means that they are much harder to control than point
sources which are amenable to end of pipe treatment. Urban diffuse sources are particularly
challenging, as cities are highly heterogeneous in terms of land cover, land use, and intensity
of activity (e.g. housing density, traffic flow on roads), making effective targeting of
mitigation measures more difficult. Such measures are of two fundamental types; structural
and non-structural. In the USA both are covered by the term Best Management Practices
(BMP) while in the UK, the structural measures are known as Sustainable Urban Drainage
Systems (SUDS). The term source control is also commonly used, and recognises that BMPs
The philosophy behind SUDS, is that they act to reintroduce a more natural hydrological
regime to the urban environment through detention and retention of storm discharges,
through a variety of physical devices (Table 4.6; see also Chapter 3). The term ‘SUDS
triangle’ is often used to denote the primary benefits SUDS offer. First, attenuation of storm
discharge leads to reduced flood risk, and enhanced ground water replenishment and dry
weather flow. Second, this discharge attenuation gives more time for pollutant degradation
through natural processes of volatilisation, sedimentation and filtration, precipitation,
adsorption, photolysis, microbial degradation, and plant uptake. Finally, SUDS that include
natural elements in their structure are able to enhance the biodiversity and amenity value of
buildings and urban areas. The carbon sequestration function of vegetated SUDS is also now
recognised as a valuable additional benefit given the importance of climate change
[image:34.595.70.525.459.619.2]mitigation.
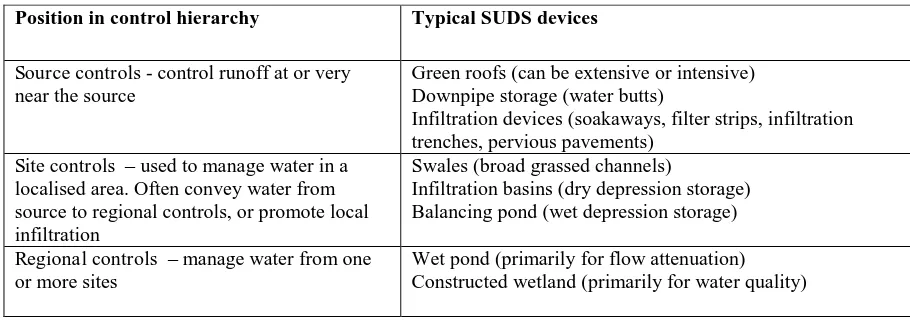
Table 4.6 Typical SUDS devices
Position in control hierarchy Typical SUDS devices
Source controls - control runoff at or very near the source
Green roofs (can be extensive or intensive) Downpipe storage (water butts)
Infiltration devices (soakaways, filter strips, infiltration trenches, pervious pavements)
Site controls – used to manage water in a localised area. Often convey water from source to regional controls, or promote local infiltration
Swales (broad grassed channels)
Infiltration basins (dry depression storage) Balancing pond (wet depression storage)
Regional controls – manage water from one or more sites
Wet pond (primarily for flow attenuation) Constructed wetland (primarily for water quality)
SUDS differ in performance with respect to the main benefits they offer. While most offer
multiple benefits, some perform particularly well with respect to flow attenuation, and others
with respect to water quality remediation, or ecological performance. This gives rise to a
maximise the benefits on offer from source to final discharge (whether water course or
sewer). Thus a development might have green roofs at the building level, infiltration trenches
and swales at the site level, and ponds or wetland at the regional (neighbourhood) level. This
approach builds robustness into the treatment of storm water, as it increases the range of
pollutant remediation processes at work, and should one SUDS device fail, others are there to
treat the runoff.
SUDS do pose particular problems, but these are now better understood and addressed. For
example, safety fears with respect to urban ponds are tackled by careful design and edge
planting; concerns over maintenance costs have been allayed as experience shows that whole
life cycle costs are comparable to or less than that of conventional sewers; and a growing
body of evidence on the performance of SUDS (both quality and quantity) means that SUDS
designers are better able to develop urban drainage for new sites that meets specified
performance criteria.
Although SUDS have received much attention, the importance of non-structural BMPS in
urban storm water management must be recognised. These are measures designed to prevent
discharge of polluted storm water, and should sit above source control in the BMP hierarchy.
These include a very wide range of ‘good housekeeping’ measures, such as street sweeping,
rainwater harvesting and re-use, using bunded tanks for storing hazardous materials, covering
material in goods yards that might otherwise be washed to drains during rainfall, and having
dedicated loading areas where a spill will not drain to a watercourse. Such measures can be
incorporated into a site’s environmental management plan, which may be a legal requirement
BMPs and SUDS are increasingly required by planning authorities as a condition of
development consent. In the UK, for example, local planning policy is driven by national
water management policies designed to address surface water quality objectives and flood
risk. However, whilst BMPs are rightly considered essential, it is unlikely that they will lead
to the restoration of urban river quality just yet. There are several reasons for this. Firstly, the
rate of SUDS implementation remains low. For example, a 2009 survey indicated that in
Greater Manchester, England, an area of 1100 km2 with a population of 2.5 million people, there were only 36 SUDS sites in operation (White and Alacon, 2009). Second, where SUDS
are installed the primary motivation is usually mitigation of flood risk, which poses the
greater threat to human well being. SUDS installed specifically for water quality reasons tend
to be installed only to protect the most sensitive receiving waters. Third, SUDS are being
implemented principally in a new urban development scheme which does nothing to combat
the legacy effects of the existing built environment. Building stock renewal in developing
countries is typically less than 1 % a year, so most homes we will be inhabiting in 2050 are
already here, hence there is a strong need to retrofit SUDS in the existing built environment.
This is more challenging than for new build, but ongoing research and case studies indicates
it is feasible (SNIFFER, 2006). Even high density neighbourhoods offer opportunity for
SUDS retrofit, through green roofs and devices such as infiltration trenches that occupy little
surface space. Of course, funds for retrofit are limited, so knowing where to install SUDS for
the greatest benefit is a key requirement.
SUDS are part of a wider goal of developing sustainable urban drainage, which has the main
objectives of maintaining an effective public health barrier, avoiding flooding and pollution,
and minimising the use of resources, all in a socially acceptable manner. Strategies for