On the origin of variable gamma-ray emission from the Crab nebula
S. S. Komissarov
1and M. Lyutikov
21Department of Applied Mathematics, The University of Leeds, Leeds LS2 9GT
2Department of Physics, Purdue University, 525 Northwestern Avenue, West Lafayette, IN 47907-2036, USA
Accepted 2011 February 9. Received 2011 January 31; in original form 2010 November 8
A B S T R A C T
The oblique geometry of the pulsar wind termination shock ensures that the Doppler beaming has a strong impact on the shock emission. We illustrate this using the recent relativistic magnetohydrodynamic (MHD) simulations of the Crab nebula and the analysis of oblique shocks. We also show that the observed size, shape and distance from the Crab pulsar of the Crab nebula inner knot are consistent with its interpretation as a Doppler-boosted emission from the termination shock. If the electrons responsible for the synchrotron gamma-rays are accelerated only at the termination shock, then their short lifetime ensures that these gamma-rays originate close to the shock and are also strongly affected by the Doppler beaming. As a result, the bulk of the observed synchrotron gamma-rays of the Crab nebula around 100 MeV may come from its inner knot. This hypothesis is consistent with the observed optical flux of the inner knot, provided its optical-gamma spectral index is the same as the injection spectral index found in the Kennel & Coroniti model of the nebula spectrum. The observed variability of synchrotron gamma-ray emission on the time-scale of the wisp production can be caused by the instability of the termination shock discovered in recent numerical simulations. Given the small size of the knot, it is also possible that the 2010 September gamma-ray flare of the Crab nebula also came from the knot, though the actual mechanism remains unclear. The model predicts correlation of the temporal variability of the synchrotron gamma-ray flux in the Fermi and Astro-revilatore Gamma a Immagini LEggero (AGILE) windows with the variability of the un-pulsed optical flux from within 1 arcsec of the Crab pulsar.
Key words: MHD – radiation mechanisms: non-thermal – relativistic processes – shock waves – ISM: supernova remnants – gamma-rays: ISM.
1 I N T R O D U C T I O N
The Crab nebula has been a source of intriguing discoveries and served as a test bed of astrophysics for decades. This is one of the best-studied objects beyond the Solar system. It has been observed at all wavelengths, from radio to very high energy gamma-rays. Its non-thermal emission belowEb
ph 500 MeV is a synchrotron emission of relativistic electrons in the nebula magnetic field; and aboveEb
phit is the inverse Compton emission of the same electrons. The emitting electrons are accelerated up to PeV energies, indicat-ing that the acceleration mechanism is very efficient. The source of energy is the ultra-relativistic magnetic wind from the pulsar (Rees & Gunn 1974; Kennel & Coroniti 1984a), but the actual mecha-nism of particle acceleration is still a mystery. The main candidates are the diffusive shock acceleration at the wind termination shock, the second-order Fermi acceleration in the turbulent plasma of the nebula, including secondary shocks, and the magnetic reconnection events.
E-mail: [email protected] (SSK); [email protected] (ML)
In comparison to the highly filamentary thermal emission, the non-thermal emission is relatively featureless. Yet, it was discov-ered already in 1920 that fine and dynamic ‘wisps’ are somehow produced in the centre of the nebula (Lampland 1921; Scargle 1969). Later, the X-ray observations discovered the famous jet-torus struc-ture in the inner nebula (Weisskopf et al. 2000; Hester et al. 2002), and the high-resolution optical observations with Hubble Space
Telescope (HST) revealed fine sub-arcsecond structure of the
non-thermal emission, including a few optical knots (Hester et al. 1995, 2002).
The synchrotron lifetime of electrons emitting in optics is com-parable to the dynamical time-scale of the nebula, and this makes it difficult to spot the exact locations of the particle acceleration cites. In gamma-rays belowEb
ph, where the lifetime becomes short, the angular resolution of the telescopes is insufficient to see the neb-ula structure. However, the observations indicated variability of the gamma-ray emission in the 1–150 MeV range (Much et al. 1995; de Jager et al. 1996) on the time-scale of around 1 year. de Jager et al. (1996) proposed that this emission could originate from the variable optical features seen with HST in the polar regions of the
2011 The Authors
at University of Leeds on April 1, 2016
http://mnras.oxfordjournals.org/
inner nebula, in particular the so-called anvil. Variability on a sim-ilar time-scale has been recently discovered in the X-ray emission (Wilson-Hodge et al.2011).
In 2010 September, AGILE collaboration reported a three-fold increase in the gamma-ray flux (>100 MeV) from the direction of the Crab nebula (Tavani et al. 2011), which was immediately confirmed by Fermi Large Area Telescope collaboration, which re-ported a six-fold increase of the flux (Abdo et al. 2011). The flare continued for 4 d, September 18–22, after which the gamma-ray flux returned to the pre-flare level. Fermi also reported that the pulsed emission of the Crab pulsar remained unchanged during the flare, suggesting that the flare originated in the nebula. Jodrell Bank radio timing observations of the Crab pulsar showed no glitch during the flare, supporting this conclusion (A Tel: 2889). At the same time,
INTEGRAL reported no detection of the flare during September
19 in the 20–400 keV window (A Tel: 2856) and Swift/Burst Area Telescope (BAT) did not see any significant variability during the gamma-ray flare in the 14–150 keV range (A Tel: 2893). Swift also reported no evidence for active galactic nuclei near the Crab, sug-gesting that the Crab itself is responsible for the flare (A Tel: 2868). Astrophysical Radiation with Ground-based Observatory at Yang-BaJing (ARGO-YBJ) collaboration reported a significant enhance-ment of the very high energy emission, around 1 TeV, from the Crab nebula during the AGILE-Fermi flare (A Tel: 2921). However, this has not been confirmed by Very Energetic Radiation Imag-ing Telescope Array System (VERITAS) and Major Atmospheric Gamma-ray Imaging Cerenkov (MAGIC) collaborations (A Tel: 2967, 2968). This discovery seems to have given credit to another event, detected in 2009 February, which lasted for approximately 14 d, during which the gamma-ray flux increased by a factor of 3 or 4 (Abdo et al. 2011; Tavani et al. 2011). On the Spectral Energy Distribution (SED) plots the flares appear as an extension of the synchrotron component further out towards the higher energies, up to 1 GeV for the September flare and a bit less dramatic for the Februaryflare.
The short duration of these flares suggests that their source is rather compact. Unfortunately, no high angular resolution obser-vations of the nebula were carried out during the flares. The Crab nebula images from Chandra and HST, obtained after the Septem-ber flare, have not revealed anything unusual (A Tel: 2882, A Tel: 2903). They do show a change in the structure of the nebula wisps compared to previous observations, carried out years earlier. How-ever, the large length-scale of these wisps shows that they can hardly be a source of the flares. The Chandra images also show a signifi-cant change in the position of one of the jet knots, which apparently had moved about 3 arcsec towards the pulsar. This may be more significant as this feature is more compact.
Even more potent source of the flares could be the mysterious ‘inner knot’, discovered only 0.65 arcsec away from the Crab pulsar along the jet direction. This knot, named ‘knot 1’ in Hester et al. (1995), is the brightest and most compact persistent feature of the Crab nebula. It is seen at more or less the same location in many observations, with both space- and ground-based telescopes with adaptive optics, which followed its discovery. It is extended and elongated, with the main axis perpendicular to the jet. Its length and width areψ⊥0.50 arcsec andψ0.16 arcsec, respectively
(Hester et al. 1995). A number of recent optical and infrared ob-servations of the inner Crab nebula focused on the knot variability. Melatos et al. (2005) reported no variability on the time-scales from 1 kilosecond to 48 h. Tziamtzis, Lundqvist & Djupvik (2009) com-pared the measurements separated by two-and-a-half months and found no significant difference too. On the other hand, Sollerman
(2003) analysed the HST archive data and discovered flux varia-tions on the level of 50 per cent over the period of 6 yr.1They also reported possible random displacements of the knot on the scale of 0.1 arcsec. More recently, Sandberg & Sollerman (2009) reported twice as higher flux from the inner knot in 2003 compared to the earlier observations in 2000. Thus, we tentatively conclude that the inner knot does show significant variations of its flux, and possibly location, on the time-scale comparable to that of the gamma-rays variability reported by de Jager et al. (1996). These data suggest to consider the possibility that the inner knot may be a strong source of gamma-rays, both during and between the flares.
The synthetic maps of synchrotron emission from the Crab neb-ula, based on numerical relativistic magnetohydrodynamic (MHD) simulations, reveal a bright compact feature strikingly similar in its appearance and location to the inner knot (see Fig. 2). In Komissarov & Lyubarsky (2004) this feature was identified with the Doppler-boosted emission from the high-velocity flow downstream of the oblique termination shock of the pulsar wind. The more recent simulations of the Crab nebula, which had a significantly higher resolution, discovered strong variability of the termination shock, involving dramatic changes of its shape and inclination (Camus et al. 2009). This discovery suggests that the gamma-ray variability may be related to the changes in the Doppler beaming of the post-shock emission, associated with this structural variability of the termina-tion shock. Volpi et al. (2008) have already addressed the issue of variability of both the synchrotron and inverse Compton emission of the Crab nebula in their computer simulations. They reported the strongest variability in the part of the gamma-ray window where the synchrotron emission is still dominant over the inverse Comp-ton emission, and on the time-scale comparable to that found by de Jager et al. (1996). However, they could not identify the source of variability with any particular feature in their numerical solutions.
Here, we present new arguments in favour of the interpretation of the inner knot as a Doppler-boosted shock emission, and investigate whether the inner knot can be a strong source of variable gamma-ray emission. In Section 2, we analyse the observed shape and location of the inner knot and show that they are consistent with this interpretation. In Section 3, we argue that at least a significant fraction of the synchrotron gamma-ray emission of the Crab nebula originates from the inner knot. The key factors are the short cooling time of electrons and the strong Doppler beaming of the emission originated in the vicinity of the termination shock. In Section 4, we discuss the possible connection between the observed variability of the gamma-ray emission and the non-stationary shock dynamics discovered in numerical simulations, in particular the role of the variable Doppler beam orientation. Our conclusions are given in Section 5. In Appendix A we present the analysis of oblique MHD shocks. Its results allow us to determine how high the Lorentz factor downstream of the Crab’s termination shock can be and to confirm the results of numerical simulations.
2 O R I G I N O F T H E I N N E R K N OT
The first numerical simulations of the Crab nebula by Komissarov & Lyubarsky (2003, 2004), Del Zanna, Amato & Bucciantini (2004) and Bogovalov et al. (2005) had rather low numerical resolution and imposed reflectional symmetry in the equatorial plane. In these sim-ulations, the termination shock appeared as a more or less stationary
1For some reason, the actual observational data have not been presented in this paper.
2011 The Authors, MNRAS 414, 2017–2028
at University of Leeds on April 1, 2016
http://mnras.oxfordjournals.org/
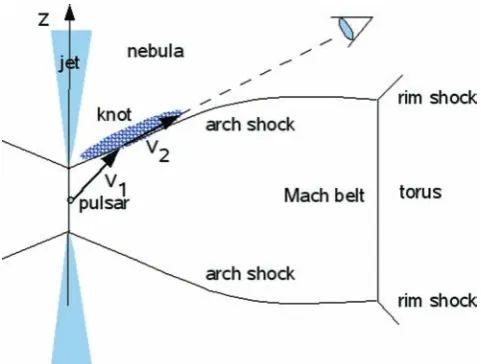
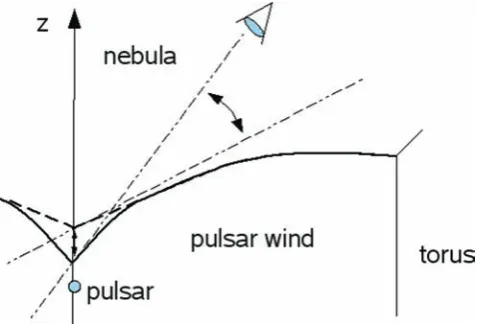
Figure 1. Interpretation of the inner knot as the Doppler-boosted emission from the high-velocity flow located downstream of the oblique termination shock. The termination shock is shown by the solid line. The dashed line is the line of sight.
complex structure, which in fact included several different shocks. These components, named as arch shocks, rim shocks and the Mach belt in Komissarov & Lyubarsky (2004), are shown in Fig. 1. The latest simulations by Camus et al. (2009) had much higher reso-lution and the computational domain included the whole range of the polar angle,θ ∈(0,π). In these simulations, the structure of the termination shock appeared highly distorted and dynamic, but as one can see in Fig. 2, these individual components were still identifiable.
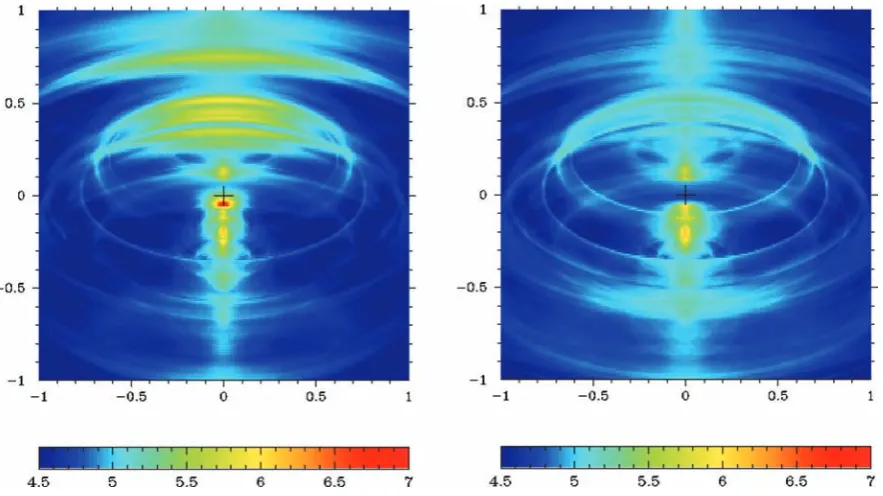
The right-hand panel of Fig. 2 shows the typical distribution of the synchrotron emissivity as measured in the pulsar/observer frame, found in the latest numerical simulations.2One can see that it is strongly enhanced in the vicinity of the upper arch shock of the termination shock complex. There are two reasons for this enhance-ment. First, the proper magnetic field in this region is the strongest. Several factors are responsible for this result. Although the magnetic field of dissipationless wind behaves as Bφ∝sinθ/r (Michel 1973; Bogovalov 1999), in the simulations this function was multiplied by|1−2θ/π|, in order to account for the magnetic field dissipation in the striped wind zone. Thus, the wind magnetic field peaked at θ57◦instead ofθ90◦. More important, however, is the axial compression of the nebula by the magnetic hoop stress, which leads to the total pressure downstream of the termination shock to be sig-nificantly higher at small polar angles. As a result, the arch shock is pushed closer to the pulsar, leading to a stronger upstream and hence downstream magnetic field. Secondly, the emission from the upper arch shock is Doppler boosted. Indeed, as one can see in the left-hand panel of Fig. 2, the Lorentz factor of the flow downstream of the arch shocks is quite high.
The analysis of oblique relativistic MHD shocks given in the Appendix A shows that in the case of ultra-relativistic cold upstream
2The details of these numerical simulations and the radiation transfer com-putations are described in Camus et al. (2009). Here, we only note that the radiation model assumes that relativistic electrons with the power-law energy spectrumN(Ee)∝Ee2.2, terminated atEemax=1 PeV, are injected at the termination shock, to be more precise at the arch shock and the Mach belt, and then they evolve subject to advection and synchrotron and adiabatic energy losses.
flow the downstream Lorentz factor is
γ2= 1
1−χ2 1 sinδ1
, (1)
whereδ1is the angle between the upstream velocity and the shock plane and
χ= 1+2σ1+
16σ2
1 +16σ1+1 6(1+σ1)
, (2)
whereσ1 =B12/4πρ1c2is the magnetization parameter of the up-stream flow. Forσ1 1 this yields
γ2 σ11/2 sinδ1
, (3)
and forσ11 γ2
3 2√2
1+1
2σ1
1 sinδ1
. (4)
In the simulationsσ1varies with the polar angle between 0 and 0.05, with the volume-averaged valueσ1 0.014, and thus the latter limit applies. On can see that for small shock inclination angles, the Lorentz factor can indeed be quite high. Even higher values are expected for high-sigma pulsar wind.
In addition to having a high Lorentz factor in the downstream flow, the upper arch shock is inclined at the angle of∼60◦to the polar axis, near the axis. Observations of the inner Crab nebula suggest that the angle between the line of sight and the symmetry axis of the nebula is also close to 60◦(Weisskopf et al. 2000). Thus, the upper arch shock is well aligned with the line of sight, resulting in strong Doppler boosting of its emission. This is schematically illustrated in Fig. 1. The left-hand panel of Fig. 3 shows the synthetic optical synchrotron image of the inner part of the simulated Pulsar Wind Nebula (PWN) at the time corresponding to the age of the Crab nebula. One can see prominent wisps and a bright knot located very close to the origin, where the projected image of the pulsar would appears if it was included in the emission model. In the simulations, there is no emission from the pulsar wind as the emitting electrons are injected at the termination shock only. Thus, all the fine features of the synthetic synchrotron images, including the inner knot, are produced inside the nebula.
It is interesting that both in the synthetic and in the real optical images of the Crab nebula the termination shock is not clearly identifiable.3The inner wisps give away its size but that is about it. Several factors contribute to this effect. First, the inner cavity filled with the pulsar wind is small compared to the size of the nebula, making the central brightness reduction rather weak. Secondly, the region of the enhanced proper emissivity around the termination shock forms a geometrically thin distorted shell. Because of this, the observed emission is strongly enhanced in places where the line of sight is tangent to the shell surface. This leads to the appearance of several bright rings on synthetic maps where the Doppler beaming is not included (see the right-hand panel of Fig. 3). The Doppler beaming leads to increased emissivity in the part of such a ring where
3The Chandra X-ray image of the inner Crab nebular is overall similar to the HST image (Hester et al. 2002). There are, however, some noticeable differences. In particular, the X-ray image is much knottier and some of these X-ray knots arrange in a sort of ring, called the ‘inner ring’, around the pulsar. This ring is often identified with the termination shock. The fact that the ring is relatively symmetric, in contrast with the optical image, is hard to explain in our model and indicates that some other factors have to be included.
2011 The Authors, MNRAS 414, 2017–2028
at University of Leeds on April 1, 2016
http://mnras.oxfordjournals.org/
Figure 2. Termination shock in numerical simulations of Camus et al. (2009). The left-hand panel shows the flow Lorentz factor. In this plot, the wind zone has been cut off (the thin line at r∼0.7 is an artefact of this procedure, which conveniently indicates the location of the Mach belt.). The right-hand panel shows the observed synchrotron emissivity in the optical range, log10jν,ob, in the plane which includes the line of sight and the symmetry axis. The angle between the line of sight and the symmetry axis is 60◦.
Figure 3. Synthetic images of the inner Crab nebula in optics. The panel shows the proper synchrotron image, log10Iν, where Iνis the intensity of radiation. The angle between the line of sight and the symmetry axis is 60◦. The right-hand panel shows how the image would look if the Doppler beaming had not been taken into account.
its plasma flows towards the observer, and decreased emissivity where it flows away, turning the ring into an arc (see the left-hand panel of Fig. 3). Because of the non-spherical shape of the termination shock, the jet base is located much closer to the pulsar compared to the Mach belt radius, making the wrong impression
that the jet originates from the inside of the termination shock and suggesting that it is produced by the pulsar.
Comparing the images presented in Fig. 3 one can see how some features brighten up and others get dimmer because of the Doppler beaming. In particular, the bright knot in the centre of the
2011 The Authors, MNRAS 414, 2017–2028
at University of Leeds on April 1, 2016
http://mnras.oxfordjournals.org/
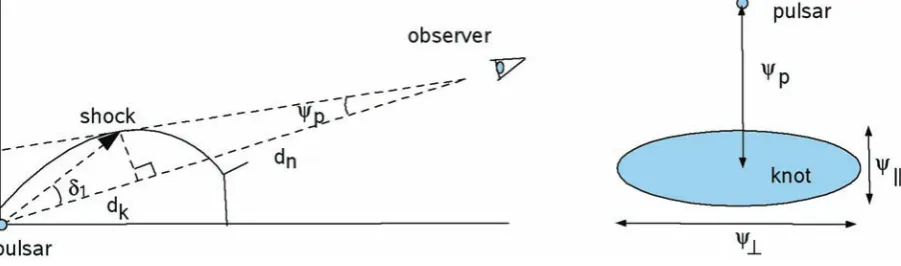
[image:4.595.76.518.378.626.2]Figure 4. Basic geometric parameters of the inner knot.
left-hand image is certainly Doppler-boosted. Komissarov & Lyubarsky (2004) proposed that this synthetic knot is a counterpart of the Crab’s inner knot. Indeed, like the inner knot it is positioned on the jet-side of the nebula at the base of the jet (only in projection) and it is elongated in the direction perpendicular to the jet (Hester et al. 1995). Other synthetic jet knots, which are seen in Fig. 3, have more or less the same brightness in both these images, indicating that the Doppler beaming is not that important. They indeed origi-nate at the base of the polar jets. The jet Lorentz factor is variable but on average it is rather low,γj∼1.5. Combined with the large
viewing angle, 60◦, this explains why the Doppler effect is rather weak. Phenomenologically, these jet knots are created via unsteady inhomogeneous axial magnetic pinch, which is responsible for the jet formation. The flow towards the polar axis, which feeds the jet, is highly inhomogeneous with patches of strong and weak magnetic field, resulting in strong spatial variations of the magnetic hoop stress and highly variable jet dynamics. The non-linear sausage-mode of the magnetic pinch instability could be another contributor to the jet variability.
The fact that the inner knot of the Crab nebula is so compact and that it appears at the base of the Crab jet is more suggestive of some jet feature rather than the extended termination shock. However, the knot shape and size are nicely explained in the shock model. Denote asψpthe observed angular distance of the knot from the pulsar, as
dn the linear distance to the nebula, and as dk the linear distance
between the pulsar and the point on the shock surface where the line of sight is tangent to the shock. The angle between the shock surface and the upstream velocity vector is denoted asδ1(see Fig. 4). Then in the small angle approximation
δ1=ψp(dn/dk). (5) Using equation (1) we can now find the Lorentz factor of the post-shock flow
γ2= fσ
δ1
(6)
and the beaming angle
φD= 1 γ2
= δ1
fσ, (7)
where fσ =(1−χ(σ1))−1/2. This allows us to find the transverse angular size of the knot
ψ⊥= dkφD
dn = 1
fσψp. (8)
Forσ1≤1, one has fσ1 and, thus,
ψ⊥ψp, (9)
which is in excellent agreement with the observations of the inner knot. The same argument shows that HST knot 2, which has similar size but is located much further out from the pulsar, cannot be the Doppler-boosted part of the termination shock, unless the pulsar wind magnetizationσ1 1.
The other size of the inner knot,ψ, is determined by the thickness
of the post-shock plasma flow and the shock local curvature. The flow thickness at the distance dkfrom the pulsar can be estimated as
δ2dk, whereδ2is the downstream angle between the velocity vector and the shock plane. Since the distance of the shock from the pulsar across the line of sight isδ1dk, this yieldsψ=(δ2/δ1)ψp. Using equation (A19) to evaluateδ2/δ1and equation (9) we then find that ifψ is fully determined by the thickness of the post-shock flow
then
ψ 1
3ψ⊥, (10)
in excellent agreement with the observations again.
The shock curvature would lead to a finite linear width of the knot in projection on the plane of the sky even if the post-shock flow was infinitely thin. This width can be estimated as Rc(1−cos(φD/2)),
where Rcis the local shock curvature radius. For the small angles this yields
ψ (Rc/dk)
8γ2fσ
ψ⊥. (11)
Thus, unless (Rc/dk)>8γ2fσ, we haveψ < ψ⊥, in agreement with the observations. Numerical simulations show that normally
Rc/dk<10.
The transverse angular size of the knot could have been used to infer the Lorentz factor of the post-shock flow if we knew the distance dk between the knot and the pulsar. Indeed, combining
equations (6) and (5) one finds that
γ2 dk dn
1 ψ⊥.
Since we only know that dkcannot exceed the radius of the
termi-nation shock, this equation only allows us to find the upper limit
γ2< ψts ψ⊥ 20,
whereψts10 arcsec is the angular size of the termination shock inferred from the observations (Hester et al. 2002).
If the inner knot is indeed a part of the termination shock then its spectrum can be used to infer the properties of the particle ac-celeration at the shock. Several groups have carried out optical and near-infrared observations of the knot in recent years. Unfor-tunately, their results do not quite agree. Sandberg & Sollerman
2011 The Authors, MNRAS 414, 2017–2028
at University of Leeds on April 1, 2016
http://mnras.oxfordjournals.org/
(2009) reported the optical spectral indexα=1.3, assuming that
Iν ∝ ν−α. On the other hand, the data presented in their fig. 2 suggest a much flatter near-infrared spectrum, withα∼0.3. It is difficult to see how the synchrotron mechanism can accommodate such a large variation of spectral index within only one decade of frequency. Perhaps, these measurements suffer from large system-atic errors. The proximity of the knot to the pulsar could be one of the complications. According to the data obtained by Melatos et al. (2005) the near-infrared spectral index of the inner knot is α=0.78. Unfortunately, the accuracy of this measurement is not given, whereas for other features the error is given and it is about
±0.13. The proximity to the pulsar suggests that for the inner knot the error is higher. Finally, Tziamtzis et al. (2009) giveα=0.63
±0.02 for the optical emission of the inner knot. The very small error indicates that this is the most accurate measurement to date. This result is in excellent agreement with the value of the injection spectral index inferred by Kennel & Coroniti (1984b) via model fitting of the integral spectrum of the Crab nebula.
Although, the MHD model in general, and the recent numerical MHD simulations in particular, has enjoyed a lot of success in explaining the properties of the Crab nebula, as well as other PWN, it is by no means problem free. The so-called σ-problem is its main weakness. It is not clear how exactly the pulsar wind turns from being Poynting-dominated near the pulsar to kinetic-energy-dominated near the termination shock. A number of different ideas have been put forward but the issue is far from settled (Lyubarsky & Kirk 2001; Kirk & Skjæraasen 2003; Lyubarsky 2003a,b; Arons 2008). An alternative model, where the flow remains Poynting-dominated even inside the nebula, has been put forward recently (Lyutikov 2010). As the result, it is not clear as to what model of the pulsar wind should be used in setting the inflow boundary condition in the MHD simulations of PWN. Moreover, so far only two-dimensional simulation have been carried out, which leaves the effects of non-axisymmetric instabilities on the nebula structure and dynamics unexplored (Begelman 1998).
How and where the emitting particles are accelerated is also debated. In the simulations, it was assumed that the synchrotron electrons are accelerated only at the arch shock and the Mach belt, but the acceleration can also occur at the rim shocks and in the turbulent interior of the nebula.
Given these uncertainties, it is not surprising that there are still some significant quantitative differences between the theory and the observations. For example, the observations reveal compara-ble isotropic luminosities of the inner knot and the brightest wisps (Hester et al. 1995). In contrast, in the synthetic synchrotron images the knot is several times brighter. This is illustrated in Fig. 2, which shows the intensity of radiation using logarithmic scaling. One pos-sible reason for this is the excessive axial compression of the nebula via the hoop stress of the azimuthal magnetic field, caused by the condition of axisymmetry. In fact, the synthetic optical images of the Crab nebula show strong global enhancement of the surface brightness along the symmetry axis, which is not present in the images of the Crab nebula. The observed large-scale kink of the Crab jet indicates that some kind of kink-mode instability signifi-cantly reduces the degree of symmetry in the polar regions of the nebula. This is important as, in addition to the anisotropic power distribution in the pulsar wind, the overall geometry of the termina-tion shock is also influenced by the pressure distributermina-tion inside the nebula. The enhanced pressure near the axis pushes the cusp of the arch shock further down towards the pulsar, making the termination shock less spherical compared to what it would be in the case of uniform pressure distribution inside the nebula. This leads to higher
magnetic field and number density of emitting particles, and hence increased volume emissivity near the shock cusp. In addition, the shock geometry determines the velocity distribution and hence the Doppler beaming.
In three-dimensional simulations of the Crab nebula, the almost perfect alignment of the arch shock with the line of sigh may no longer be found. Less squashed along the polar direction, the ter-mination shock would have lower proper emissivity near the cusp region. The Doppler-boosting of the knot emission will be reduced as well because of the less perfect alignment of its Doppler beam with the line of sight. More spherical shape of the termination shock would also lead to higher shock inclination angles and lower Lorentz factor of the downstream flow.
3 W H Y T H E I N N E R K N OT C A N B E A S T R O N G S O U R C E O F G A M M A - R AY E M I S S I O N
Suppose that the termination shock is the main acceleration site of gamma-ray emitting electrons. The synchrotron cooling time-scale is
tcool3.7D1/2
B 103G
−3/2 Eph ,ob 100 MeV
−1/2 d,
whereEph,ob=DEphis the observed energy of photons emitted at the energyEphin the fluid frame of the downstream plasma,
D= 1
γ(1−βcosφ)
is the Doppler factor, B is the magnetic field strength as measured in the fluid frame and φ is the angle between the line of sight and the velocity vector of the plasma bulk motion. Fitting of the Crab nebula spectrum with the synchro-Compton model yields the typicalB ∼ 100–200µG (Horns & Aharonian 2004; Abdo et al. 2010). However, individual bright features can have stronger mag-netic field. In particular, Hester et al. (1995) give the equipartition
B 2.5×10⁻³G for the inner knot. Moreover, the numerical simulations show that near the arch shock the magnetic field can be significantly higher, up to 10 times, than the volume averaged.4 Thus, even for the Doppler factor as high as D=10, the cooling length-scale of electrons emitting atEph ∼ 100 MeV is likely to be small compared to the termination shock radius, which is about
10 arcsec or120 light-days (Hester et al. 2002) in linear scale. Thus, the gamma-ray emitting region must be located very close to the shock.
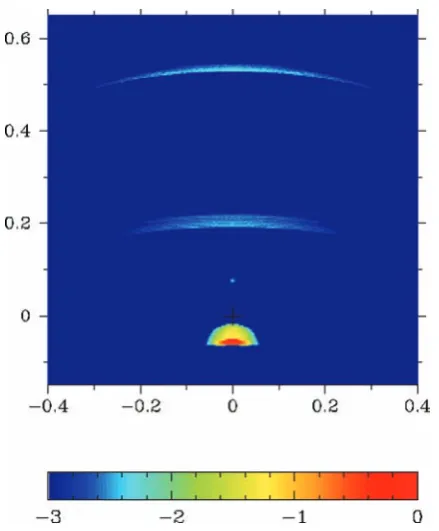
Downstream of the Mach belt the magnetic field and the number density of the emitting particles are significantly lower compared to the arch shock, and for this reason the synchrotron emissivity is low as well (see Fig. 2). Thus, it is the wind plasma which has just passed through the arch shock which is likely to be the main emitter of the synchrotron gamma-rays. This plasma flows with relativistic speed and is subject to strong Doppler beaming (see Fig. 2). This results in boosting of the emission from the part of the flow where the velocity vector is close to line of sight, the inner knot region and dimming of the emission from other parts, where the viewing angle exceeds 2/γ2. Thus, a significant fraction, if not most, of the observed synchrotron gamma-ray emission of the Crab nebula may originate from its inner knot. In fact, quick inspection of our numerical solutions shows that at 100 MeV the inner knot
4This is in contrast with the one-dimensional MHD model where the mag-netic field increases with the distance from the termination shock (Kennel & Coroniti 1984a).
2011 The Authors, MNRAS 414, 2017–2028
at University of Leeds on April 1, 2016
http://mnras.oxfordjournals.org/
Figure 5. Synthetic synchrotron map of the Crab nebula at 100 MeV. The image shows log10Iνin arbitrary units.
is essentially the only feature in the sky (see Fig. 5). However, given the uncertainties of the numerical model, one cannot exclude a contribution from few brightest wisps.
In order to test this idea against the observations one can compare the observed flux from the Crab’s inner knot in optics with the observed flux from the whole of the Crab nebula at 100 MeV. Given the small light crossing time of the knot compared to the synchrotron cooling time even at 100 MeV, its synchrotron electrons must still have the energy spectrum which is very close to the one produced by the shock acceleration mechanism. Atν = 3.76× 10¹⁴Hz the de-reddened flux from the inner knot is F
ν 1.6× 10⁻²⁷erg s−1cm−2Hz−1 (Tziamtzis et al. 2009). At 100 MeV the observed flux is Fν1.7×10⁻³²erg s−1cm−2Hz−1 (Abdo et al. 2010). The corresponding two point spectral index isα 0.64. This is indeed the value of the injection spectral index inferred by Kennel & Coroniti (1984b), and measured in optics by Tziamtzis et al. (2009)!
There exists an upper limit on the energy of synchrotron photons, which is independent of the details of the acceleration mechanism (Lyutikov 2010). If the accelerating electric field E is a fractionη≤ 1 of the magnetic field then the rate of energy gain can be estimated as
dEe
dt =eEc=ηeBc. (12)
The corresponding acceleration time-scaleτacc = Ee/(dEe/dt) = (ηωB)−1, whereωB=ceB/Eeis the relativistic Larmor frequency. The energy loss rate due to synchrotron emission
dEe
dt = −c2B 2E2
e, (13)
where c2=4e4/9m4c7, and we also assumed effective pitch angle scattering, grows with the electron energy. The balance of energy gains and losses yields the maximum energy, which can be reached
by the accelerated electrons Emax
e =(ηec/c2B)1/2. (14) The characteristic energy of the synchrotron photons emitted by the electron of energyEmax
e in the magnetic field of strength B, Emax
ph =c1B
Emax e
2 = 27
16πη mhc3
e2 =236ηMeV, (15) where c1 =3eh/4πm3c5, does not depend on the magnetic field strength. This is the utmost upper limit, which may be impossible to reach in practice. For example, de Jager et al. (1996) give an almost 10 times smaller value forEmax
ph for the shock acceleration. In fact, the synchrotron component of the Crab nebula spectrum becomes very steep above 10 MeV, and can be fitted with the func-tion
Fν∝ν−αexp−hν/Ec ph
, (16)
where the cut-off energyEc
ph100 MeV (Abdo et al. 2010). This is surprisingly close to our value ofEmax
ph . However, the above limit applies only in the frame of emitting plasma. If the plasma is moving with relativistic bulk speed relative to the observer then it has to be multiplied by the Doppler factor in order to obtain the corresponding observed photon energy. For γ 1 the maximum value of the Doppler factor is Dmax2γ, and thus even for the rather moderate post-shock value ofγ2 5 the synchrotron cut-off energy can be increased by a factor of 10. This has been used to argue that the observed synchrotron emission of the Crab nebula withEph 100 MeV originates in relativistic flow (Lyutikov 2010). Here, this argument can be refined to support the inner knot as the source of this gamma-ray emission because we are now almost certain that its emission is indeed Doppler-boosted.
It seems reasonable to expect the gyroradius of electrons ac-celerated at the termination shock to be below the radius of the termination shock. An effective Doppler boosting may also require the gyroradius to be below the transverse size of the fast flow down-stream of the arch-shock. Only in this case can one firmly conclude that the electrons are advected with the flow. For the electrons emit-ting synchrotron photons of the energyEphin the comoving frame, the gyroradius is
rL= Eph
c1e2B3 1/2
. (17)
Our numerical simulations show that the magnetic field measured just downstream of the arch shock is significantly higher than the volume averaged one, up to about one order of magnitude. This indicates that B=10−3G may well be typical for this region. Then the typical gyroradius of the electrons is
rL 1.6 D1/2
Eph,ob 100 MeV
1/2 B 10−3G
−3/2
light-days, (18)
which is significantly less than the termination shock radius and even below the size l2 light-days of the inner knot, which is an observational indicator of the thickness of the fast post-shock flow (see the discussion leading to equation 10). Given this result, we conclude that the observed emission up toEph,ob=1 GeV can be the Doppler-boosted emission produced by the electrons accelerated at the termination shock.
4 N AT U R E O F T H E G A M M A - R AY VA R I A B I L I T Y
The strong variability of the termination shock discovered in the numerical simulations by Camus et al. (2009) and associated with
2011 The Authors, MNRAS 414, 2017–2028
at University of Leeds on April 1, 2016
http://mnras.oxfordjournals.org/
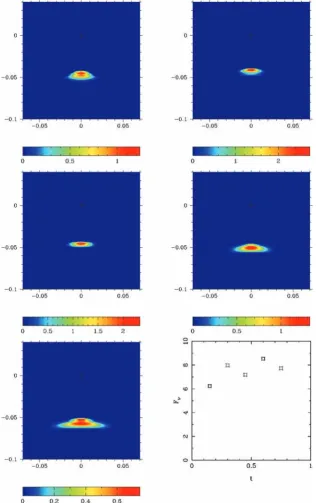
Figure 6. Variability of the gamma-ray emission from the inner knot in computer simulations (Camus et al. 2009). The five colour plots show the images of the inner knot atEph=100 MeV (Iνin linear scale). They are separated by 0.15 yr, the time increasing from left to right and from top to bottom. The plot in the right bottom corner shows the corresponding total flux variation atEph=100 MeV.
the wisp production could be behind the observed variability of the gamma-ray emission from the Crab nebula. Fig. 6 shows the intra-year variability of the inner knot atEph = 100 MeV based on the results of these simulations. The epoch corresponds to the present age of the Crab nebula. Within this particular period, the total flux changes were limited by27 per cent. (Unfortunately, most of the simulation data are now lost and we cannot comment on the statistical significance of this result.) The data also indicate noticeable changes in the knot appearance and small changes in its location.
The mechanism of this shock variability is not very clear. It seems to be related to the unsteady axial pinch, which is behind the ori-gin of the Crab jet in this model. As we have mentioned already, the magnetic field in the backflow at the base of the jet is highly inhomogeneous and this results in strong spatial and temporal fluc-tuations of the magnetic hoop stress, and hence the axial pressure. As the result, the arch shock dives towards the pulsar at times when the pressure is high, and moves further out when it is low (see Sup-porting Information for the simulation movie). Another factor is the presence of strong vortices in the backflow, which can appear all the
2011 The Authors, MNRAS 414, 2017–2028
at University of Leeds on April 1, 2016
http://mnras.oxfordjournals.org/
Figure 7. Variability of the termination shock as a reason behind the vari-ability of high-energy emission from the Crab nebula. The solid and dotted lines show the termination shock with two extreme locations of its po-lar cusp. The dash–dotted lines show the corresponding directions of the Doppler beam.
way along the arch-shock. In their eyes the pressure is lower and on the outside it is higher. Moreover, there are significant fluctuations of the ram pressure inside the simulated nebula as well.
In the simulations, the wisps are associated with regions of high magnetic field in the unsteady outflow from the termination shock (see Supporting Information for the simulation movie). New wisps are produced approximately on the light crossing time of the termi-nation shock, which was around 10 months in the simulations and which is around 3–4 months for the Crab nebula. Strong variations of the shock structure occurred on the similar time-scale. Thus, the variability of gamma-ray emission on the time-scale around several months may well have this origin. The variations of gamma-ray flux may be attributed not only to changes of the proper emissivity of the inner knot, associated with changes of the magnetic field strength and the number density of emitting particles, but also to changes in the direction of the Doppler beam (see Fig. 7).
Assuming the power-law spectral distribution for the emissivity in the comoving frame, jν∝ν−α, the observed emissivity is
jν,ob=D2+αjν
(Lind & Blandford 1985). When the angle between the flow direc-tion and the line of sight decreases fromφ=1/γ toφ =0 the Doppler factor increases fromγ to 2γ. Thus, the difference in the inclination angle of the arch shock at the location of inner knot φ=1/γ can bring about the difference in the boosting factor up to 22+α. Above 100 MeV, where the observed synchrotron spec-trum can be approximated by a power law withα∼3 (Abdo et al. 2010), this corresponds to a 30-fold flux variation. At lower photon energies, where the knot spectral index is expected to beα0.6, the corresponding flux variation is five times lower. Moreover, the cooling time of the electrons, producing such photons, becomes significantly larger – it is already several years for the electrons emitting at 1 MeV. After travelling for such a long time the emitting plasma enters the remote parts of the nebula, where it inevitably decelerates and its emission is no longer subject to strong Doppler beaming.5The contribution of this unbeamed emission may explain the observations by de Jager et al. (1996), who noticed that during
5The observed deceleration of the Crab wisps is a clear confirmation of such evolution (Hester et al. 2002).
these observations the flux in the 1–30 MeV energy range was in-creasing, whereas in the 30–150 MeV range it was decreasing. Most likely, the total flux from the nebula at 1–30 MeV is dominated by a few recently produced wisps.
At 100 keV, the observed total flux from the Crab nebula is 4 × 10⁻²⁸erg s−1cm−2Hz−1 (Horns & Aharonian 2004), whereas the expected flux from the inner knot is only 1.3 × 10⁻³⁰erg s−1cm−2Hz−1. The last estimate is obtained from the power law Fν∝ν−0.64, normalized using the observed optical flux of the inner knot (Tziamtzis et al. 2009). Thus, even a 10-fold increase of the X-ray emission from the knot would produce a variation below 5 per cent in the total flux. For the similar reason, the knot variability could hardly be seen in 10 GeV to 10 TeV range, which is dominated by the Inverse Compton emission of old electrons occupying the whole volume of the nebula (de Jager et al. 1996).
Finally, a few words need to be said on the mysterious gamma-ray flares from the Crab nebula. The observed linear sizes of the inner knot are l⊥=ψ⊥dn∼6 light-days and l=ψdn∼2 light-days. This implies that the variability time-scale of the order of a few days is possible, at least in principle. The fact that the flare spectrum extends beyond the highest characteristic energy allowed for the synchrotron emission can still be explained by the Doppler effect. Fermi reported the spectral index of the flaring component α∼1.5. Such a steep spectrum is expected because of the proximity of the exponential cut-off. The fact that flares are not seen at both lower and higher energies can be explained in the same fashion as for the long time-scale variability.
The most difficult task is to explain not only the short duration of the flares but also the fact that they are quite rare. If indeed they orig-inated from the inner knot, then this had to be associated with some rather peculiar events. For example, they could be produced when some explosive event at the base of Crab’s jet drives a shock, which then collides with the termination shock near the knot location, with both shocks being almost parallel to each other. The shocks’ intersection point could move towards the observer with a speed very close to the speed of light, potentially resulting in a short burst of emission associated with this point. The magnetic reconnection could be behind such explosions but this would probably require a significantly higher magnetization compared to what is assumed in the current MHD models. So far, the emission from simulated PWN was computed simply by integrating the instantaneous emis-sivity along the line of sight. The relativistic retardation effect was not taken into account. This practice has to be abandoned in future studies as it filters out the short time-scale variability associated with the relativistic motion along the line of sight.
5 C O N C L U S I O N S
(i) Downstream of oblique termination shocks of pulsar winds, the Lorentz factor of bulk motion can be rather high even for low-sigma winds, up toγ =5 for reasonably small inclination angles. This is shown using the analytical solution for oblique relativistic MHD shocks and confirmed by numerical simulations of the Crab nebula. For a high-sigma wind the Lorentz factor can be even higher. (ii) The bright inner knot in the synthetic synchrotron maps of the Crab nebula, obtained in relativistic MHD simulations, is def-initely a highly Doppler-boosted emission from the region located downstream of the termination shock (the so-called arch shock) and close to its polar cusp. The inner knot of the Crab nebula is likely to be of the same origin. Its geometrical parameters, such as the ratio of its major axis to its distance from the pulsar, and the ratio of its minor and major axes, are consistent with this interpretation.
2011 The Authors, MNRAS 414, 2017–2028
at University of Leeds on April 1, 2016
http://mnras.oxfordjournals.org/
(iii) The combination of the short synchrotron cooling time of gamma-ray emitting electrons and the strong Doppler beam-ing in the vicinity of the termination shock suggests that if the synchrotron gamma-ray electrons are accelerated mainly at the termination shock then the inner knot makes a major contribution to the integral gamma-ray emission from the nebula around 100 MeV. The two-point spectral index,α0.64, based on the observed op-tical emission of the knot and the integral gamma-ray emission of the Crab nebula at 100 MeV, is consistent with this hypothesis. A similar value is obtained in the ‘standard model’ of the Crab nebula emission by Kennel & Coroniti (1984b) for the spectrum injected into the nebula by the termination shock.
(iv) The observed variability of the Crab nebula in the 1– 100 MeV window on the time-scale from 1 month to several years can be related to the large-scale variability of the termination shock discovered in recent high-resolution numerical simulations.
(v) The small size of the inner knot of the Crab nebula, 2–6 light-days, shows that the recently discovered short gamma-ray flares can also originate from the knot. However, the exact mechanism behind such short and rare events remains unclear.
The most critical prediction of our model, which allows a rel-atively simple test with currently available telescopes, is that the un-pulsed synchrotron gamma-ray emission of the Crab nebula in the Fermi and AGILE windows originates from within 1 arcsec of the pulsar itself. Although the angular resolution of gamma-ray telescopes is not even close to 1 arcsec, the test can be based on comparing the gamma-ray light curve with the one obtained in op-tics for the inner knot. Within 1 arcsec the inner knot is the dominant feature, apart from the pulsar itself. A potential problem of this test is the close proximity of the knot to the pulsar, which makes image-based separation of their fluxes rather tricky, even for HST and the ground-based instruments with adaptive optics. However, this does not seem to be needed as the pulsed emission from the Crab pulsar is very stable and its un-pulsed emission is not expected to be variable too. Hence, one only needs to measure the total flux from within
∼1 arcsec of the pulsar and subtract from it the phase-averaged flux of the pulsed emission. The optical variability is expected to be strong, as the typical flux from the inner knot is already about 6–10 per cent of the flux from the pulsar flux. The light curves in optics and gamma rays should correlate.
R E F E R E N C E S
Abdo A. A. et al. (The Fermi Collaboration), 2010, ApJ, 708, 1254 Abdo A. A. et al. (The Fermi Collaboration), 2011, Sci, 331, 739 Arons J., 2008, AIP Conf. Proc., 983, 200
Begelman M. C., 1998, ApJ, 493, 291 Bogovalov S. V., 1999, A&A, 349, 1017
Bogovalov S. V., Chechetkin V. M., Koldoba A. V., Ustyugova G. V., 2005, MNRAS, 358, 705
Camus N. F., Komissarov S. S., Bucciantini N., Hughes P. A., 2009, MNRAS, 400, 1241
de Jager O. C., Harding A. K., Michelson P. F., Nel H. I., Nolan P. L., Sreekumar P., Thompson D. J., 1996, ApJ, 457, 253
Del Zanna L., Amato E., Bucciantini N., 2004, A&A, 421, 1063 Hester J. J. et al., 1995, ApJ, 448, 240
Hester J. J. et al., 2002, ApJ, 577, L49
Horns D., Aharonian F. A., 2004, in Sch¨onfelder V., Lichti G., Winkler C., eds, Proc. 5th INTEGRAL Workshop 552, The INTEGRAL Universe. ESA, p. 439
Kennel C. F., Coroniti F. V., 1984a, ApJ, 283, 694 Kennel C. F., Coroniti F. V., 1984b, ApJ, 283, 710
Kirk J. D., Skjæraasen O., 2003, ApJ, 591, 366
Komissarov S. S., Lyubarsky Y. E., 2003, MNRAS, 344, L93 Komissarov S. S., Lyubarsky Y. E., 2004, MNRAS, 349, 779 Konigl A., 1980, Phys. Fluids, 26, 1083
Lampland C. O., 1921, PASP, 33, 79
Lind K. L., Blandford R. D., 1985, ApJ, 295, 258 Lyubarsky Y. E., 2003a, MNRAS, 339, 765 Lyubarsky Y. E., 2003b, MNRAS, 345, 153 Lyubarsky Y. E., Kirk J. D., 2001, ApJ, 547, 437 Lyutikov M., 2004, MNRAS, 353, 1095 Lyutikov M., 2010, MNRAS, 405, 1809
Majorana A., Anile A. M., 1987, Phys. Fluids, 30, 3045 Melatos A. et al., 2005, ApJ, 633, 931
Michel F. C., 1973, ApJ, 180, 133 Much R. P. et al., 1995, A&A, 299, 435 Rees M. J., Gunn J. E., 1974, MNRAS, 167, 1 Sandberg A., Sollerman J., 2009, A&A, 504, 525 Scargle J. D., 1969, ApJ, 156, 401
Sollerman J., 2003, A&A, 406, 639 Tavani M. et al., 2011, Sci, 331, 736
Tziamtzis A., Lundqvist P., Djupvik A. A., 2009, A&A, 508, 221 Volpi D., Del Zanna L., Amato E., Bucciantini N., 2008, A&A, 485, 337 Weisskopf C. et al., 2000, ApJ, 536, L81
Wilson-Hodge C. et al., 2011, ApJ, 727, L40
A P P E N D I X A : R E L AT I V I S T I C O B L I Q U E M H D S H O C K S
The first issue is how high can be the Lorentz factor downstream of an oblique shock. In the limit of vanishing magnetization, oblique relativistic shocks were studied by Konigl (1980). The general case of relativistic MHD shocks was considered in Majorana & Anile (1987), whereas Lyutikov (2004) explored the special case where the magnetic field is parallel to the shock front. Here, we deal only with this case, as the magnetic field of pulsar winds is almost perfectly azimuthal and hence parallel to the axisymmetric wind termination shock, and focus on the question of how relativistic can be the flow behind this shock.
In the shock frame, the fluxes of energy, momentum, rest mass and magnetic field are continuous across the shock
(w+B2)γ2
βx=const, (A1)
(w+B2)γ2βxβx+p+B 2
2 =const, (A2)
(w+B2) γ2
βxβy=const, (A3)
ργβx =const, (A4)
Bγβx =const, (A5)
whereρis the rest mass density, p is the gas pressure,w=ρc2+ κP
is the relativistic enthalpy,κ=/(−1), whereis the adiabatic index, B is the magnetic field as measured in the fluid frame,β= v/c andγ is the Lorentz factor. We select the frame where the velocity vector is in the xy-plane, the magnetic field is parallel to the z-direction and the shock front is parallel to the yz-plane. In what follows we will use subscripts 1 and 2 to denote the upstream and the downstream states, respectively.
From equations (A1) and (A3), it follows that
β1y=β2y, (A6)
2011 The Authors, MNRAS 414, 2017–2028
at University of Leeds on April 1, 2016
http://mnras.oxfordjournals.org/
whereas equations (A1), (A4) and (A5) yield
ρ2 ρ1
= B2 B1
= σ2 σ1
= η
χ, (A7)
a2 2 =
1 κ
η1+κa2 1+σ1
−σ1
η χ −1 , (A8)
whereσ =B2/4πρc2is the magnetization parameter, a2=p/ρc2 is the temperature parameter,χ=β2x/β1xand
η= γ1 γ2
=1+u21x(1−χ 2
)1/2. (A9)
Equations (A6)–(A9) allow us to find the downstream state given the parameters of the upstream state andχ. The equation forχ is derived via substituting the expressions forρ2,σ2 and a2 from equations (A6)–(A8) into equation (A2), which can be written as
1+κa2 1+σ1
j2 ρ1
+ρ1
a2 1+
1 2σ1
=1+κa2 2+σ2
j2 ρ2
+ρ2
a22+ 1 2σ2
, (A10)
where j=ργ βx. In general, this is a rather cumbersome algebraic
equation which has to be solved numerically. However, the pulsar winds are expected to be cold (a1 →0) and highly relativistic (γ1 1), which allows significant simplifications. In the limit of cold upstream flow, this equation reduces to
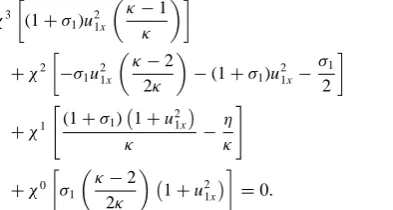
χ3
(1+σ1)u21x
κ−1 κ
+χ2
−σ1u21x
κ−2 2κ
−(1+σ1)u21x− σ1
2
+χ1 (1+σ1)
1+u2 1x κ − η κ
+χ0
σ1
κ−2
2κ 1+u
2 1x
=0. (A11)
Further simplification can be made if u1x 1. If we denote the angle between the shock plane and the velocity vector asδ, then this condition impliesδ1 1/γ1. In this case, the above equation reduces to the cubic equation forχ
χ3(1+
σ1)(κ−1)−χ2
σ1 3κ−2
2 +κ
+χ(1+σ1)+σ1
κ−2 2
=0 (A12)
Its rootχ=1 corresponds to the continuous solution. Of the other two roots only
χ= 2+6σ1+
√ D 4(1+σ1)(κ−1)
, (A13)
where
D=(2+σ1κ)2−8(1+σ1)σ1(κ−1)(2−κ),
is physical. For the ultra-relativistic equation of state, with=4/3 andκ=4, this becomes
χ= 1+2σ1+
16σ2
1 +16σ1+1 6(1+σ1)
. (A14)
The corresponding downstream Lorentz factor is
γ2= 1
1−χ2 1 sinδ1
[image:11.595.309.548.53.297.2]. (A15)
Figure A1. Downstream Lorentz factor of oblique shocks as a function of the shock angle. Solid lines correspond to the upstream Lorentz factorγ1= 106and the magnetization parameterσ=0.01, 1.0 and 10. The dashed line corresponds toγ1=10 andσ=0.01.
Forσ1 1 this yields
γ2 σ11/2 sinδ1,
(A16)
and forσ11
γ2 3
2√2
1+1 2σ1
1 sinδ1
[image:11.595.50.247.345.450.2]. (A17)
Fig. A1 showsγ2(δ1) forσ1=0, 1 and 10. The downstream shock angle
tanδ2=χ(σ1) tanδ1. (A18)
Forσ1 and in the small angle approximation, this yields
δ2 1
3δ1. (A19)
The general conclusion from this analysis is that the downstream flow can be highly relativistic, provided the shock is sufficiently oblique. The current two-dimensional MHD models of PWN do predict a very oblique termination shock due the anisotropic dis-tribution of energy flux in the pulsar wind. For σ1 1 in the pulsar wind, the case favoured by the models, and in the small an-gle approximation, we haveγ21/δ1. The Lorentz factor can be significantly higher ifσ >1.
In the numerical simulations cited above the Lorentz factor of pulsar wind was rather low,γ110. The results for such a relatively low upstream Lorentz factor are shown in Fig. A1 by the dashed line. One can see that this really becomes a factor only for very small shock angles,δ1<0.2.
2011 The Authors, MNRAS 414, 2017–2028
at University of Leeds on April 1, 2016
http://mnras.oxfordjournals.org/
S U P P O RT I N G I N F O R M AT I O N
Additional Supporting Information may be found in the online ver-sion of this article:
Simulation movie. The termination shock variability. The colour
represents the magnetic field strength (in Gauss). The unit of length is one light-year.
Please note: Wiley-Blackwell are not responsible for the content or functionality of any supporting materials supplied by the authors. Any queries (other than missing material) should be directed to the corresponding author for the article.
This paper has been typeset from a TEX/LATEX file prepared by the author.
2011 The Authors, MNRAS 414, 2017–2028
at University of Leeds on April 1, 2016
http://mnras.oxfordjournals.org/