R E S E A R C H A R T I C L E
Open Access
The predictive validity of three self-report
screening instruments for identifying frail older
people in the community
Ramon Daniels
1,2,3,4*, Erik van Rossum
2,3,4, Anna Beurskens
2,4, Wim van den Heuvel
4,5and Luc de Witte
3,4Abstract
Background:If brief and easy to use self report screening tools are available to identify frail elderly, this may avoid costs and unnecessary assessment of healthy people. This study investigates the predictive validity of three self-report instruments for identifying community-dwelling frail elderly.
Methods:This is a prospective study with 1-year follow-up among community-dwelling elderly aged 70 or older (n = 430) to test sensitivity, specificity, and positive and negative predicted values of the Groningen Frailty Indicator, Tilburg Frailty Indicator and Sherbrooke Postal Questionnaire on development of disabilities, hospital admission and mortality. Odds ratios were calculated to compare frail versus non-frail groups for their risk for the adverse outcomes.
Results:Adjusted odds ratios show that those identified as frail have more than twice the risk (GFI, 2.62; TFI, 2.00; SPQ, 2,49) for developing disabilities compared to the non-frail group; those identified as frail by the TFI and SPQ have more than twice the risk of being admitted to a hospital. Sensitivity and specificity for development of disabilities are 71% and 63% (GFI), 62% and 71% (TFI) and 83% and 48% (SPQ). Regarding mortality, sensitivity for all tools are about 70% and specificity between 41% and 61%. For hospital admission, SPQ scores the highest for sensitivity (76%).
Conclusion:All three instruments do have potential to identify older persons at risk, but their predictive power is not sufficient yet. Further research on these and other instruments is needed to improve targeting frail elderly.
Background
The prevalence of frailty increases with age. Frail elderly have a higher risk of disabilities, fall incidents, hospitali-zation, institutionalihospitali-zation, and death compared to non-frail elderly [1]. With regard to a growing non-frail popula-tion, prevention of adverse outcomes in community-dwelling frail older people is considered to be a priority for research and clinical practice in geriatric care [2].
Effective screening of frailty is crucial in optimizing care to this vulnerable group [3]. Although various tools have been developed, there is not yet a standardized and valid method to screen for frailty. Several authors [4,5] emphasize a two-step approach in preventive interven-tions, in which screening is followed by extensive
assessment. If brief and easy to use self report screening tools are available, this approach may avoid costs and unnecessary assessment of healthy people. It is, there-fore, important to study whether tools can predict rele-vant outcomes associated with frailty. We focused on three available instruments for community-dwelling elderly care: the Groningen Frailty Indicator (GFI) [6], the Tilburg Frailty Indicator (TFI) [7] and the Sher-brooke Postal Questionnaire (SPQ) [5].
All instruments were developed to screen for frailty as a first step in identification. In a Canadian sample of community-dwelling older people, sufficient predictive validity for the SPQ, with regard to functional decline, was reported [5]. There are also positive indications for its predictive value with regard to requirements for further assessment [8], use of emergency services [9], and mortality [10]. We found in a Dutch sample of community-dwelling older people that the GFI and TFI
* Correspondence: [email protected]
1
Faculty of Health and Care, Zuyd University of Applied Sciences, PO Box 550, 6400 AN Heerlen, The Netherlands
Full list of author information is available at the end of the article
have high internal consistency and construct validity in contrast to the SPQ [11]. In a cross-sectional study, Gobbens et al. [7] reported strong associations between TFI scores and quality of life, disability, and use of nur-sing and informal care. No longitudinal studies on the predictive values of the GFI and TFI have been con-ducted yet. The aim of this study is to compare these values of the GFI, TFI and SPQ for relevant adverse outcomes in community-dwelling frail elderly: the devel-opment of disabilities, hospital admission, and mortality.
Methods
Study design and participants
A longitudinal study was conducted in a sample of 687 community-dwelling older people living in the areas of Limburg and Utrecht in the Netherlands. Older people were identified between November 2008 and April 2009 (T1) from the panels of four general practitioners (GPs). All persons aged 70 years or above from each of the panels received a letter from their GP with an invitation to fill in a questionnaire. The questionnaire included the three frailty instruments (GFI, TFI, SPQ) and an instru-ment that measures disability with respect to activities of daily living: the Groningen Activity Restriction Scale (GARS) [12]. After 2 weeks, a reminder was sent to non-responders. A pilot study showed that this postal procedure was feasible [13].
One year later (T2), the same questionnaire was sent again to all participants who had provided written con-sent and responded to the first measurement, except those who had been admitted to a nursing home. This time a question about admission to a hospital in the previous year was added. The study did not require approval from an ethical committee according to Dutch law [14]. Participants gave their written informed con-sent based on a patient information letter that accompa-nied the questionnaire. This letter was formulated according to guidelines of good clinical practice. General practitioners were not informed about the frailty states of their patients.
Data collection
The three frailty instruments and the disability measure are briefly described below. For an overview of all items
of the three instruments see Additional file 1: Frailty
Instruments: Overview of all items.
Frailty instruments
The Groningen Frailty Indicator (GFI), developed in the Netherlands by Steverink and colleagues [6], is a screen-ing instrument for determinscreen-ing the level of frailty. It consists of fifteen items, and focuses on the loss of func-tions and resources in four domains of functioning: phy-sical (nine items), cognitive (one item), social (three items), and psychological (two items). Most items can
be answered with‘yes’or‘no’. For the cognitive and psy-chosocial items, the option‘sometimes’is added. Scores on the GFI range from zero to fifteen. A total score of four or higher is considered as moderately to severely frail [6,15].
The Dutch Tilburg Frailty Indicator (TFI) has recently been described by Gobbens and colleagues [7] and con-sists of two subscales. The first subscale (ten items) comprises socio-demographic data and data about life-events and chronic diseases. The analyses of predictive values focuses on the second subscale, which determines the level of frailty. This subscale consists of fifteen items about physical (eight items), social (three items), and psychological factors (four items), including one item about cognition. Most items can be answered with ‘yes’ or ‘no’. For the psychological items, the option‘
some-times’is added. Scores for the TFI range from zero to
fifteen. A score of five or higher is considered to be associated with frailty [7].
The Sherbrooke Postal Questionnaire (SPQ) was developed in Canada by Hébert and colleagues [5] and consists of six items. These focus on the physical (four items), social (one item), and cognitive (one item) domains of functioning. Items can be answered with ‘yes’or‘no’. Scores range from zero to six. Those scor-ing two or higher, or who do not respond to the ques-tionnaire, are considered to have an increased risk for functional decline and, therefore, are assumed to be frail. It should be noted that in the present study non-responders were excluded from the analyses.
Outcome measures
The Groningen Activity and Restriction Scale (GARS) [12] is a valid and reliable instrument for measuring dis-ability. The first subscale is about activities of daily liv-ing (ADL) (eleven items). The second subscale relates to instrumental activities of daily living (IADL) (seven items). Items can be answered on a four point scale. In line with the GARS manual [16], the items were dichot-omized into being independent or being dependent regarding performance of an activity. Development of disability was defined as (at least) one new disability, meaning a change on at least one of the 18 items of the GARS from being independent to being dependent.
Regarding hospital admission, we asked“have you been
admitted to a hospital in the previous year”. A hospital stay, for at least 1 day, was regarded as hospital admis-sion. The GP provided data at T2 about persons who had died during follow up.
Statistical analysis
substitution [17]. To investigate whether baseline char-acteristics of participants who were lost to follow-up dif-fered from those who remained in the sample, the independent samples t-tests, chi-square tests and Ken-dall’s tau-c tests were used. The areas under the receiver operating characteristic (ROC) curve (AUC) for the pro-posed cut off points were calculated to compare the accuracy of the instruments. With these points sensitiv-ity, specificsensitiv-ity, and positive and negative predicted values were determined for development of disabilities, mortal-ity, and hospital admission. To avoid ceiling effects in calculating predictive values regarding development of disabilities, those scoring 60 or higher on the GARS at T1 (n = 4) were removed from analyses. Odds ratios (OR) were calculated to compare frail versus non-frail
groups for their risk for the adverse outcomes. OR’s
adjusted for age, sex, GARS score on T1, education, and income were calculated using logistic regression (fixed model).
Results
Of the 687 elderly people who were invited, 532 (77%) returned the baseline postal questionnaire and gave written consent. One year later, the same questionnaire was sent to 514 of these 532 participants (15 partici-pants had died and three had been admitted to a
nur-sing home); 440 (86%) returned the second
questionnaire. Ten participants were excluded as there were clear signs that the respondents were not the same at T1 and T2. The frailty instrument with the greatest number of excluded respondents due to missing values (> 25% missing values) was the SPQ (n = 8). For the GFI and the TFI, one and two persons, respectively, were excluded due to missing values. On an item-level the number of missing values ranged from zero to eight (GFI), from zero to twelve (TFI) and from one to ten (SPQ). The average number of missing values per item was 2.4, 5.1 and 5.3 for the GFI, the TFI and the SPQ, respectively.
Finally, 430 participants were included in the analyses (63% of the original sample) for calculating the predic-tive values for developing disabilities and hospital admis-sions (for mortality analysis n = 532).
Characteristics of participants at T1 and T2, as well as non-responders at T2, are listed in Table 1. The mean age at T1 was 77.2 years (SD = 5.5) and about 60% were women. Nearly half of the sample (48.6%) had a second-ary educational level. A large proportion of people
(42.4%) had a net income of more than € 1500 (per
month/per household). When using the proposed cut-off points, the GFI detected 245 frail cases (46.3%). The TFI and the SPQ identified 40.2% and 59.1% of the population as frail, respectively. The mean GARS total score at T1 was 24.9 (range 18-72) and 24.2 at T2,
indicating hardly any change in disability on a popula-tion level over a 1 year period. In comparison with par-ticipants that remained in the sample (n = 430), non-responders on T2 (n = 74) had slightly more difficulties in performing activities of daily living, a lower educa-tional background, and lower income. However, these non-responders were not significantly more frail.
Out of 430 older persons, 105 (24%) experienced development of disability; they became dependent on at least one (other) of the 18 GARS activities during fol-low-up (≥1 new disability). In total 184 new disabilities occurred in 1 year; 35% in ADL and 65% in IADL. Dis-ability in taking care of feet and toenails accounted for 55% of ADL disability, followed by disability in going up and down the stairs (14%). Not being able to do shop-ping independently accounted for 26% of IADL disabil-ity, followed by disability in light household activities and heavy household activities (both 18%). 75 persons (17%) were admitted to a hospital during follow-up. Fif-teen persons had died, and three became nursing home residents.
Table 2 shows how the development of disability, mortality and hospital admission are distributed accord-ing to the frailty scores. In all cases elderly identified by any of the three instruments as frail had more adverse outcomes in the following year than those in the non-frail group. For example, in the group identified as non-frail by the GFI, 38% developed new disabilities while this proportion was 13% in the non-frail group.
Table 3 shows that values for area under curve for all three instruments at the proposed cut off points related to all dependent variables (development of disability, mortality, and hospital admission) are between 0.54 and 0.67. Based on the proposed cut off points, diagnostic values were calculated as shown in Table 3. Compared to 71% for the GFI and 62% for the TFI, the SPQ has the highest sensitivity (83%) regarding development of disabilities. Specificity is lowest for the SPQ (48%). The positive predicted values of the GFI, TFI, and SPQ are up to 40% and all have high (at least 85%) negative pre-dicted values. Regarding mortality, sensitivity for all tools are about 70% and specificity between 41% and 61%. Positive predicted values are very low, and negative predicted values all very high. Regarding hospital admis-sion, SPQ scores the highest for sensitivity (76%), com-pared to GFI (52%) and TFI (53%). In contrast, specificity is lower for SPQ (44%) in comparison with GFI (55%) and TFI (65%).
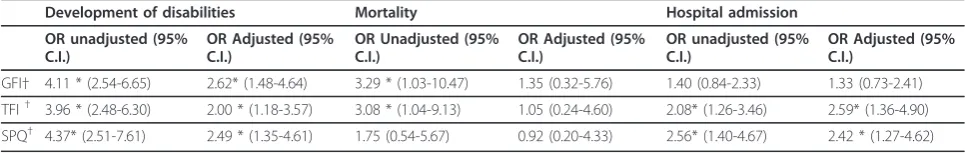
instruments. The unadjusted odds ratios for mortality are only significant for GFI (3.29) and TFI (3.08), but their impact diminishes after adjusting for baseline char-acteristics and GARS T1 scores. Regarding hospital admission, only the unadjusted odds ratios of TFI and SPQ reach significance.
Discussion
The aim of this study was to compare the predictive values of three short postal screening instruments for identifying community dwelling frail older persons: the Groningen Frailty Indicator (GFI), the Tilburg Frailty Indicator (TFI) and the Sherbrooke Postal Questionnaire (SPQ).
The associated AUC values, between 0.54 and 0.67, indicate poor performance regarding prediction of any of the dependent variables (development of disability, mortality, and hospital admission). Despite high preva-lences of frailty (between 40 and 60%), the positive pre-dicted values of the tools are low. The adjusted odds ratios show that those identified as frail have more than twice the risk (GFI, 2.62; TFI, 2.00; SPQ, 2,49) for devel-oping disabilities within 1 year compared to the non-frail group; those identified as non-frail by the TFI and SPQ have more than twice the risk of being admitted to a hospital.
[image:4.595.56.542.98.412.2]This is the first time that these three instruments are compared in one study for their predictive values. The postal procedure proved to be feasible with high response rates. A limitation of our study can be that, by
Table 1 Patient characteristics
T1 (n = 532) T2 (n = 430) Non-responders (n = 74)
Significance-level difference responders/non-responders at T1†
Age
- 70-74 193 (36.3) 158 (36.7) 24 (32.4) p= 0.46
- 75-79 193 (36.3) 157 (36.5) 28 (37.8)
-≥80 146 (27.4) 115 (26.7) 22 (29.7)
Women 311 (58.5) 259 (60.2) 39 (52.7) p= 0.22
Education*
- None/primary education 186 (35.7) 140 (32.9) 31 (41.9) p= 0.05 - Secondary education 253 (48.6) 213 (50.1) 30 (40.5)
- Higher education 82 (15.7) 72 (16.9) 8 (10.8)
Income*
-≤900 93 (18.7) 64 (15.6) 24 (32.4) p< 0.001
- 901 - 1500 194 (39.0) 157 (38.4) 28 (37.8)
-≥1501 211 (42.4) 188 (46.0) 15 (20.3)
Frail
- GFI (≥4) 245 (46.3) 198 (46.0) 32 (43.2) p= 0.63
- TFI (≥5) 211 (40.2) 162 (38.2) 35 (47.9) p= 0.12
- SPQ (≥2) 305 (59.1) 250 (58.1) 37 (52.9) p= 0.28
Disability (mean)
- GARS total (18-72) 24.9 (sd 9.3) 24.2 (sd 8.3) 28.2 (sd 12.6) p< 0.001 - GARS-ADL (11-44) 13.9 (sd 4.5) 13.5 (sd 3.9) 15.6 (sd 6.5) p< 0.001 - GARS-HDL (7-28) 11.1 (sd 5.4) 10.7 (sd 4.9) 12.7 (sd 6.7) p< 0.001
Mortality - 15 (2.8%)
-Hospital admission - 75 (17.4%)
-*Due to missings small differences between n and numbers of participant reported for education and income can occur Comparison of these subgroups on baseline scores
Table 2 Distribution of development of disability, mortality and hospital admission according to frailty scores
[image:4.595.57.291.601.713.2]Functional decline Mortality Hospital admission (N = 426)* (N = 532)* (N = 430)*
+ - + - +
-GFI: + 74 (38%) 120 (62%) 11 (4%) 234 (96%) 39 (20%) 159 (80%) GFI: - 30 (13%) 200 (87%) 4 (1%) 280 (99%) 36 (16%) 194 (84%)
TFI: + 64 (41%) 93 (59%) 10 (5%) 201 (95%) 39 (24%) 122 (76%) TFI: - 39 (15%) 224 (85%) 5 (2%) 309 (98%) 35 (13%) 228 (87%)
SPQ: + 85 (34%) 162 (66%) 10 (3%) 295 (97%) 55 (22%) 195 (78%) SPQ: - 18 (11%) 150 (89%) 4 (2%) 207 (98%) 17 (10%) 152 (90%)
dichotomizing development of disabilities, we might have missed more subtle changes in performance of activities. However, from a clinical perspective, a change from independent to dependent seems more important. Previous studies into frailty used a similar approach for the development of disabilities [18,19]. One could argue that the follow-up period of 1 year is too short to moni-tor relevant adverse outcomes. However, in our study 24% of older persons did develop disabilities over a one-year period, and from a GP perspective, 1 one-year seems a reasonable timeframe for pro-active elderly care. The study may have been biased due to treatments that par-ticipants received (or did not receive) during the follow-up period influencing changes in disability. However, general practitioners were unaware of the frailty state of their patients and if care was received then this is the case for both frail and non frail respondents.
It is likely that cognitive impairments in the target population have affected the validity of the self reported data. Persons with severe impairments may have been part of the non-responders, thereby influencing the underestimation of frailty prevalences. Further, respon-ders with cognitive impairments may have provided non-reliable information in returned questionnaires. No data are available though about the cognitive
impairments among the target population. Based on the high response and the minor changes in disability in the population over a 1 year period, we assume that the influence of (severe) cognitive impairments on the valid-ity of the data is small.
Finally, the SPQ was not used according to protocol [5], as non-responders were excluded from analyses. If we had considered non-responders also at risk, this would have resulted at T1 in a frailty prevalence esti-mate of 67.0% instead of 59.1%.
[image:5.595.60.540.98.275.2]The prevalence estimates of 40% to 60% found in the present study are high compared to other studies [19,20]. It is important to realize that prevalence esti-mates strongly depend on the interpretation of the con-cept of frailty and the approach that is chosen to measure it. The instruments chosen for this study are based on a multifactorial approach to frailty; lower pre-valence estimates are found for instruments based on the definition of physical frailty. Interesting is that frailty scores did not change dramatically over a one-year time period. There are several possible explanations. There may have been a balance in the number of older persons with new incidents of frailty and those who were frail and passed away. Further, we have to consider that frailty is a dynamic process including transitions from
Table 3 Diagnostic values of the screening tools* for development of disabilities, mortality and hospital admission
Sensitivity (95% C.I.)
Specificity (95% C.I.)
Positive predicted value (95% C.I.)
Negative predicted value (95% C.I.)
Area under the Curve (95% C.I.)
Development of Disabilities (n = 426)
GFI 71 (62-79) 63 (57-68) 38 (31-45) 87 (81-90) 67 (61-73)
TFI 62 (52-71) 71 (65-76) 40 (33-49) 85 (80-89) 66 (60-72)
SPQ 83 (74-89) 48 (42-54) 34 (29-41) 89 (83-93) 65 (60-71)
Mortality(n = 532)
GFI 73 (44-91) 54 (50-58) 4 (2-8) 98 (96-99) 64 (50-77)
TFI 67 (39-87) 61 (56-65) 5 (2-8) 98 (96-99) 64 (50-78)
SPQ 71 (42-90) 41 (37-46) 3 (1-6) 98 (94-98) 56 (42-71)
Hospital admission(n = 430)
GFI 52 (40-64) 55 (50-60) 20 (15-26) 84 (79-89) 54 (46-61)
TFI 53 (41-64) 65 (60-70) 24 (18-32) 87 (82-90) 60 (52-67)
SPQ 76 (65-85) 44 (39-49) 22 (17-28) 90 (84,94) 60 (53-67)
*Cut-off scores: GFI≥4, TFI≥5, SPQ≥2
Table 4 Odds ratios Unadjusted and Adjusted for sex, age, income, education, GARS (T1)
Development of disabilities Mortality Hospital admission
OR unadjusted (95% C.I.)
OR Adjusted (95% C.I.)
OR Unadjusted (95% C.I.)
OR Adjusted (95% C.I.)
OR unadjusted (95% C.I.)
OR Adjusted (95% C.I.)
GFI† 4.11 * (2.54-6.65) 2.62* (1.48-4.64) 3.29 * (1.03-10.47) 1.35 (0.32-5.76) 1.40 (0.84-2.33) 1.33 (0.73-2.41)
TFI† 3.96 * (2.48-6.30) 2.00 * (1.18-3.57) 3.08 * (1.04-9.13) 1.05 (0.24-4.60) 2.08* (1.26-3.46) 2.59* (1.36-4.90)
SPQ† 4.37* (2.51-7.61) 2.49 * (1.35-4.61) 1.75 (0.54-5.67) 0.92 (0.20-4.33) 2.56* (1.40-4.67) 2.42 * (1.27-4.62)
*Significant atp≤0,05
[image:5.595.56.539.636.713.2]frail to non-frail. On the other hand, the frailty instru-ments may not be sensitive enough to detect small changes in frailty status.
Our diagnostic values of the SPQ for development of disabilities are comparable with those Hébert et al. [5] found among elderly persons over 74 (sensitivity 75% and specificity 52%). Gobbens et al. [7] presented for the TFI a sensitivity of 84% and specificity of 76% for identi-fying frail elderly at risk for disability. However, this was based on a cross-sectional study design. As mentioned earlier, the adjusted odds ratios show that those identi-fied as frail by the GFI, TFI, and SPQ have, more than twice the risk for developing disabilities within 1 year. Sarkisian et al. [21] found in a cohort study that elders identified as frail with the CHS frailty index, as pro-posed by Fried et al. [20], had a age-adjusted odds ratio of 4.4 for disability over a 4 year period. Ensrud et al. [19] found, in a prospective cohort study for women (≥69) identified frail with the CHS frailty index, a higher
age adjusted risk (OR 2.2-2.8) for disability (≥1 new
IADL disability) over a period of 4 and a half years. Dif-ferences in estimated risks between those and our study may be attributed for a large part to variation in follow-up periods.
There is a public health need for effective interven-tions targeting community-dwelling frail elderly promot-ing their independent functionpromot-ing in daily life [22]. Prevention of disability in frail older persons contributes to the maintenance of quality of life and reduced health care costs [23]. Supporting primary care to address the needs and health risks of frail elderly is a strategy to control costs as it is expected to prevent institutional care and promote consistency and coordination of indi-vidual care [24]. A multifactorial and multidisciplinary approach towards disability prevention in community dwelling frail elderly seems promising [25,26]. For an example of an innovative primary care intervention we refer to a description of our disability-prevention pro-gramme [27]. Effective screening is a crucial first step in these programmes to select the appropriate target group. Postal screening questionnaires such as the GFI, TFI and SPQ do have potential to identify older persons at risk.
Our previous study [28] showed that extensive assess-ment after screening is necessary, as the scalability of the instruments is poor. The current study shows that the predictive power of the instruments is not sufficient yet. The high prevalence of frailty may point to the pos-sibility that a substantial proportion of these elderly is pre-frail. In a two-step approach towards screening, the sensitivity will be the most relevant criterion. In that perspective, the SPQ scores best, followed by the GFI. The SPQ has the highest sensitivity (83%) for develop-ment of disabilities; though with a specificity of 48%, a
large proportion of older persons that do not develop disabilities are identified. A number of 18 out of 103 elderly who developed disabilities were not identified as frail and thus will not receive an additional assessment. General practitioners who wish to start pro-active elderly care could consider the use of a short postal screening tool in combination with strategies to reduce the number of false positives and false negatives. The additional use of clinical judgment with an instrument as the Clinical Frailty Scale [29] after the preliminary screening might be an option to reduce false positives. This judgment could be based on a recent consultation or a new appointment in which the GP focuses on recent transitions in functioning. Still, more research is necessary to optimize screening in community-dwelling frail elderly.
Conclusion
The Groningen Frailty Indicator, Tilburg Frailty Indica-tor and Sherbrooke Postal Questionnaire do have poten-tial to identify older persons at risk, but their predictive power is not sufficient yet. Further research on these and other instruments is needed to improve targeting frail elderly.
Additional material
Additional file 1: Overview of frailty instruments.
Abbreviations
GFI: Groningen frailty indicator; TFI: Tilburg frailty indicator; SPQ: Sherbrooke postal questionnaire; GARS: Groningen activity restriction scale; GP: General practitioner; ADL: Activities of daily living; IADL: Instrumental activities of daily living
Acknowledgements
The authors would like to thank: the elderly people who participated in this study, the general practitioners and their staff, the Centre for Data and Information Management at Maastricht University (MEMIC), and Silke Metzelthin MSc. and Melanie Kleynen MSc. for their assistance in the data collection. We thank Dr. Marieke Spreeuwenberg for statistical advice. Funding
This study was funded by Stichting Innovatie Alliantie and Zuyd University of Applied Sciences.
Author details
1
Faculty of Health and Care, Zuyd University of Applied Sciences, PO Box 550, 6400 AN Heerlen, The Netherlands.2Centre of Research on Autonomy
and Participation, Zuyd University of Applied Sciences, PO Box 550, 6400 AN Heerlen, The Netherlands.3Centre of Research on Technology in Care, Zuyd
University of Applied Sciences, PO Box 550, 6400 AN Heerlen, The Netherlands.4School for Public Health and Primary Care, Maastricht
University, PO Box 616, 6200 MD Maastricht, The Netherlands.5University
Medical Centre Groningen, University of Groningen, PO Box 30, 0019700 RB Groningen, The Netherlands.
Authors’contributions
and the process of writing the manuscript. All authors have read and approved the final version of the manuscript.
Competing interests
The authors declare that they have no competing interests.
Received: 19 April 2011 Accepted: 23 January 2012 Published: 23 January 2012
References
1. Bergman H, Ferrucci L, Guralnik J, Hogan DB, Hummel S, Karunananthan S, Wolfson C:Frailty: an emerging research and clinical paradigm-issues and controversies.J Gerontol A Biol Sci Med Sci2007,62(7):731-737. 2. Walston J, Hadley EC, Ferrucci L, Guralnik JM, Newman AB, Studenski SA,
Ershler WB, Harris T, Fried LP:Research agenda for frailty in older adults: toward a better understanding of physiology and etiology: summary from the American Geriatrics Society/National Institute on Aging Research Conference on frailty in older adults.J Am Geriatr Soc2006, 54(6):991-1001.
3. Abellan van Kan G, Rolland YM, Morley JE, Vellas B:Frailty: toward a clinical definition.J Am Med Dir Assoc2008,9(2):71-72.
4. De Lepeleire J, Degryse J, Illiffe S, Mann E, Buntinx F:Family physicians need easy instruments for frailty.Age Ageing2008,37(4):484, author reply 484-485..
5. Hebert R, Bravo G, Korner-Bitensky N, Voyer L:Predictive validity of a postal questionnaire for screening community-dwelling elderly individuals at risk of functional decline.Age Ageing1996,25(2):159-167. 6. Steverink N, Slaets JPJ, Schuurmans H, Lis van M:Measuring frailty.
development and testing of the Groningen Frailty Indicator (GFI). Gerontologist2001,41:236-237.
7. Gobbens RJ, van Assen MA, Luijkx KG, Wijnen-Sponselee MT, Schols JM:The Tilburg Frailty Indicator: psychometric properties.J Am Med Dir Assoc
2010,11(5):344-355.
8. Roberts HC, Hemsley ZM, Thomas G, Meakins P, Powell J, Robison J, Gove I, Turner G, Sayer AA:Nurse-led implementation of the single assessment process in primary care: a descriptive feasibility study.Age Ageing2006, 35(4):394-398.
9. Walker L, Jamrozik K, Wingfield D:The Sherbrooke questionnaire predicts use of emergency services.Age Ageing2005,34(3):233-237.
10. Roberts H, Hemsley Z, Thomas G, Aihie Sayer A, Gove I, Turner G, Meakins P, Morran-Ryan M, Purcell A, Powell J:Can the Sherbrooke postal questionnaire predict who will require comprehensive assessment in the single assessment process?British Geriatrics SocietyBirmingham, UK: Spring Meeting; 2005, 13-15 Apr 2005..
11. Metzelthin SF, Daniels R, van Rossum E, de Witte L, van den Heuvel WJ, Kempen GI:The psychometric properties of three self-report screening instruments for identifying frail older people living in the community. BMC Publ Health2010,10:176.
12. Kempen GI, Miedema I, Ormel J, Molenaar W:The assessment of disability with the Groningen Activity Restriction Scale. Conceptual framework and psychometric properties.Soc Sci Med1996,43(11):1601-1610. 13. Steinbusch C:Screening of frail elderly in the communityMaastricht:
Maastricht; 2008, The feasibility and psychometric properties of three instruments. MSc thesis..
14. subjects C-ccorih:Manual for the review of medical research involving human subjects.Edited by: CCMO. The Hague; 2002:.
15. Schuurmans H, Steverink N, Lindenberg S, Frieswijk N, Slaets JP:Old or frail: what tells us more?J Gerontol A Biol Sci Med Sci2004,59(9):M962-M965. 16. Kempen GIJM, Doeglas DM, Suurmeijer TPBM:The asessment of (I)ADL
with the Groningen Activity Restriction Scale-a manual (in Dutch). Groningen, The Netherlands: Nothern Centre for Health Care Research, University of Groningen; 1993.
17. Fox-Wasylyshyn SM, El-Masri MM:Focus on research methods handling missing data in self-report measures.Res Nurs Health2005,28:488-495. 18. Hoogerduijn JG, Schuurmans MJ, Korevaar JC, Buurman BM, de Rooij SE:
Identification of older hospitalised patients at risk for functional decline, a study to compare the predictive values of three screening
instruments.J Clin Nurs2010,19(9- 10):1219-1225.
19. Ensrud KE, Ewing SK, Taylor BC, Fink HA, Cawthon PM, Stone KL, Hillier TA, Cauley JA, Hochberg MC, Rodondi N,et al:Comparison of 2 frailty indexes
for prediction of falls, disability, fractures, and death in older women. Arch Intern Med2008,168(4):382-389.
20. Fried LP, Tangen CM, Walston J, Newman AB, Hirsch C, Gottdiener J, Seeman T, Tracy R, Kop WJ, Burke G,et al:Frailty in older adults: evidence for a phenotype.J Gerontol A Biol Sci Med Sci2001,56(3):M146-M156. 21. Sarkisian CA, Gruenewald TL, John Boscardin W, Seeman TE:Preliminary
evidence for subdimensions of geriatric frailty: the MacArthur study of successful aging.J Am Geriatr Soc2008,56(12):2292-2297.
22. Health Council of the Netherlands:Prevention in the elderly: Focus on functioning in daily lifeThe Hague: Health Council of the Netherlands; 2009. 23. Cutler DM:Declining disability among the elderly.Health Aff2001,
20(6):11-27.
24. Schafer W, Kroneman M, Boerma W, van den Berg M, Westert G, Deville W, van Ginneken E:The Netherlands: health system review.Health Syst Transit2010,12(1):v-xxvii, 1-228..
25. Beswick AD, Rees K, Dieppe P, Ayis S, Gooberman-Hill R, Horwood J, Ebrahim S:Complex interventions to improve physical function and maintain independent living in elderly people: a systematic review and meta-analysis.Lancet2008,371(9614):725-735.
26. Daniels R, Metzelthin SF, van Rossum E, de Witte L, Kempen GI, van den Heuvel W:Interventions to prevent disability in frail community-dwelling older persons: an overview.European Journal of Ageing2010,7(1):37-55. 27. Daniels R, van Rossum E, Metzelthin S, Sipers W, Habets H, Hobma S, van
den Heuvel W, de Witte L:A disability prevention programme for community-dwelling frail older persons.Clin Rehabil2011,25(11):963-974. 28. Metzelthin SF, Daniels R, van Rossum E, de Witte LP, van den Heuvel WJ,
Kempen GI:Psychometrische eigenschappen van drie
screeningsinstrumenten voor kwetsbaarheid bij thuiswonende ouderen. Tijdschr Gerontol Geriatr2011,42:120-130.
29. Rockwood K, Song X, MacKnight C, Bergman H, Hogan DB, McDowell I, Mitnitski A:A global clinical measure of fitness and frailty in elderly people.CMAJ2005,173(5):489-495.
Pre-publication history
The pre-publication history for this paper can be accessed here: http://www.biomedcentral.com/1471-2458/12/69/prepub
doi:10.1186/1471-2458-12-69
Cite this article as:Danielset al.:The predictive validity of three self-report screening instruments for identifying frail older people in the community.BMC Public Health201212:69.
Submit your next manuscript to BioMed Central and take full advantage of:
• Convenient online submission
• Thorough peer review
• No space constraints or color figure charges
• Immediate publication on acceptance
• Inclusion in PubMed, CAS, Scopus and Google Scholar
• Research which is freely available for redistribution