R E S E A R C H
Open Access
Influence of fermentation conditions on the
surface properties and adhesion of
Lactobacillus
rhamnosus
GG
Gurjot Deepika
1, Esther Karunakaran
2, Claire R Hurley
3, Catherine A Biggs
2and Dimitris Charalampopoulos
1*Abstract
Background:The surface properties of probiotic bacteria influence to a large extent their interactions within the gut ecosystem. There is limited amount of information on the effect of the production process on the surface properties of probiotic lactobacilli in relation to the mechanisms of their adhesion to the gastrointestinal mucosa. The aim of this work was to investigate the effect of the fermentation pH and temperature on the surface properties and adhesion ability to Caco-2 cells of the probiotic strainLactobacillus rhamnosusGG.
Results:The cells were grown at pH 5, 5.5, 6 (temperature 37°C) and at pH 6.5 (temperature 25°C, 30°C and 37°C), and their surfaces analysed by X-ray photoelectron spectrometry (XPS), Fourier transform infrared spectroscopy (FT-IR) and gel-based proteomics. The results indicated that for all the fermentation conditions, with the exception of pH 5, a higher nitrogen to carbon ratio and a lower phosphate content was observed at the surface of the bacteria, which resulted in a lower surface hydrophobicity and reduced adhesion levels to Caco-2 cells as compared to the control fermentation (pH 6.5, 37°C). A number of adhesive proteins, which have been suggested in previous published works to take part in the adhesion of bacteria to the human gastrointestinal tract, were identified by proteomic analysis, with no significant differences between samples however.
Conclusions:The temperature and the pH of the fermentation influenced the surface composition, hydrophobicity and the levels of adhesion ofL. rhamnosusGG to Caco-2 cells. It was deduced from the data that a protein rich surface reduced the adhesion ability of the cells.
Introduction
Lactic acid bacteria and in particular lactobacilli have been extensively used in the food and pharmaceutical industries and play an important role in the control of undesirable microorganisms in the intestinal and urogenital tract. For this reason, their use as probiotics has been extensively studied, aiming to elucidate the mechanisms of actions and produce strains with enhanced activities. One of the main criteria for selecting probiotic strains is their ability to ad-here to the intestinal epithelium, as this determines their interactions with the host and the microorganisms present in the host system [1]. The adhesion of probiotic bacteria to the gastrointestinal tract is commonly tested in vitro using model cell lines, such as Caco-2 cells [2], mucus [3]
and extracellular matrix components, such as collagens, fibronectin and laminin [4]. Certain studies have suggested a correlation betweenin vitroandin vivoresults, indicating thatin vitroadhesion could be used for predicting the resi-dence time of probiotics in the human gastrointestinal tract [5,6]. The adhesion ability of probiotics is closely linked with their surface properties, as these influence to a large extent the interactions within the gut ecosystem. The cell wall of Gram positive bacteria, including that of lactobacilli, consists of a thick peptidoglycan layer, which is decorated with various components, including (lipo-) teichoic acids, polysaccharides, covalently bound proteins and S-layer proteins [7,8].
In general, the production process for probiotics involves the batch growth of probiotics in large scale bioreactors. Research so far has shown that the fermen-tation characteristics, including the growth medium and the fermentation temperature and pH, besides affecting * Correspondence:[email protected]
1
Food and Nutritional Sciences, University of Reading, PO Box 226, Reading, UKRG6 6AP
Full list of author information is available at the end of the article
the cell yield, can also affect the technological properties of the cells. These include for example their ability to survive freezing or freeze drying and storage post-drying, or survive in highly acidic solutions or in the presence of high bile concentrations [9-12]. It has been suggested that these properties are influenced by the physiological state of the cells, and are associated with changes in the fatty acid composition, the membrane permeability or the enzymatic activities of the cells [12,13]. Although there is a good indication of the link that exists between the production process and the physiological characteris-tics of the cells, there is a limited knowledge on the effect of the production process on the surface properties of probiotic lactobacilli, and on how these relate to the adhesion of the probiotic cells to the gastrointestinal mucosa. The factors that have been investigated so far, and which have been shown to influence bacterial adhe-sion to Caco-2 cells, include the incubation time and the composition of the growth medium [14,15]. Moreover,
research from our group using Lactobacillus rhamnosus
GG, a well-established probiotic strain, indicated that the adhesion of the bacterial cells to Caco-2 cells is influenced by the presence of proteins and non-proteinaceous com-pounds, such as carbohydrates and phosphate-containing compounds on the surface of the cells, and is affected by the growth time [15]. The aim of this work was to investi-gate the effect of the fermentation pH (pH 5, 6, 6.5 and uncontrolled pH) and temperature (25, 30 and 37°C, all at pH 6.5) on the surface properties ofL. rhamnosusGG and on its ability to adhere to Caco-2 cells. The rationale be-hind this is that sub-optimal process conditions have been shown to affect the technological properties of the cells and are therefore likely that they can affect the surface properties of the cells, and consequently their adhesion abilities. This work is novel and important in our effort to understand the adhesion mechanisms and identify meth-odologies to manipulate the adhesion abilities of the strains. To this end, a variety of spectroscopic techniques and gel based proteomic analysis were employed to study the surface composition of the bacterial cells.
Materials and methods
Bacterial strain and growth conditions
Lactobacillus rhamnosusGG (ATCC 53103) was obtained
from ATCC (Middlesex, UK) and was stored at−80°C in
2 ml cryovials containing 20% v v-1glycerol. The inocu-lum was grown overnight in 10 ml de Man Rogosa Sharpe (MRS) medium (Oxoid, UK) at 37°C. The cells from the overnight culture were washed with phosphate buffered saline (PBS) (Oxoid, UK) to remove the carry-over medium and then re-suspended in PBS. An aliquot from the cell suspension was used to inoculate the fer-mentation medium so that an initial optical density
(OD600) of 0.2 was obtained. The fermentation medium
consisted of 20 g l-1glucose (Sigma, Poole, UK), 10 g l-1 yeast extract (Oxoid, Basingstoke, UK), 15 g l-1vegetable peptone (Oxoid), 1% Tween 80 (Sigma, Poole, UK),
0.2 g l-1 MgSO4 × 7H2O (VWR, Lutterworth, UK),
0.05 g l-1MnSO4 × 4H2O (VWR), and 0.1 M phosphate
buffer (VWR). The fermentations were carried out an-aerobically, with continuous addition of N2, in 300 ml
custom-made glass bioreactors containing 200 ml of media, at different conditions. These included various pH values, i.e. pH 6.5, pH 6, pH 5.5, pH 5 and uncon-trolled pH (all at a temperature of 37°C), and tempera-tures, i.e. 25°C, 30°C, and 37°C (all at a pH of 6.5). The control fermentation was carried out at 37°C, with the pH at 6.5. The growth of the bacteria was monitored by
measuring the OD600and by viable cell counting using
MRS agar (Oxoid, UK) plates. The fermentations were performed in duplicate. The cultures were incubated for up to 2 h after the end of the stationary phase, and the bacteria harvested by centrifugation (3000 g) and freeze dried in 10% sucrose (VWR) solution, as described pre-viously [14]. The cells were collected by centrifugation at 3000 g for 10 min and re-suspended in 5 ml of 10% (w v-1)
sucrose solution to obtain an OD600 value of about 4.
The cell suspension was frozen at−80°C and then dried
in an IEC Lyoprep-3000 freeze dryer (Lyoprep, Dun-stable, UK). The freeze dried cells were stored at room temperature in desiccators for further analysis.
X-ray photoelectron spectroscopy (XPS)
For XPS analysis, the freeze dried bacterial samples were washed 3 times with sterile ultra-pure water and the pel-lets were aseptically air dried on glass cover slips. These were then mounted onto the standard sample bar using double sided adhesive tape. The XPS measurements were made with a KRATOS AXIS Ultra DLD Photoelectron
spectrometer at 10 kV and 15 mA, using an Al KαX-ray
source (1486.6 eV) based on a previously described method [15]. The takeoff angle was fixed at 90°. For each sample, the data were collected from three randomly selected locations, and the sampling area was 300 ×
700μm. The analysis consisted of a wide survey scan
(160 eV pass energy; 1.0 eV step size) and a high-resolution scan (20 eV pass energy; 0.1 eV step size). The binding energies of the peaks were determined using the C1s peak at 284.6 eV. The software Casa XPS 2.3.1250 was used to fit the XPS spectra peaks. No constraint was applied to the initial binding energy values, however the full width at half-maximum (FWHM) was maintained constant for the carbon contributions in a particular spectrum.
Fourier transform infrared spectroscopy (FT-IR)
spectrophotometer equipped with an attenuated total re-flectance (ATR) system (Pike Technologies) as previously described [14]. To prepare the sample, the freeze-dried bacteria were re-suspended in 1 ml of sterile deionised (DI) water; 20μl of this cell suspension were allowed to air-dry on a diamond crystal attached to the
spectropho-tometer. At least 64 scans between 4000 and 900 cm-1
with a resolution of 4 cm1 were recorded for each
sample using the Happ-Genzel apodisation function. Principal component analysis (PCA) of the FTIR spectra
was carried out at the wave number region 800–
1800 cm-1with XLSTAT software (http://www.xlstat.
com/; version 13.1.05) using the Pearson correlation.
Proteomic analysis
Extraction and SDS PAGE analysis of cell wall associated proteins
The cell wall associated proteins were extracted as described previously, with some modifications [16]. Briefly, the freeze dried bacteria were washed and the cell pellet, corresponding to 20 ODml of culture (ODml is defined as the OD600 of the cell suspension multiplied
by the volume of the suspension, in ml), was
re-suspended in 3 ml of extraction buffer (100 mM Tris–
HCl, pH 8.0, 5 mM EDTA and 1 mg ml-1lysozyme), and
incubated at 37°C for 3 h. The supernatant was recov-ered and the proteins were precipitated with ice-cold acetone. The protein pellet was solubilised in loading buffer, and the proteins separated by sodium dodecyl sulphate poly acrylamide gel electrophoresis (SDS-PAGE) using a 12% (w/v) polyacrylamide gel, following the method previously described by Laemmli (1970) [17]. The electrophoresis was carried out at constant voltage (120 V) until the bromophenol blue tracking dye front reached the bottom of the gel. The gels were stained with Bio-Safe Coomassie blue stain (Bio-Rad) according
to the manufacturer’s protocol. Low molecular weight
protein markers (New England Biolabs) were used as protein standards.
In-gel digestion of proteins using trypsin
The protein bands obtained after one dimensional gel electrophoresis were cut out, and the proteins embedded in the gel matrix were digested using trypsin [18]. Briefly, the Coomassie stain was washed away using ammonium bicarbonate and the proteins were reduced using dithio-threitol (DTT) and alkylated using iodoacetamide (IAA). The proteins in the gel matrix were subject to trypsin di-gestion overnight in the presence of ammonium bicar-bonate and acetonitrile. The peptides were eluted from the gel matrix using repeated washing using formic acid, ammonium bicarbonate and acetonitrile, dried using a vacuum concentrator (Eppendorf ), and stored at−20°C.
Protein identification
The dried peptide samples were re-suspended in 20 μl
Switchos buffer (3% acetonitrile and 0.1% trifluoroacetic acid). Mass spectrometry was performed on the samples using an electrospray ionisation (ESI)-ion trap (HCT Ultra, Bruker Daltonics) coupled with an online capillary liquid chromatography system (Famos, Switchos and Ul-timate from Dionex/LC Packings). The peptides were separated on a PepMap C-18 RP capillary column (Dio-nex/LC Packings) at a constant flow rate of 0.3μl min-1, with a linear gradient elution using buffer A (3% nitrile and 0.1% formic acid) and buffer B (97% aceto-nitrile and 0.1% formic acid), starting with 3% buffer A up to 35% buffer B over 45 minutes. Data acquisition was set in the positive ion mode with a mass range of
300 – 2000 m/z. Tandem mass spectrometry was
per-formed on peptides with +2, +3, and +4 charge states. The identification of the proteins was performed using the L. rhamnosus GG ATCC 53103 protein database, downloaded from Uniprot (http://www.uniprot.org). The search parameters were set at a mass tolerance of 1.2 Da, MS/MS tolerance of 0.6 Da, one missed cleavage of tryp-sin, oxidation of methionine, and cysteine modification with IAA. Molecular Weight Search (MOWSE) scores greater than 50, were considered significant [19]. The hydrophobicity of the identified proteins was determined by the hydropathy (GRAVY) index using ProtParam tool (www.expasy.org/proteomictools/protparam), as described previously [20].
Microbial adhesion to hexadecane (MATH)
The microbial adhesion to hexadecane (MATH) assay was employed to evaluate the hydrophobicity of the sur-face of the bacterial cells obtained from the various fer-mentations. The method was carried out as described previously [21]. Briefly, the freeze-dried cells were
washed with PBS and suspended in 10 mM KH2PO4
(Sigma) to obtain an OD600~ 0.8. The pH of the
suspen-sion was adjusted to 3 with 1 M HCl. 2 ml of the bacter-ial cell suspension was then mixed with equal volume of hexadecane (Sigma) in a 10 ml syringe. The mixture was vortexed for 1 min and then left undisturbed for 20 min to allow complete phase separation. After equilibration, the aqueous phase was removed carefully, in order not to disturb the interfacial equilibrium, and the optical
density (OD600) was measured. The percentage adhesion
(% adhesion) was calculated using the following equation:
%adhesion to hexadecane¼ 1A1
A0
100 ð1Þ
where A0is the initial absorbance (at 600 nm) of the
bac-terial suspension and A1 is the absorbance after 20 min
Adhesion to Caco-2 cells
The adhesion assay was performed as described previ-ously [14] with slight modifications. More specifically, after addition of the bacterial cells into the wells and in-cubation for 60 min at 37°C, in 5% CO2and 95% air, the
Dulbecco’s phosphate buffered saline (DPBS) (Oxoid)
fraction containing unbound bacteria from each well was transferred into a sterile tube. The wells were further washed with 1 ml of DPBS to remove any non-specifically bound bacteria, and the wash added into the same tube. The number of bacteria bound to the Caco-2 cells was determined by subtracting the number of un-bound bacteria from the total number of bacteria added to the well. Each adhesion experiment was performed in triplicate.
Statistical analysis
For statistical comparisons, one-way ANOVA was used (with 95% confidence interval), using SPSS (IBM SPSS Inc.).
[image:4.595.57.540.497.704.2]Results Bacterial growth
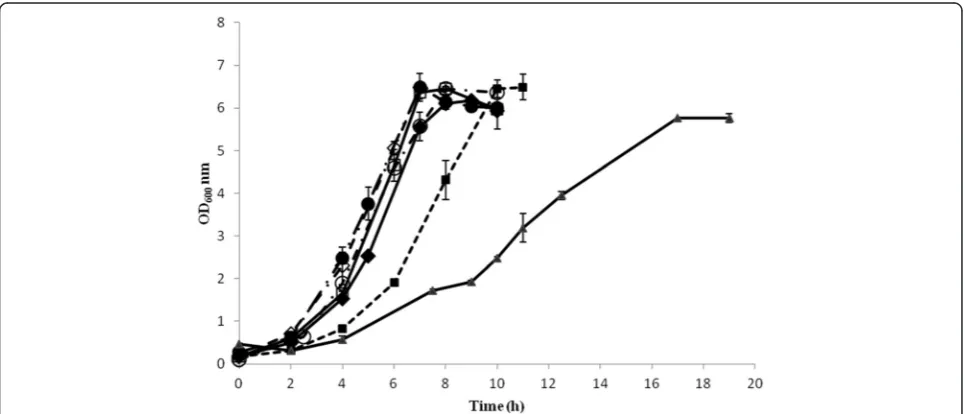
Figure 1 depicts the cell growth under the different fer-mentation conditions. The cells grew well in most
condi-tions, reaching a maximum OD600 value between 6 and
7 in about 6 h to 8 h. In the case of the fermentation
car-ried out at 25°C, the maximum OD600 was around 5.5.
In the case of the fermentations carried out at different
pH, the growth rates (μ) were similar ranging between
0.92 h-1 and 1.10 h-1, with that of pH 5 slightly higher than the rest. In the case of the fermentations carried out at different temperatures, the cells grew slower at
30°C (μ ~ 0.77 h-1, stationary phase was reached after 10 h) than in the control fermentation, and considerably slower at 25°C (0.36 h-1, stationary phase was reached after 17 h) (Table 1).
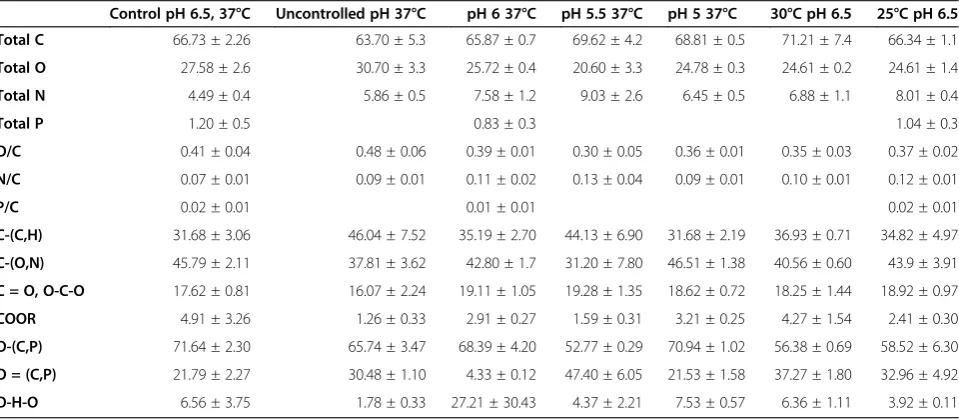
XPS analysis
The elemental composition of the bacterial surfaces, resulting from integrating the C1s, O1s, N1s, and P2p peaks from the survey spectra, and the functional group compositions are presented in Table 2 (Annex 1 for a representative spectrum, Additional file 1). The nitrogen appeared at a binding energy of 398.59 eV and is attribu-ted to the amine or amide groups of proteins. The phos-phorus appeared at a binding energy of 132.15 eV and is attributed to phosphate groups. The XPS peaks corre-sponding to C and O were analyzed at high resolution and were de-convoluted to assess the contributions from each component. The carbon peak (C1s) was fit into four components: carbon bound only to carbon and hydrogen, Cs(C,H), at 282.7 eV; carbon singly bound to oxygen or nitrogen from ethers, alcohols, amines or amides, Cs (O,N), at 284.1 eV; carbon doubly bonded to oxygen or singly bonded to two oxygen atoms from amides, carbonyls, carboxylates, esters, acetals or hemi-acetals, C=O and O-C-O, at 285.4 eV; and carbon attrib-utable to carboxylic functions, COOR, at 286.7 eV. The oxygen peak (O1s) was best fit with three contributions: oxygen double bonded with carbon or phosphorus from carboxylic acids, carboxylates, esters, carbonyls, amides, or phosphoryl groups, C=O and P=O, at 529.7 eV; and oxygen attributable to hydroxide, phosphate, acetal, or hemiacetal, C-OH, C-O-C, and PsOH, at 530.5 eV. The oxygen peak (O1s) was best fit with three contributions:
oxygen double bonded with carbon or phosphorus from carboxylic acids, carboxylates, esters, carbonyls, amides, or phosphoryl groups, C=O and P=O, at 529.7 eV; oxygen attributable to hydroxide, phosphate, acetal, or hemiacetal, C-OH, C-O-C, and P-OH, at 530.5 eV; and oxygen attributable to trapped water, at 534.5781 eV [22].
The survey scans revealed that the bacterial cell surface from all the fermentations consisted mainly of C, O and N. Small amounts of P were detected on the surface of the bacteria from the control fermentation (pH 6.5, 37°C), as well as from the fermentations carried out at pH 6 (37°C) and at 25°C (pH 6.5). Compared to the control fermentation, the cells from all the fermentations that were carried out exhibited higher nitrogen to carbon ratios (N/C), whereas the O/C ratios were in some cases slightly lower (pH 5, pH 5.5, pH 6, 30°C and 25°C), or slightly higher (uncontrolled pH). In respect to the functional components, the cells from the control
fermentation and the fermentation carried out at pH 5 showed a higher concentration of O-(C,P) and a lower concentration of O=(C,P) compared to the rest of the fermentations. Although the differences were small, the cells from the control fermentation and the fermenta-tion carried out at pH 5 showed higher C-(N,O) concen-trations compared to the rest.
FT-IR analysis
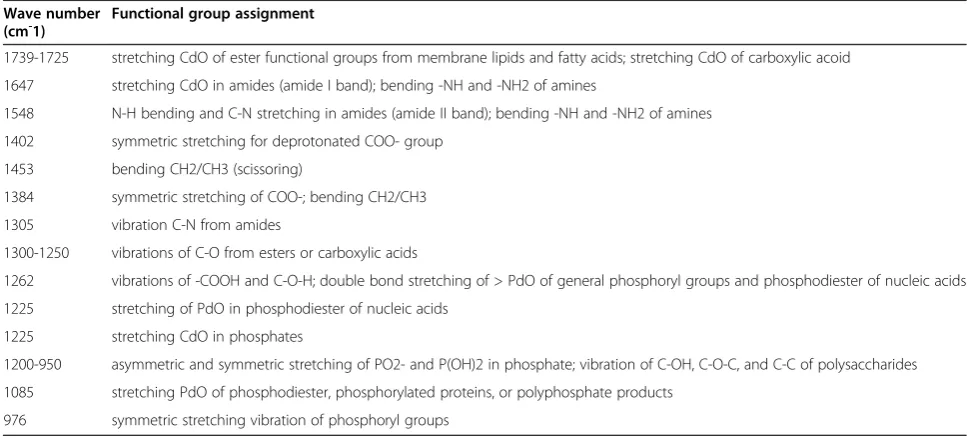
Figure 2 presents the FT-IR spectra of the bacterial cells grown in the different fermentation conditions. The ab-sorption band assignments corresponding to the func-tional groups of macromolecules are summarised in Table 3. Among the samples, differences were observed
in the carbohydrate region (1200 – 950 cm-1) of the
spectra, and also in the areas corresponding to the stretching of phosphate groups (~1225 cm-1) and of the C=O and C-N groups in the amide I and II bands, re-spectively. In particular, in the cells from the fermenta-tions carried out at 25°C and 30°C, peak shifts were observed in the carbohydrate region, whereas in the cells from the uncontrolled pH fermentation, a peak shift was observed in the phosphate region.
[image:5.595.56.291.111.222.2]Principle Component Analysis (PCA) was performed on the data (see Additional file 2: Figure S1). The PCA showed that the 25°C 6.5 pH sample clustered separate from the rest and control conditions were significantly different from the rest of the conditions. Though the subtle differences observed were not picked in the PCA analysis and were not statistically significant, they pos-sibly can have an effect on the surface properties. Table 1 Growth rates ofL. rhamnosusGG growing at
different fermentation conditions
Fermentation Growth rate (h-1)
37°C, pH 6.5 0.95
37°C, uncontrolled pH 0.92
37°C, pH 6 0.97
37°C, pH 5.5 0.95
37°C, pH 5 1.10
30°C, pH 6.5 0.77
[image:5.595.59.539.515.725.2]25°C, pH 6.5 0.36
Table 2 XPS analysis of freeze driedL. rhamnosusGG cells produced at different fermentation conditions: pH 6.5, 37°C (control); pH uncontrolled, 37°C; pH 6, 37°C; pH 5.5, 37°C; pH 5, 37°C; pH 6.5, 30°C and pH 6.5, 25°C
Control pH 6.5, 37°C Uncontrolled pH 37°C pH 6 37°C pH 5.5 37°C pH 5 37°C 30°C pH 6.5 25°C pH 6.5
Total C 66.73 ± 2.26 63.70 ± 5.3 65.87 ± 0.7 69.62 ± 4.2 68.81 ± 0.5 71.21 ± 7.4 66.34 ± 1.1
Total O 27.58 ± 2.6 30.70 ± 3.3 25.72 ± 0.4 20.60 ± 3.3 24.78 ± 0.3 24.61 ± 0.2 24.61 ± 1.4
Total N 4.49 ± 0.4 5.86 ± 0.5 7.58 ± 1.2 9.03 ± 2.6 6.45 ± 0.5 6.88 ± 1.1 8.01 ± 0.4
Total P 1.20 ± 0.5 0.83 ± 0.3 1.04 ± 0.3
O/C 0.41 ± 0.04 0.48 ± 0.06 0.39 ± 0.01 0.30 ± 0.05 0.36 ± 0.01 0.35 ± 0.03 0.37 ± 0.02
N/C 0.07 ± 0.01 0.09 ± 0.01 0.11 ± 0.02 0.13 ± 0.04 0.09 ± 0.01 0.10 ± 0.01 0.12 ± 0.01
P/C 0.02 ± 0.01 0.01 ± 0.01 0.02 ± 0.01
C-(C,H) 31.68 ± 3.06 46.04 ± 7.52 35.19 ± 2.70 44.13 ± 6.90 31.68 ± 2.19 36.93 ± 0.71 34.82 ± 4.97
C-(O,N) 45.79 ± 2.11 37.81 ± 3.62 42.80 ± 1.7 31.20 ± 7.80 46.51 ± 1.38 40.56 ± 0.60 43.9 ± 3.91
C = O, O-C-O 17.62 ± 0.81 16.07 ± 2.24 19.11 ± 1.05 19.28 ± 1.35 18.62 ± 0.72 18.25 ± 1.44 18.92 ± 0.97
COOR 4.91 ± 3.26 1.26 ± 0.33 2.91 ± 0.27 1.59 ± 0.31 3.21 ± 0.25 4.27 ± 1.54 2.41 ± 0.30
O-(C,P) 71.64 ± 2.30 65.74 ± 3.47 68.39 ± 4.20 52.77 ± 0.29 70.94 ± 1.02 56.38 ± 0.69 58.52 ± 6.30
O = (C,P) 21.79 ± 2.27 30.48 ± 1.10 4.33 ± 0.12 47.40 ± 6.05 21.53 ± 1.58 37.27 ± 1.80 32.96 ± 4.92
O-H-O 6.56 ± 3.75 1.78 ± 0.33 27.21 ± 30.43 4.37 ± 2.21 7.53 ± 0.57 6.36 ± 1.11 3.92 ± 0.11
Surface protein profile
The SDS PAGE analysis showed similar protein profiles between the different fermentation conditions. Figure 3 depicts a representative gel of the surface proteins of the
[image:6.595.59.540.89.389.2]control fermentation (37°C, pH 6.5) and the uncon-trolled fermentation (37°C, unconuncon-trolled pH). In total, 82 proteins were identified at the surface of the cells by proteomic analysis (Annex 2, Additional file 3), with the Figure 2FT-IR spectra ofL. rhamnosusGG produced at different fermentation conditions: pH 6.5, 37°C (control); pH uncontrolled, 37°C; pH 6, 37°C; pH 5.5, 37°C; pH 5, 37°C; pH 6.5, 30°C and pH 6.5, 25°C.The spectra are the average of scans from two fermentations.
Table 3 Functional group assignment of FT-IR spectra (adapted from [17])
Wave number
(cm-1) Functional group assignment
1739-1725 stretching CdO of ester functional groups from membrane lipids and fatty acids; stretching CdO of carboxylic acoid
1647 stretching CdO in amides (amide I band); bending -NH and -NH2 of amines
1548 N-H bending and C-N stretching in amides (amide II band); bending -NH and -NH2 of amines
1402 symmetric stretching for deprotonated COO- group
1453 bending CH2/CH3 (scissoring)
1384 symmetric stretching of COO-; bending CH2/CH3 1305 vibration C-N from amides
1300-1250 vibrations of C-O from esters or carboxylic acids
1262 vibrations of -COOH and C-O-H; double bond stretching of > PdO of general phosphoryl groups and phosphodiester of nucleic acids
1225 stretching of PdO in phosphodiester of nucleic acids
1225 stretching CdO in phosphates
1200-950 asymmetric and symmetric stretching of PO2- and P(OH)2 in phosphate; vibration of C-OH, C-O-C, and C-C of polysaccharides
1085 stretching PdO of phosphodiester, phosphorylated proteins, or polyphosphate products
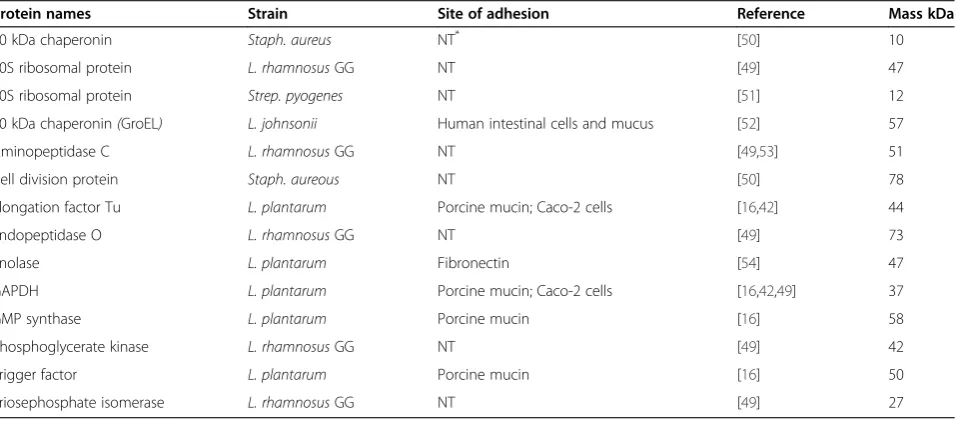
[image:6.595.55.539.515.734.2]majority of them being common for all fermentations. Table 4 lists the most important surface-associated pro-teins that were identified on the surface of the cells, and which were previously shown or suggested to be
involved in the adhesion of lactobacilli or other Gram positive bacteria to various cell lines, mucus, and extra-cellular matrix components. Four proteins that have been commonly associated with the adhesion of various
lactobacilli to the gastrointestinal mucosa, namely α
-enolase, elongation factor Tu (EF-Tu), glyceraldehyde-3-phosphate dehydrogenase (GAPDH), and GroES chaper-onin were identified on the cell surface. The GRAVY index suggested that all these proteins had a hydrophilic character.
Cell surface hydrophobicity
Figure 4 presents the results from the MATH assay. It can be observed that the highest hydrophobicity value was obtained for the cells grown at pH 5, which showed almost 100% adhesion to hexadecane, and sig-nificantly (p < 0.05) higher than the control fermenta-tion. The cells from all the other fermentations were significantly (p < 0.05) less hydrophobic compared to the control fermentation.
Adhesion to Caco-2 cells
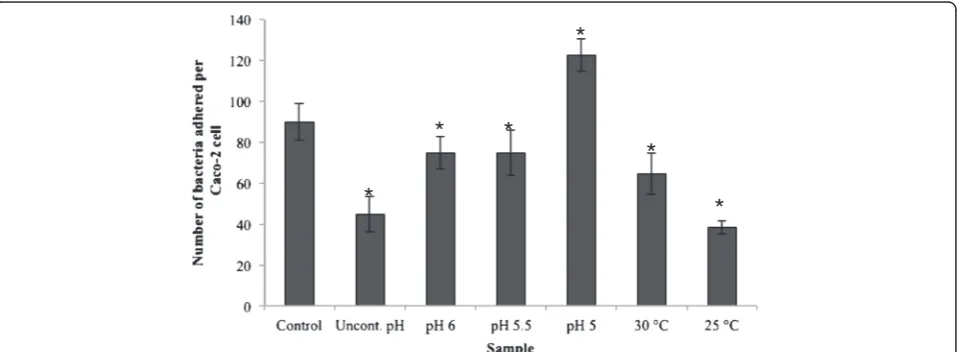
Figure 5 presents the results from the adhesion of the bacterial cells, obtained from the different fermentations, to Caco-2 cells. The maximum adhesion value, almost 120 bacteria per Caco-2 cell, was obtained for the cells from the fermentation carried out at pH 5, and was followed by the control fermentation. The bacterial cells from the rest of the fermentations were significantly (p < 0.05) less adhesive than the cells from the control fermentation. Similarly to the hydrophobicity trend, the bacterial cells that were grown at suboptimal tem-peratures (25°C, 30°C) were significantly (p < 0.05)
116 kDa 97.4 kDa 66.3 kDa 55.4 kDa
36.5 kDa 21.5 kDa
14.4 kDa
6 kDa
3.5 kDa
2.1 kDa
[image:7.595.56.291.88.374.2]M 1 2 3 4
[image:7.595.61.540.515.726.2]Figure 3Representative SDS page gel image of potential proteins on the surface ofL. rhamnosusGG.Lanes: M: protein marker (Mark12); 1,2: control fermentation (duplicate samples); 3,4: uncontrolled fermentation (duplicate samples).
Table 4 List of proteins identified on the surface ofL. rhamnosusGG that have been associated with adhesion to cell lines, mucin and extracellular matrix components
Protein names Strain Site of adhesion Reference Mass kDa
10 kDa chaperonin Staph. aureus NT* [50] 10
30S ribosomal protein L. rhamnosusGG NT [49] 47
50S ribosomal protein Strep. pyogenes NT [51] 12
60 kDa chaperonin(GroEL) L. johnsonii Human intestinal cells and mucus [52] 57
Aminopeptidase C L. rhamnosusGG NT [49,53] 51
Cell division protein Staph. aureous NT [50] 78
Elongation factor Tu L. plantarum Porcine mucin; Caco-2 cells [16,42] 44
Endopeptidase O L. rhamnosusGG NT [49] 73
Enolase L. plantarum Fibronectin [54] 47
GAPDH L. plantarum Porcine mucin; Caco-2 cells [16,42,49] 37
GMP synthase L. plantarum Porcine mucin [16] 58
Phosphoglycerate kinase L. rhamnosusGG NT [49] 42
Trigger factor L. plantarum Porcine mucin [16] 50
Triosephosphate isomerase L. rhamnosusGG NT [49] 27
less adhesive than the bacterial cells grown at sub-optimal pH (5, 5.5, 6).
Discussion
The aim of this work was to evaluate the effect of the fermentation conditions, and in particular the pH and
temperature, on the surface properties of L. rhamnosus
GG and its adhesion to Caco-2 cells. The influence of the production process on the surface characteristics and adhesion abilities of probiotic lactobacilli is a relatively unexplored area. Recent studies from our research group and other published works have shown that the incuba-tion time and the composiincuba-tion of the fermentaincuba-tion medium are important factors [7,14,23], whereas studies focusing on the downstream processing, e.g. drying of
probiotics, have shown that drying affects the physico-chemical surface properties ofLactobacilluscells [24,25]. Identifying possible ways to control the surface proper-ties of the bacterial cells is very important in order to produce cells with enhanced functionality. This is the first study of its kind that looks at the fermentation and processing part and tries to relate the physical and bio-chemical properties of the bacterial cells to find answers related to the functional aspects of the probiotics, such as adhesion to the human GI tract.
It can be deduced from the growth curves in Figure 1 that carrying out the fermentation at suboptimal tem-peratures (i.e. 25°C and 30°C) resulted in lower growth rates, and in the case of the 25°C to a lower final cell density too, compared to 37°C. In contrast, the pH of the
*
*
*
*
[image:8.595.60.540.88.275.2]*
*
Figure 4% Adhesion to hexadecane ofL. rhamnosusGG cells produced at different fermentation conditions: pH 6.5, 37°C (control); pH uncontrolled, 37°C; pH 6, 37°C; pH 5.5, 37°C; pH 5, 37°C; pH 6.5, 30°C and pH 6.5, 25°C.Error bars represent standard deviation. The star (*) represents statistical significant difference compared to the control fermentation (p < 0.05).
*
*
*
*
*
*
[image:8.595.60.540.526.702.2]fermentation, within the range studied, did not seem to affect considerably the growth rate, nor the final cell density. The literature has shown that the pH and temperature influence the growth behaviour of lactoba-cilli and the final yield obtained, although substantial dif-ferences can be observed, depending on the strain. It has also been reported that a lower pH of fermentation, for example pH 5 compared to pH of around 6, is likely to result to the production of physiologically more robust cells [26], which are able to survive better freezing and frozen storage [12], freeze drying [27] and acid stress [28]. In the case of temperature, it was also suggested that suboptimal conditions of growth, for example 30°C compared to 37°C, produced cells that were better able to survive freezing and frozen storage. A link was also shown to exist between the membrane fatty acid com-position and increased cryotolerance [12]. The condi-tions used in this study for the control fermentation, i.e.
37°C and pH 6.5, are typical for Lactobacillus growth
and reflect the optimal conditions for achieving high cell yields, while the fermentation medium used is typical of a growth medium used for large production, and was optimised in a previous study in terms of cell growth and cell survival upon freeze drying [10]. The rationale behind selecting pH and temperature values lower than the optimal was the increased robustness and improved technological properties observed in previous studies, which were most likely associated with compositional and conformational changes taking place at the cell membrane. Thus, it could be likely that important changes were also taking place at the surface of the cells when growing the cells at such conditions, which would affect their adhesion properties.
The adhesion levels of the cells from the different fer-mentations ranged from 40 to 120 bacteria per Caco-2 cell (Figure 5), which is within the range of previous reports [14,29,30]. The main source of knowledge about the adhesive properties of lactobacilli is from studies using in vitro model systems, although in vivo/ex vivo studies have also been used to a much lesser extent [31]. Various studies have shown a good correlation between
in vitro adhesion, using for example Caco-2 and HT29 cell lines, andin vivoadhesion based on the results from human intervention studies [32,33]. Tissue culture cells, such as Caco-2, HT-29 and HT-29 MXT cells, are com-monly used forin vitroadhesion studies [34-36]. Caco-2 cells exhibit many properties of the small intestine as they form a polarised monolayer of differentiated colum-nar absorptive cells expressing a brush border [37]. In the present study, with the exception of the cells from the fermentation carried out at pH 5, the rest of the cells were significantly less adhesive to Caco-2 cells compared to the cells from the control fermentation (p < 0.05).
The lowest adhesion to Caco-2 cells was observed for the cells from the 25°C and uncontrolled pH fermenta-tion, which had a higher total N content and N/C ratio as compared to the control sample. The cells from the 25°C fermentation showed also a slightly lower total O content and O/C ratio compared to the control fermen-tation. In the same way, the cells from the 30°C were characterised by a lower adhesion value and a higher total N content and N/C ratio (0.10) than the control fermentation. The above suggest that the exposure of proteins at the surface of the cells was higher than in the case of the control fermentation, whereas the exposure of carbohydrates and phosphate-containing compounds was probably lower. Consequently, it could be deduced that a cell surface richer in proteins resulted in a lower adhesion to Caco-2 cells, a conclusion that has also been suggested by our previous published studies [14]. No dif-ferences were observed between the concentrations of various functional groups, especially the C-(O,N), C=O and O-C-O groups, which could correspond to carbohy-drates. On the other hand, a considerable increase in the case of the O = (C,P) group for the uncontrolled pH, pH 5.5, 25°C and 30°C fermentations was observed com-pared to the control fermentation. This could potentially suggest an increase in the concentration of amide bonds, and thus of proteins. The results obtained from the XPS analysis coincided with the FT-IR results, although it is difficult to quantitatively correlate these. The FT-IR data showed a peak shift in the carbohydrate region of the spectra (1200–950 cm-1), as well as a number of peaks that emerged in the amide I and II regions, which could suggest that conformational changes took place in the cell surface components. Principle Component Analysis (PCA) was performed on the FTIR data. Though the subtle differences observed in the peak shift were not picked in the PCA analysis and were not statistically sig-nificant. These changes along with other compositional and conformational modifications of the bacterial surface might have an effect on the net surface properties such as adhesion to Caco-2 cells. Interestingly, the hydropho-bicity of the cells from the 25°C and 30°C fermentations was drastically reduced compared to the control, which is difficult to explain, as the general consensus is that hydrophilic cells are most likely covered by carbohy-drates [7,38,39]. However, this depends on the strain, and it most likely applies for Lactobacillus strains that contain the highly hydrophobic S-layer proteins, mean-ing that fermentation conditions that do not favour the expression of the S-layer proteins on the surface result
in more hydrophilic cells. However, L. rhamnosus GG
could thus explain the observed decrease in the hydro-phobicity for these particular samples.
The cells from the fermentations carried out at pH 6, pH 5.5, and with no pH control, exhibited significantly (p < 0.05) lower adhesion to Caco-2 cells compared to the cells from the control fermentation. The atomic ratios and the concentrations of the functional groups obtained from XPS analysis, were similar to those for the 25°C and 30°C fermentations, suggesting that the cells had a protein-rich surface with very low amounts of phosphate-containing compounds. These observations were also in agreement with the hydrophobicity values, which were considerably lower than in the case of the control fermentation. Regarding the fermentation carried out at pH 5, the cells showed higher adhesion than the cells from the control fermentation, and very high hydro-phobicity as compared to the control (p < 0.05). It is interesting to note that the XPS data in this case were more similar to the data from the control fermentation rather than to the other fermentations, and more specif-ically the total N and O content. Also, the concentrations of the C-(O,N), C=O and O-C-O groups were all similar, suggesting a similar surface composition to the cells from the control fermentation. The differences in adhe-sion between the cells from the pH 5 fermentation and the control fermentation could be either due to differ-ences in the surface composition, in particular carbohy-drates, which were not picked up by the XPS analysis, or to differences in the levels or profiles of the surface proteins. However, proteomic analysis indicated no dif-ferences in the protein profiles between all the fermen-tation samples, although quantitative analysis was not conducted; such work is planned for the future. In sum-mary, all the samples contained proteins that have been associated with the adhesion of various lactobacilli. Table 4 enlists the proteins identified on the bacterial cell surface, their target site and molecular mass, as
reported in previous studies. Among these, α-enolase,
elongation factor Tu (EF-Tu), glyceraldehyde-3-phosphate
dehydrogenase (GAPDH), and GroES chaperonin
stand out in terms of likely importance. More
specific-ally, α-enolase has been shown to be involved in the
adhesion of L. johnsonii and L. crispatus to extracellu-lar matrix components [40,41], EF-Tu in the adhesion of L. plantarum [42] and L. johnsonii [43] to intestinal cells, GroEL in the adhesion of probiotics and pathogens to the gastrointestinal mucosa [44], and GAPDH in the adhesion ofL. plantarumto Caco-2 cells [45]. It is inter-esting however to note that the association of enolase
and GAPDH with the cell wall of L. crispatus has been
shown to be pH dependent, with the strongest associ-ation being at pH 5 [46]. In accordance with this, the high levels of adhesion observed for the grown at pH 5, could be attributed to the stronger association of these
two proteins with the cell wall of L. rhamnosus GG,
although this is a hypothesis that needs to be investi-gated further.
A pili containing human mucus binding protein has
been identified inL. rhamnosusGG, which could explain
how this strain may persist in the host and compete with pathogens for residence sites in the human intestinal tract [47]. The study reported that the pili were required for the adhesion of the bacteria to the host and sug-gested a possible role of pili in other probiotic effects as well. Another study from the same group reported a number of pilin subunits in the same strain and showed that they play a role in the adhesion of bacteria to the in-testinal mucus [48]. In the present study the pili protein was detected, however not at significant levels, therefore it was not included in the analysis. A similar result was also reported in another study on the surface proteins of
L. rhamnosus GG [49]. The reasons for this are likely to be differences in the extraction process or the growth conditions.
Conclusions
The temperature and the pH of the fermentation influ-enced the surface composition, hydrophobicity and the levels of adhesion ofL. rhamnosusGG to Caco-2 cells. It was deduced from the data that a protein rich surface reduced the adhesion ability of the cells. The study showed that 37 C growth temperature and pH 6.5 are the best conditions of production of LGG cells with high adhesion ability. Use of suboptimal pH 5 stress also seemed to have a positive effect on bacterial adhesion. Therefore, manipulating the fermentation conditions to-wards the production of cells with carbohydrate rich sur-faces is likely to result to the production of more adhesive bacterial cells.
Additional files
Additional file 1:XPS spectrum of pH uncontrolled Fermentation.
Additional file 2:Figure S1. Principle Component Analysis.
Additional file 3:List of proteins detected on the surface of
L. rhamnosusGG.
Competing interests
The authors declare that they have no competing interests.
Authors’contributions
GD carried out the experimental work and drafted the manuscript, EK helped in carrying out the proteomic work, CB kindly gave advice on the surface analysis and provided the facilities for proteomic, XPS and FTIR work, CRH performed the XPS work and DC provided the overall guidance and supervision of the project.
Acknowledgements
Author details
1
Food and Nutritional Sciences, University of Reading, PO Box 226, Reading, UKRG6 6AP.2CheLSI Institute, Chemical and Biological Engineering, University of Sheffield, Sheffield, UK.3Sheffield Surface Analysis Centre, Kroto Research Institute, University of Sheffield, Sheffield, UK.
Received: 18 November 2011 Accepted: 7 August 2012 Published: 29 August 2012
References
1. Alander M, Satokari R, Korpela R, Saxelin M, Vilpponen-Salmela T, Mattila-Sandholm T, von Wright A:Persistence of colonization of human colonic mucosa by a probiotic strain,Lactobacillus rhamnosusGG, after oral consumption.Appl Environ Microbiol1999,65:351–354.
2. Tuomola EM, Salminen SJ:Adhesion of some probiotic and dairyLactobacillus strains to Caco-2 cell cultures.Int J Food Microbiol1998,41:45–51.
3. Ouwehand AC, Kirjavainen PV, Gronlund MM, Isolauri E, Salminen SJ: Adhesion of probiotic micro-organisms to intestinal mucus.Int Dairy J
1999,9:623–630.
4. De Leeuw E, Li XQ, Lu WY:Binding characteristics of theLactobacillus brevisATCC 8287 surface layer to extracellular matrix proteins.FEMS Microbiol Lett2006,260:210–215.
5. Jacobsen CN, Nielsen VR, Hayford AE, Moller PL, Michaelsen KF, Paerregaard A, Sandstrom B, Tvede M, Jakobsen M:Screening of probiotic activities of forty-seven strains ofLactobacillusspp. by in vitro techniques and evaluation of the colonization ability of five selected strains in humans.
Appl Environ Microbiol1999,65:4949–4956.
6. Dunne C, O'Mahony L, Murphy L, Thornton G, Morrissey D, O'Halloran S, Feeney M, Flynn S, Fitzgerald G, Daly C, Kiely B, O'Sullivan GC, Shanahan F, Collins JK:In vitro selection criteria for probiotic bacteria of human origin: correlation with in vivo findings.Am J Clin Nutr2001,73:386S–392S. 7. Schar-Zammaretti P, Dillmann ML, D'Amico N, Affolter M, Ubbink J:
Influence of fermentation medium composition on physicochemical surface properties ofLactobacillus acidophilus.Appl Environ Microbiol2005, 71:8165–8173.
8. Deepika G, Charalampopoulos D:Surface and adhesion properties of lactobacilli.Adv Appl Microbiol2010,70:127–152.
9. Ampatzoglou A, Schurr B, Deepika G, Baipong S, Charalampopoulos D: Influence of fermentation on the acid tolerance and freeze drying survival ofLactobacillus rhamnosusGG.Biochem Eng J2010,52:65–70. 10. Siaterlis A, Deepika G, Charalampopoulos D:Effect of culture medium and
cryoprotectants on the growth and survival of probiotic lactobacilli during freeze drying.Lett Appl Microbiol2009,48:295–301. 11. Palmfeldt J, Hahn-Haġerdal B:Influence of culture pH on survival of
Lactobacillus reuterisubjected to freeze-drying.Int J Food Microbiol2000, 55:235–238.
12. Wang Y, Corrieu G, Béal C:Fermentation pH and temperature influence the cryotolerance ofLactobacillus acidophilusRD758.J Dairy Sci2005, 88:21–29.
13. Carvalho AS, Silva J, Ho P, Teixeira P, Malcata FX, Gibbs P:Relevant factors for the preparation of freeze dried lactic acid bacteria.Int Dairy J2004, 14:835–847.
14. Deepika G, Green RJ, Frazier RA, Charalampopoulos D:Effect of growth time on the surface and adhesion properties ofLactobacillus rhamnosus GG.J Appl Microbiol2009,107:1230–1240.
15. Ojeda JJ, Romero-Gonzalez ME, Bachmann RT, Edyvean RGJ, Banwart SA: Characterization of the cell surface and cell wall chemistry of drinking water bacteria by combining XPS, FTIR spectroscopy, modeling, and potentiometric titrations.Langmuir2008,24:4032–4040.
16. Izquierdo E, Horvatovich P, Marchioni E, Aoude-Werner D, Sanz Y, Ennahar S: 2-DE and MS analysis of key proteins in the adhesion ofLactobacillus plantarum, a first step toward early selection of probiotics based on bacterial biomarkers.Electrophoresis2009,30:949–956.
17. Laemmli UK:Cleavage of structural proteins during the assembly of the head of bacteriophage T4.Nature1970,227:680–685.
18. Gan CS, Reardon KF, Wright PC:Comparison of protein and peptide prefractionation methods for the shotgun proteomic analysis of Synechocystissp PCC 6803.Proteomics2005,5:2468–2478.
19. Perkins DN, Pappin DJC, Creasy DM, Cottrell JS:Probability-based protein identification by searching sequence databases using mass spectrometry data.Electrophoresis1999,20:3551–3567.
20. Eboigbodin KE, Biggs CA:Characterization of the extracellular polymeric substances produced byEscherichia coliusing infrared spectroscopic, proteomic, and aggregation studies.Biomacromolecules
2008,9:686–695.
21. van der Mei HC, van de Belt-Gritter B, Pouwels PH, Martinez B, Busscher HJ: Cell surface hydrophobicity is conveyed by S-layer proteins-a study in recombinant lactobacilli.Colloids Surface B2003,28:127–134.
22. Pradier CM, Rubio C, Poleunis C, Bertrand P, Marcus P, Compere C:Surface characterization of three marine bacterial strains by Fourier transform IR, X-ray photoelectron spectroscopy, and time-of-flight secondary-ion mass spectrometry, correlation with adhesion on stainless steel surfaces.J Physical Chem B2005,109:9540–9549.
23. Kelly P, Maguire PB, Bennett M, Fitzgerald DJ, Edwards RJ, Thiede B, Treumann A, Collins JK, O'Sullivan GC, Shanahan F, Dunne C:Correlation of probioticLactobacillus salivariusgrowth phase with its cell wall-associated proteome.FEMS Microbiol Lett2005,252:153–159. 24. Santivarangkna C, Wenning M, Foerst P, Kulozik U:Damage of cell
envelope ofLactobacillus helveticusduring vacuum drying.J Appl Microbiol2007,102:748–756.
25. Zarate G, Nader-Macias ME:Viability and biological properties of probiotic vaginal lactobacilli after lyophilization and refrigerated storage into gelatin capsules.Process Biochem2006,41:1779–1785.
26. Rault A, Bouix M, Beal C:Fermentation pH influences the physiological-state dynamics ofLactobacillus bulgaricusCFL1 during pH-controlled culture.Appl Environ Microbiol2009,75:4374–4381.
27. Palmfeldt J, Hahn-Hagerdal B:Influence of culture pH on survival of Lactobacillus reuterisubjected to freeze-drying.Int J Food Microbiol2000, 55:235–238.
28. Saarela MH, Alakomi HL, Puhakka A, Matto J:Effect of the fermentation pH on the storage stability ofLactobacillus rhamnosuspreparations and suitability of in vitro analyses of cell physiological functions to predict it.
J Appl Microbiol2009,106:1204–1212.
29. Delgado S, O'Sullivan E, Fitzgerald G, Mayo B:Subtractive screening for probiotic properties ofLactobacillusspecies from the human
gastrointestinal tract in the search for new probiotics.J Food Sci2007,72: M310–M315.
30. Gopal PK, Prasad J, Smart J, Gill HS:In vitro adherence properties of Lactobacillus rhamnosusDR20 andBifidobacterium lactisDR10 strains and their antagonistic activity against an enterotoxigenicEscherichia coli.Intl J Food Microbiol2001,67:207–216.
31. Valeur N, Engel P, Carbajal N, Connolly E, Ladefoged K:Colonization and immunomodulation byLactobacillus reuteriATCC 55730 in the human gastrointestinal tract.Appl Environ Microbiol2004,70: 1176–1181.
32. Jacobsen CN, Rosenfeldt Nielsen V, Hayford AE, Møller PL, Michaelsen KF KF, Pærregaard A, Sandström B, Tvede M, Jakobsen M:Screening of Probiotic activities of forty-seven strains ofLactobacillus spp. by in vitro techniques and evaluation of the colonization ability of five selected strains in humans.Am J Clin Nutr2001,73:386–392.
33. Dunne C, O’Mahony L, Murphy L, Thornton G, Morrisey D, O’Halloran S, Feeney M, Flynn S, Fitzgerald G, Daly C, Kiely B, O'Sullivan GC, Shanahan F, Collins JK:In vitro selection criteria for probiotic bacteria of human origin: correlation with in vivo findings.Am J Clin Nutr2001,73:386–392. 34. Wang B, Li JS, Li QR, Zhang HY, Li N:Isolation of adhesive strains and
evaluation of the colonization and immune response byLactobacillus plantarumL2 in the rat gastrointestinal tract.Int J Food Microbiol2009, 132:59–66.
35. Schillinger U, Guigas C, Holzapfel WH:In vitro adherence and other properties of lactobacilli used in probiotic yoghurt-like products.Int Dairy J2005,15:1289–1297.
36. Tuomola EM, Salminen SJ:Adhesion of some probiotic and dairyLactobacillus strains to Caco-2 cell cultures.Int J Food Microbiol1998,41:45–51.
37. Hilgendorf C, Spahn-Langguth H, Regardh CG, Lipka E, Amidon GL, Langguth P:Caco-2 versus Caco-2/HT29-MTX co-cultured cell lines: Permeabilities via diffusion, inside- and outside-directed carrier-mediated transport.J Pharm Sci2000,89:63–75.
38. Boonaert CJP, Rouxhet PG:Surface of lactic acid bacteria: Relationships between chemical composition and physicochemical properties.Appl Environ Microbiol2000,66:2548–2554.
paracaseisubspparacasei, andLactobacillus rhamnosusstrains.Appl Environ Microbiol1997,63:1725–1731.
40. Castaldo C, Vastano V, Siciliano RA, Candela M, Vici M, Muscariello L, Marasco R, Sacco M:Surface displaced alfa-enolase ofLactobacillus plantarumis a fibronectin binding protein.Microb Cell Fact2009,8:14.
41. Granato D, Perotti F, Masserey I, Rouvet M, Golliard M, Servin A, Brassart D: Cell surface-associated lipoteichoic acid acts as an adhesion factor for attachment ofLactobacillus johnsoniiLa1 to human enterocyte-like Caco-2 cells.Appl Environ Microbiol1999,65:1071–1077.
42. Ramiah K, van Reenen CA, Dicks LMT:Surface-bound proteins of Lactobacillus plantarum423 that contribute to adhesion of Caco-2 cells and their role in competitive exclusion and displacement ofClostridium sporogenesandEnterococcus faecalis.Res Microbiol2008,159:470–475. 43. Granato D, Perotti F, Masserey I, Rouvet M, Golliard M, Servin A, Brassart D:
Cell surface-associated lipoteichoic acid acts as an adhesion factor for attachment ofLactobacillus johnsoniiLa1 to human enterocyte-like Caco-2 cells.App Environ Microbiol1999,65:1071–1077.
44. Velez MP, Hermans K, Verhoeven TLA, Lebeer SE, Vanderleyden J, De Keersmaecker SCJ:Identification and characterization of starter lactic acid bacteria and probiotics from Columbian dairy products.J Appl Microbiol
2007,103:666–674.
45. Kinoshita H, Uchida H, Kawai Y, Kawasaki T, Wakahara N, Matsuo H, Watanabe M, Kitazawa H, Ohnuma S, Miura K, Horii A, Saito T:Cell surface Lactobacillus plantarumLA 318 glyceraldehyde-3-phosphate dehydrogenase (GAPDH) adheres to human colonic mucin.J Appl Microbiol2008,104:1667–1674.
46. Antikainen J, Anton L, Sillanpaa J, Korhonen TK:Domains in the S-layer protein CbsA ofLactobacillus crispatusinvolved in adherence to collagens, laminin and lipoteichoic acids and in self-assembly.Mol Microbiol2002,46:381–394.
47. Kankainen M, Paulin L, Tynkkynen S, von Ossowski I, Reunanen J, Partanen P, Satokari R, Vesterlund S, Hendrickx APAH, Lebeer S, De Keersmaecker SCJ, Vanderleyden J, Hämäläinen T, Laukkanen S, Salovuori N, Ritari J, Alatalo E, Korpela R, Mattila-Sandholm T, Lassig A, Hatakka K, Kinnunen KT, Karjalainen H, Saxelin M, Laakso K, Surakka A, Palva A, Auvinen TSP, de Vos WM: Comparative genomic analysis ofLactobacillus rhamnosusGG reveals pili containing a human-mucus binding protein.Proc Natl Acad Sci USA2009, 106:17193–17198.
48. von Ossowski I, Reunanen J, Satokari R, Vesterlund S, Kankainen M, Huhtinen H, Tynkkynen S, Salminen S, de Vos WM, Palva A:Mucosal adhesion properties of the probioticLactobacillus rhamnosusGG SpaCBA and SpaFED pilin subunits.App Environ Microbiol2010,76:2049–2057. 49. Sanchez B, Bressollier P, Chaignepain S, Schmitter JM, Urdaci MC:
Identification of surface-associated proteins in the probiotic bacterium Lactobacillus rhamnosusGG.Int Dairy J2009,19:85–88.
50. Nandakumar R, Nandakumar MP, Marten MR, Ross JM:Proteome analysis of membrane and cell wall associated proteins fromStaphylococcus aureus.
J Prot Res2005,4:250–257.
51. Severin A, Nickbarg E, Wooters J, Quazi SA, Matsuka YV, Murphy E, Moutsatsos IK, Zagursky RJ, Olmsted SB:Proteomic analysis and identification ofStreptococcus pyogenessurface associated proteins.J Bacteriol2007,189:1514–1522.
52. Velez MP, De Keersmaecker SCJ, Vanderleyden J:Adherence factors of Lactobacillusin the human gastrointestinal tract.FEMS Microbiol Lett2007, 276:140–148.
53. Koskenniemi K, Koponen J, Kankainen M, Savijoki K, Tynkkynen S, de Vos WM, Kalkkinen N, Varmanen P:Proteome analysis ofLactobacillus rhamnosusGG using 2-D DIGE and mass spectrometry shows differential protein production in laboratory and industrial-type growth media.J Prot Res2009,8:4993–5007.
54. Castaldo C, Vastano V, Siciliano RA, Candela M, Vici M, Muscariello L, Marasco M, Sacco M:Surface displaced alfa-enolase ofLactobacillus plantarumis a fibronectin binding protein.Microb Cell Fact2009, 8:14.
doi:10.1186/1475-2859-11-116
Cite this article as:Deepikaet al.:Influence of fermentation conditions on the surface properties and adhesion ofLactobacillus rhamnosusGG. Microbial Cell Factories201211:116.
Submit your next manuscript to BioMed Central and take full advantage of:
• Convenient online submission
• Thorough peer review
• No space constraints or color figure charges
• Immediate publication on acceptance
• Inclusion in PubMed, CAS, Scopus and Google Scholar
• Research which is freely available for redistribution