Int. J. Electrochem. Sci., 9 (2014) 5377 - 5388
International Journal of
ELECTROCHEMICAL
SCIENCE
www.electrochemsci.org
Effect of Structure Texture and Morphology Modulation on
Efficiency of Dye sensitized Solar Cells
Nitin A. Jadhav1, Pramod K Singh1, Hee-Woo Rhee2,*, S. P. Pandey3 and B. Bhattacharya1
1
Materials Research Laboratory, School of Basic Sciences and Research, Sharda University, Greater Noida-201310, India
2
Department of Chemical & Biomolecular Engineering, Sogang University, Seoul-, S.Korea 3
Department of Physics, IIMT College of Engineering, Greater Noida- 201310, India. E-mail: [email protected]
Received: 19 April 2014 / Accepted: 13 June 2014 / Published: 16 July 2014
Wide band gap semiconductors like TiO2, ZnO are used as working electrode for dye-sensitized solar cell (DSSC), in present study highly ordered nanoporous TiO2 materials with crystalline frameworks was successfully synthesized from different concentration of triblock co-polymer (soft templates) like F-127 F-68. Synthesized mesoporous TiO2 have variation of pore size ranging from 2-5 nm and having high specific surface area from 216 m2/g -352 m2/g. A photoelectrode fabricated using synthesized mesoporous TiO2 shows increase in photocurrent density (Jsc) with increase in pore size as well as surface area and change in Voc with variation in structure texture and morphology of photoelectrode. The DSSC was fabricated using N3 dye as sensitizer and solid polymer electrolyte with KI/I2 as redox electrolyte. Synthesized samples were characterized by XRD, TEM, and Brunauer- Emmett-Teller (BET). Photovoltaic performance of DSSC overall conversion efficiency (%), fill factor (FF), open-circuit voltage (VOC) and short-open-circuit current density (JSC) from the J-V curves measured with 2400 Keithley Source meter, it was observed that the photoelectric performance is strongly dependent on combined effect of Voc and Jsc which shows the characteristric change with structure texture morphology as well as pore size and specific surface area of fabricated electrode.
Keywords: Nanoporous TiO2, Dye sensitized solar cell, J-V measurement, Open circuit voltage.
1. INTRODUCTION
Sensitized Solar Cell[5-6] Recently a vast amount of research is carried out on TiO2 as a material for lithium ion battery anodes[7] Though there are some limitations inherent to TiO2, researchers have begun to utilize TiO2 effectively in batteries. As some of the merits of using TiO2 are clear, e.g. its cost, low toxicity, and density, In many cases, these benefits can only be realized when modifications are made to the various polymorphs of TiO2.
TiO2 based dye-sensitized solar cells (DSSCs) offer one of the most promising alternatives to sustainable, clean, and renewable energy for transferring inexhaustible sunlight into electricity, as they possess advantages such as low cost and environmental friendliness, and they can, in principle, be produced on a large scale.[8] However, electron transport in disordered TiO2 nanoparticles with a random transit path enhances the possibility of charge recombination and thus reduces the photocurrent and the performance of the device.[9] Thus, designing a photo anode with a fast transport pathway from the photo injected carriers to the electrically conductive electrode would remarkably improve the performance of DSSCs.[10] To enhance electron transport and reduce recombination, several kinds of photoanode materials have been employed in the past decade, including doped TiO2,[11] metal/metal oxide−TiO2 hybrid, composite and core-shell structures,[12] porous TiO2 structures,[13] and TiO2-carbonmaterials.[14]. Since the discovery of DSSC major group of scientific community working on DSSC are using TiO2 as working electrode of DSSC. These days to increase efficiency of DSSC number of researchers are working on modification of all the components of DSSCs. Recently lot of efforts are also found on modification of working electrode of DSSC to improve short circuit current density (Jsc) as well as open circuit voltage (Voc) Recently, much attention has been devoted to prepare TiO2@ reduced graphene oxide for photoanode materials in DSSCs Various TiO2@reduced graphene oxide composites with tunable TiO2 nanostructures (e.g., nanoparticles, nanorods, nanofibers, and nanospheres)[15] doping of carbon, doping of large size crystals of rutile TiO2 with anatase TiO2. Scientist have concentrated to modify structure texture and morphology of these materials by synthesizing nanomaterials with nanoparticles,[16] nanowires (or nanorods),[17] nanotubes,[18] nanobelts,[19] nanosheets,[20] and nanotips.[21] structure by keeping in mind that for the efficient device applications nanomaterials having large specific surface area is the prime need of present scenario, In recent days it is found that nanomaterials with porous morphology is an additional important feature for device application. Very recently nanostructures with highly ordered porous network and having large specific surface area with optimum pore size have been developed like TiO2[22-23] ZnO[246-25] SiO2[26] SnO2[27] most crystalline TiO2 is most widely used photoelectrode for fabrication of DSSC
In continuation with this work, In the present article working electrodes of DSSC were fabricated using such modified mesoporous TiO2 through template concentration variation and also
calcinations temperature variation. The effect of such modifications were studied on Voc, Jsc and efficiencies of DSSC it is found that specific surface area and avourage pore size plays very important role in deciding the increase or decrease in DSSC parameter. Similar results also found in literature on hexagonal rod like structure of TiO2 synthesized by using other mesoporous materials like mesoporous silica or zeolite as structure directiong agent[28]. But no report found on mesoporous TiO2Also surface area we reported is very high ranging from 216m2/g-352m2/g but other reports show upto 258m2/g[28] this is further elaborated in later discussion.
2. EXPERIMENTAL SECTION 2.1 Materials
Titanium tetrabutoxide ((Ti(0C4H9)4), 97.0%, Aldrich), Pluronic F-68 and Pluronic F-127 (extra pure, Sigma Aldrich), ethyl alcohol, ((C2H5OH), 94.0%, Samchun Chemicals) and HCl (35.0-37.0%, Samchun Chemicals) were used as received without further purification.
2.2 Synthesis
The synthesis of mesoporous TiO2 were carried through triblock copolymer-templated sol-gel method via an evaporation-induced self-assembly (EISA) process. For preparing Ti-sol, 2.7 ml (0.38M) of titanium tetrabutoxide was dissolved and stabilized in 2.9 ml of 35% HCl solution, under vigorous magnetic stirring for 3 h. Ethanol solutions either of Pluronic F-68 or of Pluronic F-127 were prepared by adding different amounts of either of the copolymers in 15.2 ml of ethanol (94%) under vigorous magnetic stirring for 3 h. The amounts of the Pluronics were varied to vary their concentrations in the final mixture solution as 0.001 M, 0.0025 M, 0.005 M, and 0.01 M. The previously prepared yellowish Ti-sol was then added to the Pluronic solutions dropwise under magnetic stirring. The stirring process was continued for 12 h until the mixture become colorless and transparent. The resulting mixtures aged for humidity at room Temperature for 6-7 days white coloured paste were formed. The resulting mixtures were aged for humidity at room temperature white colored paste were formed which was used to fabricate working electrode of DSSC
2.3 Fabrication of DSSC
blend in acetonitrile and adding NaI and I2 with w/w % as 75:25 and 10 w/w % of iodine with NaI dissolved in acetonitrile with 24 h stirring. Also platinum counter electrode was prepared by spin coating of H2PtCl6 solution on clean FTO Glass a drop of above prepared electrolyte was sandwiched between fabricated working electrode and counter electrode.
The effect of calcinations temperature was studied by calcining the fabricated working electrodes F-127 (0.001 M) and F-68 (0.005 M) at 260 0C, 280 0C, 300 0C and 315 0C for 12 hrs using the same heating rate.
2.4 Characterizations
Surface area, pore volume, pore size distribution and pore diameter were measured by BET Quantachrome Autosorb AS1win instrument. To analyze pore size sample is outgased at 300 0C for 7 h. The dye sensitized solar cell (DSSC) parameters like open circuit voltage (Voc), short circuit current density (Jsc) and fill factor ( FF) and conversion efficiency (η) were measured by Keithley source meter model no. 4200.
3. RESULTS AND DISCUSSION
3.1 Dye Sensitized Solar Cells (Template Concentration Variation)
[image:4.596.117.482.408.696.2]
The synthesized TiO2 paste from different concentrations of both platonic’s was used to
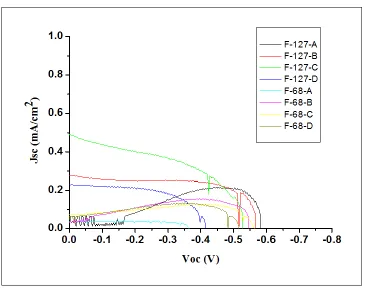
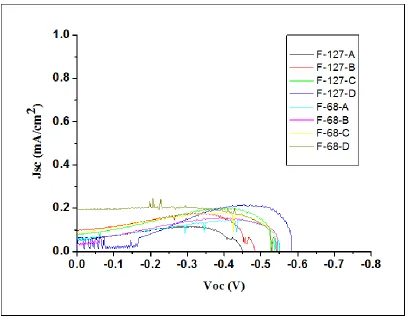
fabricate working electrode of DSSCs and calcinated at 315 0C for 12 h. The photo current density−voltage (J−V) characteristics of the DSSCs fabricated with the different morphologies of TiO2
[image:5.596.31.567.225.442.2]photoanodes are measured by using keithley 2400 sourcemeter and analysed under 1 sun condition which are shown in Figure1. And all the parameters are summarized in following Table1.
Table 1. Comparison of Specific Surface area average pore size also DSSC parameters (Voc Jsc and Efficiencies) with variation of template concentration of both pluronics in TiO2 samples
Template Samples Specific Surface
area (m2/g)
Average Pore
size (nm)
Voc (V) Jsc (mA/cm2) Effeciency
(%)
F-127 0.001 M 216.2 3.15 0.582 2.183X10⁻¹ 0.107
0.0025 M 251 4.5 0.568 2.773X10⁻¹ 0.104
0.005 M 287.6 4.78 0.528 4.939X10⁻¹ 0.122
0.01M 348.4 4.11 0.417 2.306X10⁻¹ 0.056
F-68 0.001 M 224.4 2.63 0.593 3.84 X10⁻² 0.0637
0.0025 M 259.5 2.93 0.579 1.566 X10⁻¹ 0.0665
0.005 M 315.3 4.12 0.545 3.453 X10⁻¹ 0.0874
[image:5.596.55.544.468.686.2]0.01M 352.5 3.57 0.516 1.350 X10⁻¹ 0.0519
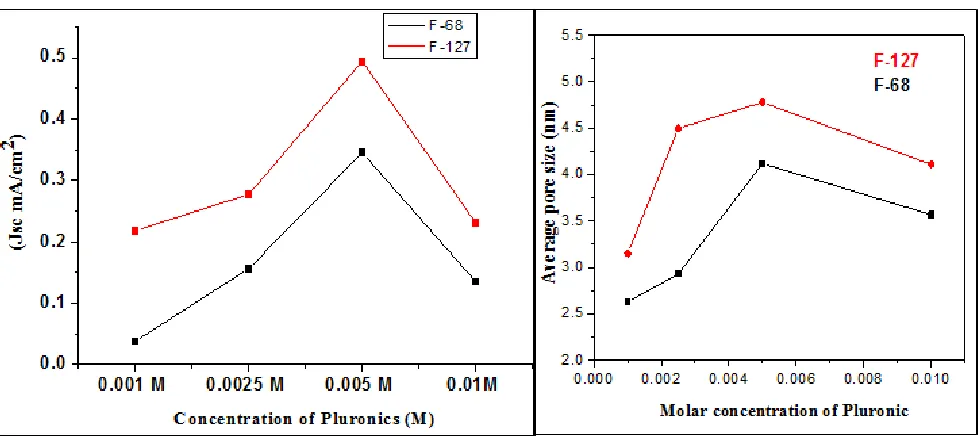
Jsc obtained from different cells of Mesoporous TiO2 are plotted against sample synthesized with
[image:6.596.55.544.423.641.2]different concentration of both pluronics as shown in figure.2a, and it is observed that the obtained Jsc values follows the same trends which is followed by pore size (refer pore size plot in figure 2b the explanation for variation of pore size is already discussed in article 23) also it is observed that the sample synthesized using F-68 template have smaller pore size compared with sample synthesized using template F-127 (due to smaller chain length of template) the value of short circuit current also small i.e the cells fabricated using photo-electrode with higher pore size value of Jsc is high and at lower pore size value of Jsc is low as pore size increase the Jsc value also increases and as pore size decrease Jsc also decrease This is due to radius of gyration of Polymers used in electrolyte. As we know it is very important that there should be direct contact or penetration of electrolyte inside pore to increase the exchange of electron and to increase the Jsc. as pore size increase there are lot of chances of polymer chain to penetrate inside the pores of electrode and exchange of electrons with dye molecule adsorbed on surface of electrode as well as the dye molecule inside pore get reduced through polymer electrolyte and hence photocurrent get increased, as pore size decreases it is difficult for polymer chain to penetrate inside pore and make exchange of electrons with dye molecule adsorbed in side pores resulting photocurrent may decreased. Similar reports on hexagonal rod likeTiO2 structure formation is there but author have not commented on variation of Voc and Jsc compared with respect to pore size and surface area[28]. Author only discussed on increase or decrease in overall efficiency with thickness of electrode.
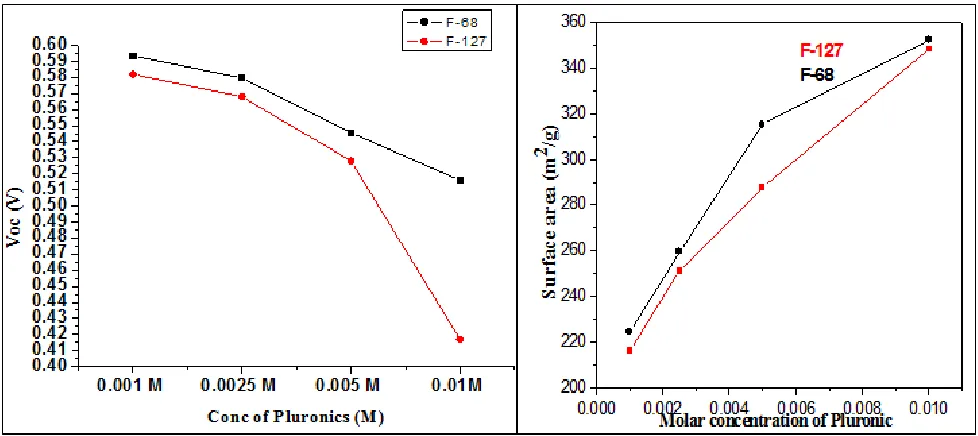
Figure 3 a). Variation of Open circuit voltage (Voc) versus the molar concentration of pluronics 3b) Variation of specific surface area versus molar concentration of pluronics
figure3a. Shows variation of open circuit voltage (Voc) versus the mesoporous TiO2 samples
surface area increases Voc decreases and as surface area decrease Voc increases (refer surface are plot in figure 3b the explanation for variation of specific surface area is already discussed in article 23) as we know that Voc is resultant product of interface between electrolyte and working electrode so in this case as surface area increases that is number of pores present on TiO2 surface increases and direct
contact of TiO2 surface to electrolyte decreases due to the pores present on TiO2 surface as a result
extend of formation of interface between electrode-electrolyte decreases and ultimately Voc also decreases but at lower surface area number of pore formed on surface of TiO2 are less and hence more
surface of TiO2 is exposed to direct contact of electrolyte which results in good extend of formation of
electrode electrolyte interface and ultimately Voc increases .
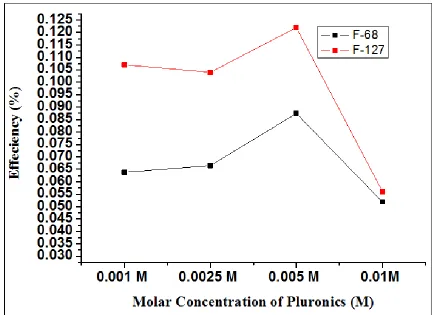
As we know that the photocurrent conversion efficiency in DSSC is the resultant product of Voc and Jsc so overall increase and decrease in conversion efficiency for all samples mesoporous TiO2
[image:7.596.81.516.302.617.2]are due to increase or decrease in Voc as well as Jsc which are presented in following figure.4
Figure 4. Variation of photocurrent conversion efficiency versus molar concentration of pluronics
3.2. Dye Sensitized Solar Cells (DSSC’s) (Calcinations Temperature Variation)
The synthesized TiO2 paste from both platonic’s was used to fabricate working electrode of
fabricated with the different morphologies of TiO2 photoanodes were measured with keithley 2400
sourcemeter and measured under one sun condition.
Figure 5. J-V curve for the mesoporous TiO2 sample synthesized using F-68 and F-127 triblock co-polymer as template and calcinated at a) 260 0C b) 280 0C, c) 300 0C and d) 315 0C for 12 h.
[image:8.596.96.506.131.450.2]Which are shown in Figure5 and all the parameters are summarized in following Table2.
Table 2 Comparison of Specific Surface area also DSSC parameters (Voc Jsc and Efficiencies) with variation calcinations temperature for both pluronics in TiO2 samples
Template Samples Specific Surface
area (m2/g)
Average Pore size (nm)
Voc (V) Jsc (mA/cm2) Effeciency
(%)
F-127 260 0C 151.8 1.03 0.452 0.0117 0.039
280 0C 155.3 2.29 0.484 0.018 0.064
300 0C 188.7 2.80 0.537 0.0203 0.087
315 0C 216.2 3.15 0.582 0.0218 0.107
F-68 260 0C 287.6 1.66 0.527 0.0144 0.066
280 0C 293.1 2.31 0.542 0.0177 0.075
300 0C 296.5 3.04 0.556 0.0245 0.086
[image:8.596.43.563.596.746.2]
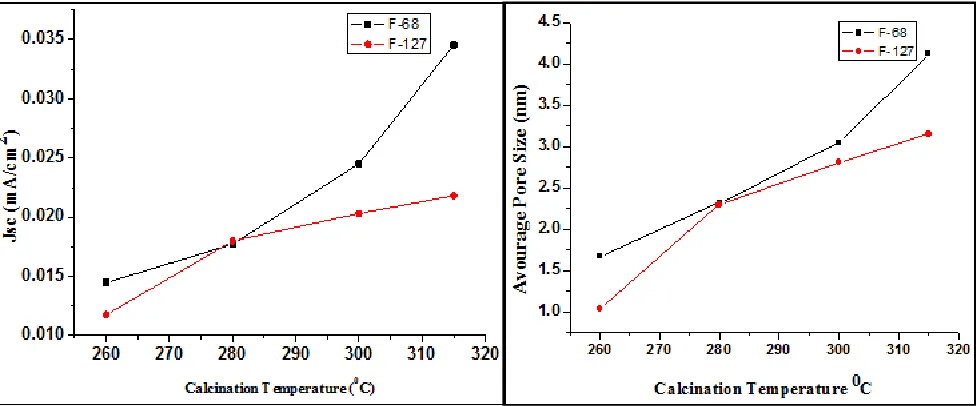
Figure 6. a) Variation of Short circuit current density (Jsc) b) variation of average pore size versus the the calcination temperature of mesoporous TiO2 synthesized using both pluronics
Jsc obtained from different cells of Mesoporous TiO2 synthesized using both co-polymers and
calcinated at different calcinations temperature are presented in figure 6a. From figure it is observed that the variation of Jsc with calcinations temperature follow same trend as like variation of average pore size with calcinations temperature (refer pore size plot in figure 6b the explanation for variation of pore size is already discussed in article 23). At lower calcinations temperature short circuit current density (Jsc) is also low, as calcinations temperature increases Jsc values also increases. As we know that the most ordered porous structures are formed on calcinating the samples at 315 0C. In the samples calcinated at lower temperature, a good fraction of the pores remained blocked with the carbon produces through the thermal dissociation of the copolymer template, which results in decrease in their specific surface area and average pore size which have been supported from their nitrogen adsorption/desorption result presented in figure 6b that is at lower calcinations temperature the carbon residue remains inside the pores and pores remain blocked however as calcinations temperature increases the pores get opened, when calcinations temperature increases more number of pores get open and hence pore size increases. when pore size increase the Jsc value also increases and as pore size decrease Jsc also decrease This is due to radius of gyration of Polymers used in electrolyte as pore size increase there are lot of chances of polymer chain to penetrate inside the pores of electrode and exchange of electrons with dye molecule adsorbed on surface of electrode as well as the dye molecule inside pore get reduced through polymer electrolyte and hence photocurrent get increased, as pore size decreases it is difficult for polymer chain to penetrate inside pore and make exchange of electrons with dye molecule adsorbed in side pores resulting photocurrent may decreased.
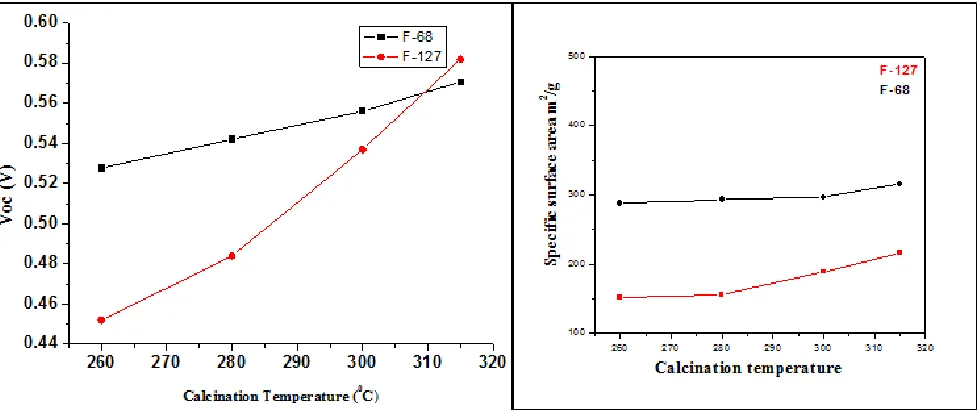
Figure 7 a). Variation of Open circuit voltage (Voc) b) variation of specific surface area versus the the calcination temperature of mesoporous TiO2 synthesized using both pluronics
Figure 7a. Shows Variation of Open circuit voltage (Voc) versus the mesoporous TiO2 samples
synthesized using different calcinations temperature for both Pluronics. from this plot it is observed that the Voc increase as calcinations temperature increases.
Which follows same trend as variation of specific surface area versus calcinations temperature (refer specific surface area plot in figure 7b the explanation for variation of specific surface area is already discussed in article 23) Voc is the resultant product of interface between electrolyte and working electrode i.e TiO2 (wide band gap semiconductor). When extend of interface between working
electrode and electrolyte increases, Voc also increases and as extend of interface decreases Voc decreases. As calcinations temperature increases more and more pores get open and carbon residue formed during decomposition of template inside pores get removed. Which results more surface of TiO2 is exposed to direct contact with electrolyte and hence good extend of formation of electrode
electrolyte interface takes place and ultimately Voc get increased at higher calcinations temperature. The photocurrent conversion efficiency in DSSC is the resultant product of Voc and Jsc so extend of increase and decrease of Voc as well as Jsc reflects in increase or decrease in overall conversion efficiency. For all samples of mesoporous TiO2 variation in photocurrent conversion
efficiency are due to increase or decrease in Voc as well as Jsc which are presented in following figure8.
4. CONCLUSIONS
We have introduced synthesis strategy of mesoporous TiO2 powder in bulk amount through triblock copolymer-templated sol-gel method via an evaporation-induced self-assembly (EISA) process. As we know powdered photocatalyst are efficient in its catalytic activity due to its simplicity. As surface area and pore size both of these factors play an important role in efficiency of photocatalysis. In the present work we have modified the working electrode of DSSC. We have modified the structure texture and morphologyof mesoporous TiO2. We have successfully synthesized
mesoporous TiO2 with highest specific surface area and variation of pore size Also we have studied the
effect of increase or decrease in pore size on short circuit current of DSSC and effect of increase or decrease in specific surface area on open circuit voltage of DSSC.
Also simultaneously we have introduced shortly the thermal stability of pore wall and effect of calcination temperature on average pore size, specific surface area and orderness of mesoporous structure. Working electrodes of DSSC were fabricated using such modified mesoporous TiO2 and
effect of such modifications were studied on Voc, Jsc and efficiencies of DSSC These findings will helps us as well as scientific committee to work further more on such types of porous materials
ACKNOWLEDGEMENT
References
1. M. Kadoshima, M. Hiratani, Y. Shimamoto, K. Torii, H. Miki, S. Kimura, T. Nabatame, Thin Soild Films 424 (2003) 224−228.
2. T. Tachikawa, M. Fujitsuka, T. Majima, J. Phys. Chem. C 111(2007) 5259−5275. 3. S. Chappel, S. Chen, A. Zaban, Langmuir. 18, (2002) 3336-3342.
4. H. F. Lu; F. Li; G. Liu; Zhi-Gang Chen; Da-Wei Wang; Hai-Tao Fang; G. Q. Lu; Z. H. Jiang; and Hui-Ming Cheng; Nanotechnology. 19 (2008) 405504-405510.
5. A. Hagfeldt, G. Boschloo, L. Sun, L. Kloo, H. Pettersson, Chem. Rev. 110 (2010) 6595−6663 6. H. S. Jung, J-K. Lee, J. Phys. Chem. Lett. 4 (2013) 1682−1693.
7. T. Fr schl, U. rmann, P. Kubiak, G. Ku erov , M. Pfanzelt, C. K. Weiss, R. J. Behm, N. sing, U. Kaiser, K. Landfester, M. Wohlfahrt-Mehrens, Chem. Soc. Rev. 41 (2012) 5313−5360.
8. B. O’Regan, M. r t el, Nature 353 (1991) 737−740.
9. J. van de Lagemaat, K. D. Benkstein, A. J. Frank, J. Phys. Chem. B 105 (2001) 12433−12436. 10.A. Kongkanand, R. Martíne Domíngue , P. V. Kamat, Nano Lett. 7 (2007) 676−680.
11.H. Tian, L. Hu, C. Zhang, L. Mo, W. Li, J. Sheng, S. Dai, J. Mater. Chem. 22 (2012) 9123−9130. 12.J. Du, J. Qi, D. Wang, Z. Tang, Energy Environ. Sci. 5 (2012) 6914−6918.
13.J. Yan, F. Zhou, J. Mater. Chem. 21 (2011) 9406−9418.
14.S. Muduli, W. Lee, V. Dhas, S. Mujawar, M. Dubey, K. Vijayamohanan, S-H. Han, S. Ogale, ACS Appl. Mater. Interfaces 1, (2009) 2030−2035.
15.Gang Cheng, M. Shaheer Akhtar, O-Bong Yang, and Florian J. Stadler, ACS Appl. Mater. Interfaces, 5 (2013) 6635−6642
16.E. A. Meulenkamp, J. Phys. Chem. B 102 (1998) 5566.
17.S. Kar, A. Dev, S. Chaudhuri, J. Phys. Chem. B. 110 (2006) 17848.
18.Q. C. Li, V. Kumar, Y. Li, H. T. Zhang, T. J. Marks, R. P. H. Chang, Chem. Mater. 17 (2005) 1001. 19.X. D. Wang, Y. Ding, C. J. Summers, Z. L. Wang, J. Phys. Chem. B. 108 (2004) 8773.
20.M. Fu, J. Zhou, Q. F. Xiao, B. Li, R. L. Zong, W. Chen, J. Zhang, Adv. Mater. 18 (2006) 1001. 21.U. Pal, J. G. Serrano, P. Santiago, G. Xiong, K. B. Ucer, R. T. Williams, Opt. Mater. 29 (2006) 65. 22.Z. L. Wang, J. Phys. Condens. Matter 16 (2004) R829
23.Nitin A. Jadhav, Chang Woo Kim, Umapada Pal, Jinheung Kim, and Young Soo Kang, Journal of Nanoscience and Nanotechnology, 12, (2012) 5638–5643
24.On, D. T. Langmuir 15 (1999) 8561
25.Umapada Pal, Chang Woo Kim, Nitin A Jadhav, and Young Soo Kang; J. Phys. Chem. C113 (2009) 14676–14680
26.S. Bhattacharyya, A. Gedanken, J. Phys. Chem. C, 112, (2008) 659.
27.J. Ba, J. Polleux, M. Antonietti, M. Niederberger, AdV. Mater,17.(2005) 2509.
28.Kyung-Jun Hwang, Seung-Joon Yoo, Sung-Soo Kim, Ji-Man Kim, Wang-Geun Shim, Sun-Il Kim, and Jae-Wook Lee J. Nanosci. Nanotechnol Vol. 8, No. 10 (2008) 4976–4981