Pocket Rocket: An electrothermal
plasma micro-thruster
Amelia Diane Greig
A thesis submitted for the degree of
Doctor of Philosophy
of The Australian National University
Declaration
This thesis is an account of research undertaken between February 2012 and July
2015 at The Research School of Physics and Engineering, College of Physical and
Mathematical Sciences, The Australian National University, Canberra, Australia.
Except where acknowledged in the customary manner, the material presented in
this thesis is, to the best of my knowledge, original and has not been submitted in
whole or part for a degree in any university.
Amelia Diane Greig
To my parents,
for giving me the confidence to tackle any challenge
Acknowledgments
The past three and a half years have been some of the most amazing of my life to
date, due entirely to the wonderful guidance and friendship I have received from my
supervisors, Christine Charles and Rod Boswell. Christine, you are the best role
model possible for a young female researcher and I hope that I can take what you
have taught me on board and have a career even half as successful as yours. Rod,
our conversations are always entertaining and educational; you have taught me so
much, and not just about plasma physics but life in general. I also would like to
thank you both for patiently trying to teach me to surf, and introducing me to the
wonder that is canoeing down a river for days at a time. I have never before met
supervisors who are so open and welcoming to their students, and I will be eternally
grateful for everything you have done for me over these short years.
A large portion of this work would not have been possible without the assistance
of Rhys Hawkins, thanks to his contribution writing the rovibrational spectroscopy
fitting code. Best of luck finishing your own Ph.D. now Rhys! This work would also
not have been possible without the technical brilliance of Peter Alexander, Steven
Holgate, Dennis Gibson and the rest of the mechanical and electrical workshop staff,
and James, Martin and Julie in the School Computer Unit. Your efforts over the
years to keep equipment functioning, repair broken components, and help set up
new parts are greatly appreciated and it is safe to say this work could not have
happened without your help. Similarly, thank you to the wonderful admin staff at
RSPE, especially Karen N, Karen S, Luda, Uyen and Suzie. Your help with all my
student, finance and travel matters have made this experience much simpler.
This experience has been made significantly better by being part of the wonderful
group that is the Space Plasma, Power and Propulsion lab. Thank you to Andrew
viii
and Andy for creating such a great team dynamic and for always being there for
a chat. I would also like to thank Naomi Mathers from RSAA for your continual
guidance and suggestions for moving forwards after my Ph.D.
I am very lucky to have a wonderful group of friends from RSPE, the highland
dancing world and the ANU hockey club, to relax and take a break from work
with. A special thank you must go to Andrew Papworth; the philosophers drinking
club after hockey on Thursdays has been great fun and educational and I hope you
manage to keep the tradition alive.
A great part of my personal development and growth during the past few years
that has allowed me to complete my Ph.D. as a well-rounded individual with a broad
skill set encompassing more than research ability is due to Michael West and the
rest of the AIAA Sydney Section council. It was great to be involved with such
a proactive and interesting group of people working together to organise various
events to promote and advance the aerospace sciences within Australia.
Finally, I would like to thank my family for the love and support they have given
me my entire life. It is much easier to take on the challenges of life knowing you
have set me up with everything I need to succeed, but will also always be there if I
Publications
This thesis has resulted in a number of publications in peer reviewed journals, as
listed below. Some of the results presented in the chapters to follow have been
adapted from the material in these publications.
• A. Greig,C. Charles, R. Hawkins and R.W. Boswell,Direct measurement of neu-tral gas heating in a radio-frequency electrothermal plasma micro-thruster,Applied Physics Letters,103, 074101 (2013)
• A. Greig, C. Charles, N. Paulin and R.W. Boswell, Volume and surface propel-lant heating in an electrothermal radio-frequency plasma micro-thruster, Applied Physics Letters,105, 054102 (2014)
• A. Greig,C. Charles and R.W. Boswell,Plume Characteristics of an Electrothermal Plasma Microthruster,IEEE Trans. on Plasma Science, Vol 42, No 10, (2014)
• A. Greig,C. Charles and R.W. Boswell, Simulation of main plasma parameters of a cylindrical asymmetric capacitively coupled plasma micro-thruster using
computa-tional fluid dynamics,Frontiers in Plasma Physics,Vol 2, No 80, (2015)
• C. Charles, A. Bish, R.W. Boswell, J. Dedrick,A. Greig,R. Hawkins and T.S. Ho,
A short review of experimental and computational diagnostics for radiofrequency
plasma micro-thrusters, Plasma Chemistry and Plasma Processing, Online Sept 2015
Abstract
Recently, an increase in use of micro-satellites constructed from commercial off the
shelf (COTS) components has developed, to address the large costs associated with
designing, testing and launching satellites. One particular type of micro-satellite of
interest are CubeSats, which are modular 10 cm cubic satellites with total weight
less than 1.33 kg. To assist with orbit boosting and attitude control of CubeSats,
micro-propulsion systems are required, but are currently limited.
A potential electrothermal plasma micro-thruster for use with CubeSats or other
micro-satellites is under development at The Australian National University and
forms the basis for this work. The thruster, known as ‘Pocket Rocket’, utilises
neutral gas heating from ion-neutral collisions within a weakly ionised asymmetric
plasma discharge, increasing the exhaust thermal velocity of the propellant gas,
thereby producing higher thrust than if the propellant was emitted cold.
In this work, neutral gas temperature of the Pocket Rocket discharge is studied in
depth using rovibrational spectroscopy of the nitrogen (N2) second positive system
(C3Πu →B3Πg), using both pure N2 and argon/N2 mixtures as the operating gas.
Volume averaged steady state gas temperatures are measured for a range of operating
conditions, with an analytical collisional model developed to verify experimental
results. Results show that neutral gas heating is occurring with volume averaged
steady state temperatures reaching 430 K in N2 and 1060 K for argon with 1%
N2 at standard operating conditions of 1.5 Torr pressure and 10 W power input,
demonstrating proof of concept for the Pocket Rocket thruster. Spatiotemporal
profiles of gas temperature identify that the dominant heating mechanisms are
ion-neutral collisions within the discharge and wall heating from ion bombardment of
the thruster walls.
To complement the experimental results, computational fluid dynamics (CFD)
xii
results demonstrate that the discharge is driven by ion induced secondary or ‘gamma’
electrons emitted from the surface of the plasma cavity radial wall in the vicinity
of the powered electrode. These electrons are accelerated to high velocities through
an enhanced sheath formed by the asymmetry of the device, creating a peak in ion
Contents
Declaration ii
Acknowledgments vii
Publications ix
Abstract xi
1 Introduction 1
1.1 Micro-satellites . . . 1
1.2 Micro-propulsion . . . 2
1.2.1 Chemical Propulsion . . . 5
1.2.2 Electric Propulsion . . . 6
1.2.3 Electrothermal Thrusters . . . 7
1.3 Plasma . . . 8
1.3.1 Plasma Breakdown . . . 9
1.3.2 Plasma Sheaths . . . 10
1.3.3 Secondary Electrons . . . 12
1.3.4 Capacitively Coupled Plasmas . . . 12
1.3.5 Global Modelling . . . 14
1.3.6 Gas Discharge Collisional Processes . . . 15
1.4 Thesis Scope . . . 17
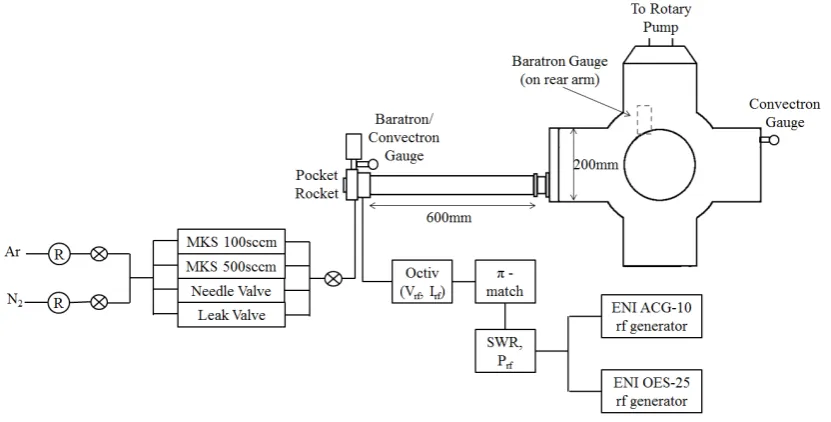
2 Apparatus and Diagnostics 19 2.1 The Pocket Rocket Device . . . 19
2.2 Power System and Matching Network . . . 21
xiv Contents
2.3.1 Pressure Gradient and Choked Flow Criterion . . . 25
3 Diagnostics 27 3.1 Langmuir Probe . . . 27
3.2 Optical Emission Spectroscopy . . . 29
3.3 Rovibrational Spectroscopy . . . 33
3.3.1 Neutral Gas Temperature Estimates . . . 33
3.3.2 Application to Atomic Species . . . 36
3.3.3 Experimental Setup . . . 37
3.3.4 Simulating Rovibrational Spectra . . . 38
3.3.5 Rovibrational Band Fitting . . . 43
3.4 Computational Fluid Dynamics . . . 45
3.4.1 Fluid Model . . . 46
3.4.2 Pocket Rocket Model . . . 50
4 Direct Measurement of Gas Temperature 55 4.1 Argon Metastable Influence . . . 56
4.1.1 Metastable Resonance Energy Transfer . . . 56
4.1.2 Experiment Parameters . . . 58
4.1.3 Experiment Results . . . 59
4.1.4 Analytic Model of Ion-Neutral Charge Exchange Collisions . . 61
4.1.5 Alternate Rovibrational Bands . . . 63
4.2 Neutral Gas Temperature Measurements . . . 64
4.2.1 Experiment Parameters . . . 65
4.2.2 Nitrogen Results . . . 65
4.2.3 Argon with 1% N2 Results . . . 67
4.2.4 Comparison with Analytic Model . . . 68
4.3 Thruster Performance Estimates . . . 70
4.4 Chapter Summary . . . 72
5 Spatiotemporal Study of Gas Heating Mechanisms 75 5.1 Theory of Gas Heating in a Plasma Discharge . . . 76
5.2 Temporal Evolution of Gas Temperature . . . 77
Contents xv
5.2.2 Temporal Results . . . 79
5.3 Spatiotemporal Gas Temperature . . . 84
5.3.1 Experiment Parameters . . . 85
5.3.2 Spatiotemporal Results . . . 87
5.4 Heating of the Thruster Housing . . . 90
5.4.1 Housing Material Optimisation . . . 95
5.5 Chapter Summary . . . 97
6 Pocket Rocket CFD Simulation 99 6.1 Parallel Plate CCP Test Case . . . 100
6.2 Pocket Rocket Simulation Parameters . . . 102
6.3 Pocket Rocket Simulation Results . . . 103
6.3.1 Secondary Electrons . . . 109
6.3.2 Neutral Gas Temperature . . . 112
6.4 Pressure Gradient Simulations . . . 119
6.4.1 Simulation Parameters . . . 119
6.4.2 Simulation Results . . . 120
6.5 Chapter Summary . . . 123
List of Figures
1.1 Example Paschen Curve . . . 10
1.2 Sheath Potentials and Densities . . . 11
1.3 Asymmetric Capacitively Coupled Plasma . . . 14
2.1 The Pocket Rocket Device . . . 20
2.2 Impedance Matching Network . . . 22
2.3 Paschen Curves for Pocket Rocket . . . 25
2.4 Complete Experimental Setup . . . 26
3.1 Langmuir Probe . . . 28
3.2 The Pocket Rocket Discharge . . . 31
3.3 Spectra of the Pocket Rocket Discharge . . . 32
3.4 Molecular Potential Energy Curve . . . 39
3.5 Example Rovibrational Band Fits . . . 44
3.6 Pocket Rocket CFD Simulation Model . . . 50
3.7 Mesh Convergence Study . . . 53
4.1 Reaction Rates for Excitation of N2 C3Πu State . . . 58
4.2 Argon-Nitrogen Mixture Gas Temperatures . . . 59
4.3 Nitrogen Gas Temperatures . . . 66
4.4 Argon with 1% N2 Gas Temperatures . . . 67
4.5 Theoretical Comparison of Gas Temperatures . . . 69
4.6 Radial Electron Density Profiles in Nitrogen . . . 70
5.1 Plenum Pressure During Pulsed Operation . . . 79
5.2 Temporal Evolution of Gas Temperature in N2 . . . 80
xviii Contents
5.4 Temporal Evolution of Gas Temperature in Argon with 10% N2 . . . 83
5.5 Spatiotemporal Regions of Interest . . . 86
5.6 Spatiotemporal Profile of Temperature . . . 88
5.7 Pocket Rocket Housing Dimensions . . . 91
5.8 Lumped Thermal Model Results . . . 93
5.9 Radial Housing Temperature Profile . . . 95
5.10 Discharge Tube Thermal Gradient . . . 96
6.1 CFD Test Case Geometry . . . 101
6.2 CFD Test Case Results . . . 102
6.3 Neutral Gas and Plasma Density . . . 104
6.4 Ion Saturation Current Comparison with Simulation Ion Density . . . 105
6.5 Phase Averaged Plasma Parameter Results . . . 106
6.6 Phase Resolved Potentials . . . 108
6.7 Phase Resolved Plasma Parameter Results . . . 109
6.8 Secondary Electron Emission Coefficient . . . 110
6.9 Phase Averaged Radial Density . . . 111
6.10 Phase Averaged Axial Neutral Gas Temperature . . . 113
6.11 Power Density . . . 114
6.12 Surface Particle Fluxes . . . 115
6.13 Pocket Rocket Housing Simulation Model . . . 116
6.14 Steady State Gas Temperatures . . . 117
6.15 Axial Neutral Gas and Plasma Density with Pressure Gradient . . . . 121
Chapter 1
Introduction
The first artificial satellite to successfully reach space was Sputnik 1, launched on 4
October 1957. Since then, the number of artificial satellites launched by humans has
passed several thousand and they now form an integral part of modern civilisation.
Satellites are used for civilian, military, and scientific applications and are involved
in the everyday activities of most humans. However, most satellites are large, highly
complex systems that can cost upwards of $600 million US dollars.
A large portion of satellite expenses comes from launch costs which are on the
order of $10,000 US per kilogram lifted into orbit [1], and from costs associated with
development and qualification of components. In an attempt to combat the
increas-ing expense of satellites the current trend is movincreas-ing towards decreased satellite size
and use of Commercial-Off-The-Shelf (COTS) components. These smaller satellites
are known as micro-satellites and are opening up space to a wider range of users.
1.1
Micro-satellites
While an exact definition for micro-satellites does not yet exist, it is generally
ac-cepted that a micro-satellite has a total mass less than 100 kg, total power less
than 100 W and maximum dimension less than 1 m [2]. Within the micro-satellite
category is a sub-class of interest here called CubeSats. CubeSats are 10 cm cube
satellites with a maximum mass of 1.33 kg [3], designed to be constructed from
standardised components. The standardised size and mass means CubeSats can be
de-2 Introduction
ployer [4]. They are also designed to be modular, and can be easily fitted together
to form larger satellites if required.
To date, over one hundred CubeSat missions have been launched into space,
covering a variety of missions such as technology demonstration, scientific research,
communications or simply educating students in the design and build process for
satellites [5]. Like all satellites, CubeSats require on-board systems to control
at-titude (orientation) and orbit alat-titude. Currently, the majority of CubeSats are
launched with no propulsion system on board, using reaction wheels or similar
de-vices to maintain attitude control with uncontrolled orbital decay limiting
opera-tional lifetimes. The strict size and weight requirements of CubeSats limit the size
and weight of the associated propulsion systems adding complex design challenges.
Fittingly, propulsions systems designed for use on CubeSats or other micro-satellites
are known as micro-propulsion systems.
1.2
Micro-propulsion
For any vehicle travelling within a vacuum (or near vacuum), thrust is produced by
expelling propellant from the spacecraft. To maintain conservation of momentum,
the momentum with which the propellant is expelled from the spacecraft must be
equal and opposite to the momentum gained by the spacecraft. Assuming the
pro-pellant is expelled at a constant velocity (the thermal exhaust velocity (vex)), the resultant thrust (T) is given by Equation 1.1 [6, 7], where m˙p is the time rate of change of propellant mass on board the spacecraft.
T =vexm˙p (1.1)
Thermal exhaust velocity (vex) is directly related to the propellant neutral gas temperature (Tg), as shown in Equation 1.2, wherek is the Boltzmann constant and M the propellant molecular mass. The higher the gas temperature, the higher the
exhaust thermal velocity and the higher the thrust produced.
vex= r
8kTg
πM (1.2)
Thrust is required by spacecraft for attitude control, orbit boosting or orbital
re-Micro-propulsion 3
quired to generate only small changes in velocity, whereas orbital transfers require
higher thrust to sufficiently change the velocity of the spacecraft to reach the new
orbit. The change in velocity (∆v) required for any spacecraft manoeuvre is related
to vex and propellant usage through Equation 1.3 where m0 is the initial mass of
the spacecraft including propellant and mf is the final mass of the spacecraft after the manoeuvre including any leftover propellant [8, 9].
∆v =vexln( m0
mf
) (1.3)
The specific impulse (Isp) is a measure of how efficiently thrust is produced per unit mass of propellant used. The maximum attainable Isp assuming all propellant exits the thruster with vex is given by Equation 1.4 where g is acceleration due to gravity.
Isp = T ˙ mg =
vex
g (1.4)
A high specific impulse indicates a high production of thrust per unit mass of
propellant, requiring less propellant mass to be carried on board to complete a
specific ∆v manoeuvre. However, the slower usage of propellant mass requires a
longer burn time (tburn), as shown in Equation 1.5.
tburn= mp
˙ mp
(1.5)
The choice of a propulsion system depends on both the ∆vandtburnrequirements of the mission. Micro-satellite missions do not carry human life, so tburnis usually a low priority, whereas minimising the propellant mass is a high priority and a highIsp is desirable. A summary of performance values for some micro-propulsion systems
potentially suited for CubeSat applications in use or under development is included
in Table 1.1, with a summary of the thrusters following in Sections 1.2.1 to 1.2.3.
Cold gas thrusters are the smallest and least complex type of propulsion
system, where an inert propellant is simply expelled through a nozzle [10,11]. Thrust
produced by small cold gas thrusters suitable for CubeSats varies from µNs to mNs
[2], but propellant efficiency is quite low as the gas is cold. Propellant efficiency
can be improved by heating the propellant before it is expelled through the nozzle,
4 Introduction
Table 1.1: Performance values for micro-satellite propulsion options
Thruster Type Propellant Thrust Isp Power Efficiency Refs.
(mN) (s) (W) (%)
Cold Gas Nitrogen 0.1-5 45-75 - - [2, 10, 11]
Monopropellant Hydrazine 1-4450 162-230 - - [2, 12]
H2O2 1-1.82 100-180 - - [13, 14]
Solid Rocket Various 157-325 196-257 - - [2, 15]
PPT Teflon 0.01-5 200-1500 2.5-30 - [1, 2, 16]
FEEP Cesium 0.001-1.4 9000 3-93 95 [2]
Indium 0.001-0.14 2000-8000 1 95+ [17, 18]
Colloid Various <0.007 300-1500 2 75 [2, 19, 20]
Mini-Ion Xenon 0.1-1.553 3000 20-60 45 [9]
Mini-Hall Xenon 0.1-16 830-1718 50-300 6-34 [2, 21]
Hollow Cathode Xenon 0.0016 85 55 - [22]
Micro-Plasma Argon 0.3-0.4 - 15-20 5-20 [23]
Mini-Helicon Xenon 1 1000 50 20 [24]
Argon - 1200 50 - [25]
Resistojet Hydrazine - 300-400 100-1000 65-90 [1, 26]
Water 0.125 127-150 100 - [2]
Various 109-335 93-385 167-506 - [27]
Arcjet Helium 0.014-0.031 313 119 36 [28]
Hydrazine - 345-471 650-1400 29-36 [1, 29]
Ammonia - 600-900 103-104 - [1, 26]
Hydrogen - 700-1200 104 - [1, 26, 30]
MET Argon 0.2-1.4 50-80 6 2-12 [31, 32]
Helium 0.04-0.51 150-270 6 2-12 [33]
RFET Argon 0.01-0.1 50-85 10-60 - [34, 35]
Micro-propulsion 5
1.2.1
Chemical Propulsion
Chemical propulsion systems are those where the energy produced is stored within
the propellant itself, usually in chemical bonds. Monopropellant rockets heat
the propellant, commonly HAN (Hydroxylammonium Nitrate) or hydrogen
perox-ide (H2O2) through an exothermic breakdown reaction induced by an appropriate
catalyst [2, 13, 14]. Monopropellant rockets are usually too large for CubeSat
appli-cations, but work investigating microelectromechanical systems (MEMS) techniques
to reduce the size and weight is being undertaken [12–14].
Hydrazine monopropellant rockets decompose hydrazine into ammonia and
ni-trogen, then further decompose the ammonia to nitrogen and hydrogen [2, 12]. The
additional energy gained through the decomposition of hydrazine compared to
hy-drogen peroxide or HAN means significantly higher thrusts can be achieved.
How-ever, hydrazine is extremely toxic and flammable increasing cost and risk, and the
by-products of hydrazine decomposition are hazardous to the environment.
Solid propellant rocketsare widely used for orbit insertion and orbit boosting
of larger satellites, but are also usually too large and heavy for CubeSat applications,
although a small array of solid rockets suited for micro-satellite applications has
been tested giving sub mN thrust and specific impulse of a few seconds [15]. Solid
propellant storage is simple but the rockets can only be ignited once. Hybrid rockets
allow for reignition and hence multiple burns, but the propellants are required to be
kept separate increasing the size and complexity of the complete system [1].
Chemical propulsion systems produce high thrust, butvexis limited to 5000 m s−1 by the energy stored in the chemical bonds [6, 7]. Low vex gives low Isp which increases the mass of propellant required to be carried on board. Alternatively, the
propellant may be heated or accelerated through electrical means in which case the
energy of the propellant is controlled by an external source and is not limited by the
propellant internal energy storage [1,6]. This results in higher achievablevex andIsp reducing the fuel required to be carried on board. Conversely, the thrust to power
ratio is quite low so thrust from electric propulsion can be orders of magnitude lower
6 Introduction
1.2.2
Electric Propulsion
Electric propulsion systems are divided into three categories being electrothermal,
electrostatic and electromagnetic. Electrothermal systems use electrical means to
directly heat the propellant and will be discussed further in Section 1.2.3. For
electrostatic or electromagnetic propulsion, ionised propellant is accelerated by static
electric devices or Lorentz forces, respectively.
The first electric propulsion system was a pulsed plasma thruster (PPT),
launched in 1964 on the Soviet Zond 2 spacecraft [37]. A PPT contains a solid bar
of propellant, usually Teflon [2, 26, 37], held between two electrodes. An electrical
discharge across the surface of the Teflon from discharging a capacitor ablates
pro-pellant material that is then accelerated by electromagnetic forces. The thrust per
pulse is low so PPTs are well suited for precision pointing applications [1].
Field Emission Electric Propulsion (FEEP) devices extract ions from the
surface of a liquid propellant using a strong electric field, then accelerate the ions
across a potential gradient [1,2]. Colloidorelectrospraythrusters work on similar
principles, but use charged droplets formed at the tip of a highly biased needle or
capillary from a liquid feed that is not necessarily metallic [1, 2].
The charged propellant may also come from a gaseous discharge rather than
extracted from a solid or liquid source. Within a standard gridded ion thruster,
ions in a gaseous discharge are accelerated using biased grids to speeds in the order
of 105to 106 m s−1 [6] giving anI
sp of several thousand seconds. Micro-ion thrusters suitable for CubeSat applications with powers under 100 W and dimensions on the
order of centimetres are currently under development [9]. Hall thrusters
oper-ate with a gaseous discharge creoper-ated using counterflowing electrons in an annular
chamber [26, 38]. The ionised propellant is accelerated by an electric field removing
the exposed grids of ion thrusters, somewhat reducing erosion issues. Micro-Hall
thrusters suited for CubeSat applications with diameters of a few centimetres
oper-ating on 50-300 W are currently being investigated [21].
Both Hall and ion thrusters expel only positive ions in the exhaust plume leading
to spacecraft charging problems. To balance the charge and allow the plume to
detach from the spacecraft, an external neutraliser is required to inject electrons
Micro-propulsion 7
neutralisers are hollow cathode devices [6] that utilise a heater to emit electrons
from a source tube inside a hollow cylindrical cathode. In addition to applications
as neutralisers for ion and Hall effect thrusters, hollow cathodes are also being
developed directly as thrusters. The Surrey Space Centre have developed ahollow
cathode thruster, capable of delivering a maximum thrust of 1.6 mN with a specific
impulse of 85 s for 55 W power input [22].
The need for a neutraliser is nullified with the use of plasma thrusters that expel
equal numbers of electrons and ions leading to a naturally quasi-neutral exhaust
plume. A 0.6 mm diameter capillarymicro-plasma thrustercreates an estimated
thrust of 0.3-0.4 mN using 20 W input power [23]. Mini-Helicon thrusters are
a sub-type of micro-plasma thruster with high plasma densities, with expected
per-formance of around 1 mN and 1000 s for less than 50 W power input [25, 39].
1.2.3
Electrothermal Thrusters
As opposed to the electric thrusters discussed in Section 1.2.2 where thrust is
pro-duced by ions or other charged particles accelerated through electrical or magnetic
means, electrothermal thrusters use electrical means to directly heat the propellant,
with thrust produced by the heated neutral propellant expanding through a nozzle.
A resistojet supplies heat to the propellant gas by passing it around a heating
element or through a tube with heated walls [1,2]. Propellant choices vary and most
gases can be used, but superheated decomposed hydrazine is most successful [26,27].
Arcjets work on similar principles to resistojets, but gas heating is produced by
passing the propellant gas through an electrical arc. The heating then occurs in the
gas volume rather than by the walls, increasing gas temperatures significantly by
removing any material restrictions on maximum temperature. Propellants used are
mostly inert gases [28, 30], although hydrazine has also been investigated [40].
Both resistojets and arcjets require high powers (102-103 W) to operate,
po-tentially beyond the capabilities of a CubeSat. Power is limited to less than 5 W
continuous for a 1U CubeSats by the available solar panel area, although bursts of
higher power may be available for short time [41].
Alternatively, low power plasma discharges can be used to heat the propellant.
8 Introduction
electrothermal thrusters (METs)) or radio-frequency power [34, 36] (
radio-frequency electrothermal thrusters (RFETs)). Performance values for METs
and RFETs are similar, giving thrust in the order of mNs and specific impulses up
to 85 s for powers less than 10 W using argon.
A radio-frequency electrothermal plasma micro-thruster known as ‘Pocket Rocket’
[42, 43], under development in the Space Plasma, Power and Propulsion laboratory
at The Australian National University, operates on the theory of propellant heating
occurring through ion-neutral collisions within the discharge volume. The Pocket
Rocket thruster forms the basis for this work and is described in depth in Chapter 2.
Firstly though, a complete understanding of propellant heating from ion-neutral
col-lisions within a plasma discharge requires an understanding of base plasma physics,
collisional processes and gas dynamics. A summary of the relevant physics follows
in Section 1.3.
1.3
Plasma
Plasma is the fourth state of matter, created when additional energy supplied to a
gas through thermal or electrical means ionises a non-negligible number of neutral
gas particles. To sustain a plasma, there must be a sufficient number of electrons
with energy higher than the ionisation potential of the background gas to partially
or fully ionise the gas [44].
The charged particles in a plasma discharge interact over relatively long
dis-tances through Coulombic forces, making the plasma conductive and controllable
using applied electric and magnetic fields. Overall a plasma is quasineutral (equal
numbers of positive and negative charges) but small regions of charge imbalance
may spontaneously form within the discharge. The scale length over which charge
imbalance can exist is called the Debye length (λDe) [38, 45], which is a function of electron temperature (Te), permittivity of free space (0), elementary charge (e) and
plasma density (n0), as shown in Equation 1.6.
λDe = r
0Te en0
(1.6)
The length of the containing volume must be many times larger than the Debye
Plasma 9
entire volume and charged particles are lost to the wall until charge balance is once
again reached.
1.3.1
Plasma Breakdown
Breakdown of a gas into the plasma state can be done electrically in a laboratory
environment using an applied electric field. The electric field by itself is usually
not strong enough to directly ionise gas particles, but even in a neutral gas there
exists a sufficient number of free electrons to initiate a breakdown. Free electrons
are accelerated in a direction parallel to the applied electric field gaining energy.
Electrons with sufficient energy undergo ionising collisions with neutral particles
creating electron-ion pairs.
Newly created electrons drift through the discharge volume potentially
undergo-ing additional ionisundergo-ing collisions, exponentially increasundergo-ing the electron density (ne) in a process termed an electron avalanche, represented by Equation 1.7 wherene0 is
the initial electron population, d is the distance between the electrodes or the size
of the container, and λi is the average distance between ionising collisions [45, 46].
ne =ne0e
d
λi (1.7)
If the applied electric field is direct current (DC), then the electric potential
acting to accelerate the electrons is constant and unidirectional. Therefore, each
electron has only one pass through the discharge volume as it moves from the cathode
to the anode to undergo ionising collisions before being lost to the anode surface. For
an alternating current (AC) applied electric field, the electric potential constantly
switches polarity and electrons oscillate within the discharge volume making multiple
passes through the gas before being lost to the walls or anode, thereby undergoing
more ionising collisions [47, 48].
Breakdown in a radio-frequency (RF) field occurs at a specific applied peak
voltage known as the breakdown voltage (Vbr), dependent on both the input power frequency (ωrf) and the pressure-distance (pd) parameter [48,49]. The pd parameter is simply the product of the pressure (p) of the background gas and the characteristic
distance of the discharge (d), usually the distance between electrodes, and provides
10 Introduction
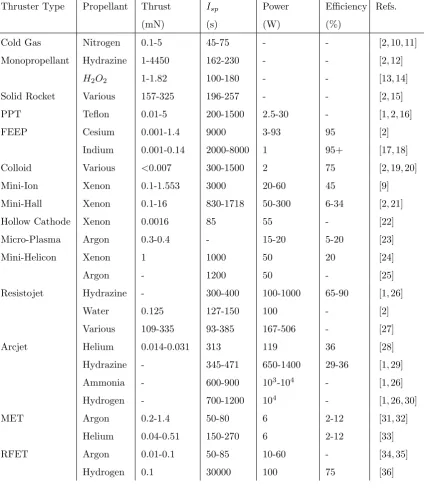
Figure 1.1: A generic Paschen curve showing breakdown voltage with pressure-distance.
For lowωrf or high pd electrons undergo many collisions per oscillation decreas-ingTe, therefore a higherVbris required for sufficient ionising collisions. For highωrf or low pd the gas trends towards becoming a vacuum insulator as electrons undergo
many oscillations per collision, andVbr heads to infinity at a critical value [46,48,49]. A curve of Vbr with pd is known as a Paschen curve, a generic example of which is shown in Figure 1.1. The minimum point on the curve corresponds to the minimum
Vbr achievable for the gas.
1.3.2
Plasma Sheaths
Ions formed during breakdown are accelerated by the external field in the opposite
direction to the electrons, and at a much slower rate as ion thermal velocity is
around 100 times lower than electron thermal velocity [45]. During the initial stages
of breakdown, an influx of electrons lost to the walls occurs before the slower moving
ions reach the walls, creating a region of positive space charge in the plasma bulk
separated from the walls by sheaths. A sheath is a sharp potential drop over a
relatively small physical space that acts to retain electrons in the main plasma bulk
and accelerate ions towards the walls. Once sheaths are established, the plasma bulk
Plasma 11
Figure 1.2: Generic example of potential gradient, and electron and ion densities within the sheath, presheath and bulk plasma.
remains at a constant value by the sheath maintaining equal fluxes of electrons and
ions to the walls. A generic example of potential gradient, and electron and ion
densities within the sheath, presheath and plasma bulk is shown in Figure 1.2.
Ion density (ni) within the sheath is higher thanne as shown in Figure 1.2, with quasineutrality returning at the presheath boundary. Lowerne in the sheath makes the region appear dark as excitation collisions from electrons occur less frequently
than in the main bulk [50]. Despite ni being greater than ne in the sheath region, the electrons are moving significantly faster and to maintain a stable sheath to allow
equal fluxes of ions and electrons to the wall ions must enter the sheath region at
a specific velocity. This is known as the Bohm velocity (vB) [38, 45, 46], given by Equation 1.8 whereMiis the ion mass. Complete derivation ofvBis widely available (in [38, 45] for example) so not included here.
vB = r
eTe Mi
(1.8)
The potential in the main plasma bulk changes slowly and can be assumed to
have a scale length approximately equal to the size of the containing vessel [46]. Ions
in the main bulk are therefore relatively static and an additional region of potential
change must exist acting to give the ions the required directed velocity to reachvB at the sheath edge. This is the presheath region, shown in Figure 1.2, and it carries
a potential drop of ∆Vps = T2e [45].
12 Introduction
estimate for average sheath thickness (s), where λDs and V0 are the Debye length
and potential at the sheath edge, respectively [45].
s=
√
2 3 λDs(
2V0
Te
)34 (1.9)
Sheaths are usually a few Debye lengths thick, as λDe gives an indication of the distances that a potential gradient can exist within a plasma.
1.3.3
Secondary Electrons
Ions accelerated through the sheath regions impact on the wall surface and may
release a secondary electron into the discharge through the Auger process [51]. The
charged nucleus of an ion approaching within atomic distances to the wall deforms
the surface potential well into a passable potential barrier and an electron is released
to neutralise the ion. If the excess energy from neutralisation is higher than the
workfunction of the surface an additional or secondary electron may also be released
[46, 51]. The secondary electron emission coefficient (γ) gives an indication of the
number of electrons emitted per incident ion. Metastable atoms may also release
secondary electrons through a similar process by the atom becoming ionised near
the surface [46].
The emitted secondary electron is accelerated by the sheath back into the main
plasma bulk reaching high energies, potentially well above the ionisation potential
of the discharge gas. In a direct current (DC) discharge, secondary electrons are
required to sustain the plasma as electrons pass only once from the cathode to the
anode, and the number of secondary electrons emitted must be sufficient to balance
the electrons lost to the anode to maintain population levels in the bulk. In an AC
discharge with frequency sufficient to trap electrons through oscillations in the bulk
region, secondary electrons are not as important but can play an important role in
discharge parameters, and there have been reported cases where a radio-frequency
(RF) discharge cannot be maintained without secondary electrons [52].
1.3.4
Capacitively Coupled Plasmas
Power coupling to the discharge gas from RF sources in low pressure discharges
(electro-Plasma 13
static - E) mode, inductive (evanescent electromagnetic - H) mode, and the Helicon
(propagating wave - W) mode [38, 45, 53]. Each successive mode achieves slightly
higher power deposition and plasma density compared to the previous.
The capacitively coupled plasma (CCP) has a powered electrode immersed
di-rectly within the discharge, sometimes covered with a dielectric material, developing
large sheath potentials oscillating with the same frequency as the applied power. The
oscillation of the sheath potentials deposit power into the plasma by accelerating
the electrons. The CCP mode has two additional sub-modes, being the α and γ
modes, where the main ionisation is from bulk electrons and secondary electrons,
respectively [54, 55]. Heating in a CCP occurs through both Ohmic and stochastic
processes. Ohmic heating comes from collisions between electrons and heavy
back-ground gas particles within the discharge [38, 54]. Stochastic heating comes from
moving sheaths imparting energy to the electrons [38, 45].
The sheath regions in a CCP act like capacitors, so a sheath at the RF electrode
and a sheath at the grounded electrode can be thought of as two capacitors in
series with capacitances Crf and Cg, respectively [56]. The voltage (V) distribution between the two sheaths is given by Equation 1.10 where S is the maximum sheath
width and A is the electrode area.
Vrf Vg
= Cg Crf
= AgSrf ArfSg
(1.10)
Usually, Srf is bigger thanSg, so ifAg is bigger thanArf thenVrf is significantly larger thanVgand a blocking capacitor placed in the circuit prior to the RF electrode will charge to give a negative DC self-bias at the RF electrode. The self-bias forms
during breakdown as an influx of electrons to the electrode surface occurs before the
positive space charge and sheaths develop. Electrons lost to the powered electrode
during this period contribute to negatively charging the blocking capacitor [56].
A dielectric material capable of carrying a capacitance placed between the
pow-ered electrode and the plasma may also carry a DC self-bias. A voltage applied to
the powered electrode induces a response voltage (Vr) on the surface of the dielectric exposed to the plasma. When Vr is positive an electron current flows readily to the dielectric surface while little or no ion current flows. However, as the dielectric acts
as an insulator, there must be equal fluxes of ions and electrons to the surface, and
14 Introduction
Figure 1.3: General features of an asymmetric CCP showing self-bias, asymmetric sheath potentials and secondary electron emission.
The negative DC self-bias developed on the dielectric insert must be smaller in
magnitude than the peak RF voltage to allow the sheath to collapse once per RF
cycle. Ions are lost to the walls throughout the entire RF cycle, whereas electrons
are only lost if the sheath potential near the wall collapses to near zero. To balance
the number of positive and negative charges within the discharge, the sheath must
collapse once per cycle to allow a sufficient number of electrons to be lost to the
walls to maintain quasineutrality [45, 56, 57].
An example asymmetric CCP is given in Figure 1.3. The asymmetric sheath
potentials from a negative self-bias on the powered electrode are clearly shown.
Secondary electron emission from ion bombardment of the powered electrode surface
is also demonstrated.
1.3.5
Global Modelling
For a plasma to be in a steady state condition, the number of charged particles
lost to the walls must balance the volume production of charged particles through
ionisation. This provides the basis for a global or zero dimensional model of a
plasma accounting for energy and particle conservation. Particle conservation is
represented by Equation 1.11 [45, 46]. The left hand side (LHS) of Equation 1.11
Plasma 15
The right hand side (RHS) of Equation 1.11 represents walls losses through the
effective surface area Aef f assuming ions are travelling at the Bohm velocity (vB). Kiz(Te)ngneVef f =nevB(Te)Aef f (1.11) Effective volume and area depend on the plasma density profile. For a high
pressure CCP (>100 mTorr) the density profile is approximately sinusoidal [45] and
Vef f and Aef f can be approximated using the length correction factor (h) given in Equation 1.12, where l is length (or radius) of the plasma volume and νi is the ionisation collision frequency.
h= πvB lνi
(1.12)
Both Kiz and vB are functions of Te, so an iterative procedure to scan through values ofTe until the LHS and RHS of Equation 1.11 are equal gives an estimate for Te. Once Te is known, a power balance accounting for energy within the discharge gives an estimate for plasma density (n0) using Equation 1.13, where the LHS is
power input to the discharge from an external source (Pin) and the RHS is energy losses from processes within the discharge [45, 46].
Pin =n0evB(Te)Aef f[c(Te) +s(Te) + 2Te] (1.13) Energy loss related to collisions, both ionisation and excitation, is given byc(Te), energy lost to the walls though ion bombardment is given bys(Te), and energy lost during electron collisions with walls is equivalent to the electron thermal energy
(2Te). For a low voltage sheath,s(Te)≈5kTe (the plasma potential) but for a high voltage sheath or in the presence of a negative DC self-bias, s(Te) is much higher and becomes the dominant energy loss mechanism [45].
1.3.6
Gas Discharge Collisional Processes
Within the main plasma bulk collisions between particles both sustain and heat
the discharge and are paramount to plasma physics. Collisional processes within a
gas discharge may be elastic, inelastic or superelastic. During an elastic collision
potential energy does not change and kinetic energy is conserved. An elastic collision
between two particles of the same mass will result in about half the kinetic energy
16 Introduction
energy and potential energy occurs and one particle enters an excited or ionised state.
Inelastic collisions only occur if the energy of the incoming particle exceeds the first
excitation potential. A superelastic collision results in a transfer from potential
energy to kinetic energy during de-excitation of a particle.
The collisional cross-section (σ) is the area within which two particles will
in-teract. For neutral-neutral collisions σ can be approximated simply as a hard body
sphere cross section and is independent of particle velocity (energy). For
colli-sions involving charged particles the electric field of the charged particle temporarily
changes the electronic configuration of the neutral by attracting or repelling the
elec-tron cloud, forming a temporary dipole acting to increase the attraction between the
particles. The effect of the electric field is dependent on the velocity of the charged
particle and σ is dependent on particle energy.
The mean free path (λmf p) is a measure of the distances a particle will travel before the uncollided flux drops to 1e, and is given by Equation 1.14 for charged particle collisions, where ng is neutral gas particle density [45]. For neutral-neutral collisions, a factor of 14 must be included on the RHS of Equation 1.14 to account
for the size of the colliding particles [46]. The mean time between collisions (τc) is given by Equation 1.15 where ¯v is the average particle velocity.
λmf p = 1 σng
(1.14)
τ = λmf p ¯
v (1.15)
Of particular interest in this work are ion-neutral momentum transfer collisions,
and ion-neutral charge exchange (I-N CEX) collisions that occur when an ion passes
sufficiently close to a neutral atom for a valance electron to be transferred from
the neutral to the ion. If this occurs with no change in particle kinetic energy the
collision results in a slow ion and a fast neutral. For a discharge volume where the
ion-neutral mean free path is much smaller than the containing vessel scale length,
a significant population of hot neutral atoms is generated. The hot neutrals have
higher velocities than the cold neutral population and may accelerate in the direction
of plasma flow leaving a depleted neutral population in the main bulk in a process
termed ‘neutral pumping’ [58, 59]. Thermalising collisions between the hot and cold
Thesis Scope 17
plasma source, the flow of hot neutrals increases the momentum of the neutral jet
expelled from the source [60], making a device based on these principles a viable
electrothermal plasma micro-thruster.
1.4
Thesis Scope
The Pocket Rocket device under development at the Australian National University
(ANU) is an electrothermal plasma micro-thruster concept based around neutral
gas heating from ion-neutral collisions and is described in depth in Chapter 2. This
thesis focusses on the use of experimental and computational techniques as outlined
in Chapter 3 to investigate the underlying physical mechanisms of the Pocket Rocket
device, especially in regards to neutral gas heating.
Direct experimental measurements of neutral gas temperature are made and
discussed in Chapter 4, successfully demonstrating proof of concept for the device.
Basic estimates for performance (thrust, specific impulse and efficiency) are made
using the measured temperatures to compare with other micro-propulsion devices
discussed in Section 1.2. Direct measurement of thrust using a thrust balance or
similar device is not included here due to engineering challenges associated with the
early experimental design of the Pocket Rocket device.
Spatiotemporal profiles of neutral gas heating in Pocket Rocket are given in
Chapter 5, identifying the various gas heating mechanisms involved. Computational
Fluid Dynamics (CFD) simulations complement the spectroscopy experiments and
are presented in Chapter 6. A preliminary simulation of the Pocket Rocket device
operating under standard conditions is initially performed with results compared to
previous experimental results where possible for validation. Extension simulations
investigating the role of secondary electrons and pressure gradient are then
per-formed to further investigate the application of Pocket Rocket as an electrothermal
plasma micro-thruster without the need to adapt the physical experimental device.
Outcomes of this work are demonstrating proof of concept for the Pocket Rocket
device and enhancing the understanding of gas heating mechanisms in electrothermal
plasma devices. Results can be used in the further development of a flight ready
Chapter 2
Apparatus and Diagnostics
An electrothermal plasma micro-thruster device being developed at the Australian
National University, known as ‘Pocket Rocket’ [42, 43] and described completely in
Sections 2.1 to 2.3 forms the basis for this work. The Pocket Rocket device has been
designed for operation with small satellites, including CubeSats, and must therefore
be small, lightweight and low power. As this work does not include the
develop-ment of a self-contained, fully developed flight prototype, many of the components
used during experiments are not suited for satellite operation. However, the setup
provides the opportunity to study the Pocket Rocket device using multiple
exper-imental techniques, and gain a better understanding of the operation and physics
behind the thruster.
2.1
The Pocket Rocket Device
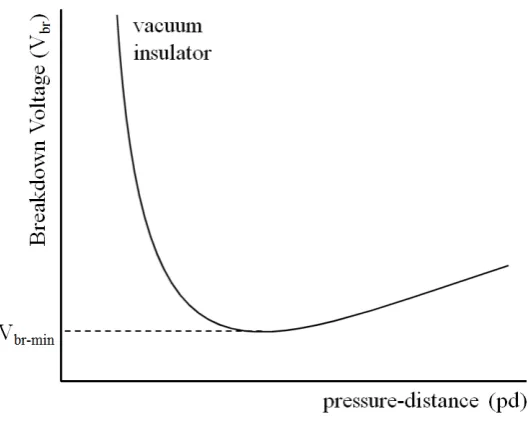
The Pocket Rocket device, shown in Figure 2.1, consists of an 18-20 mm long, 4.2 mm
inner diameter, 6.3 mm outer diameter alumina tube. A 5 mm wide, 12 mm
diame-ter, annular copper powered electrode surrounds the alumina tube at the midpoint,
creating an asymmetric weakly ionised (<1%) capacitively coupled plasma (CCP)
inside the tube. Two 3 mm wide sections of the 60 mm outer diameter grounded
aluminium thruster housing contact the alumina tube at either end, acting as the
grounded electrodes to complete the circuit.
The powered and grounded electrodes are separated by 3 mm on the downstream
20 Apparatus and Diagnostics
Figure 2.1: The Pocket Rocket device with section cutaway showing electrode detail.
diameter two part Macor housing encasing the powered electrode. Downstream, the
grounded electrode has a large exposed surface normal to the alumina tube with
a diameter of 50 mm, referred to as the end plate of the device. Upstream, the
grounded electrode has an exposed surface normal to the alumina tube with 40 mm
diameter and acts as one wall of an upstream plenum chamber.
The plenum chamber is 12 mm deep, with 40 mm inner diameter, 70 mm outer
diameter and grounded aluminium walls. When the 20 mm long alumina tube is
used, the tube protrudes 2 mm upstream of the thruster housing and electrodes,
into the plenum chamber. Operating gas, or the propellant, is introduced to the
system through a 2 mm hole on the side of the plenum chamber. A pressure gauge,
either a Granville Phillips Convectron gauge for the work in Chapter 4, or an MKS
10 Torr Baratron gauge for the work in Chapter 5, connects to the plenum chamber
through a similar 2 mm hole directly opposite the gas inlet. The rear wall of the
plenum chamber contains a 20 mm diameter quartz window providing axial optical
access to the discharge inside the alumina tube. The window may also be removed,
leaving a 30 mm diameter probe access port.
Argon (Ar) [42, 43, 61], nitrogen (N2) [62–64], hydrogen (H2) [65, 66] or carbon
dioxide (CO2) may be used as the propellant, with Ar and N2 the main operating
Power System and Matching Network 21
external plastic and metallic pipes, with flow rates controlled by a either a ball
valve, leak valve, 100 sccm MKS flow controller or 500 sccm MKS flow controller,
depending on the particular experiment. Both MKS flow controllers are calibrated
for N2 and are controlled by an MKS type 247 four channel readout device, with
separate channels calibrated for Ar and N2.
2.2
Power System and Matching Network
Radio-frequency (RF) power at 13.56 MHz is coupled to the Pocket Rocket discharge
through the annular copper powered electrode. Power is produced by an ENI
OEM-25 RF generator with 3000 W maximum output power and 50 Ω output impedance
for the work in Chapter 4, or an ENI ACG-10 RF generator with maximum output
power of 1200 W and 50 Ω output impedance for the work in Chapter 5. Standard
operational power is 10 W (generator output), but for experiments powers used
range from 5 W to 60 W as required to suit the experimental application.
The use of RF power introduces complexities into the system in regards to
impedance matching. The RF generator and all cables used for connecting
com-ponents are designed with 50 Ω impedance. However, the impedance of a typical
laboratory plasma varies widely and an intermediate electrical component known as
a matching network must be placed between the generator and Pocket Rocket to
make the discharge and matching network combine to give a 50 Ω total impedance.
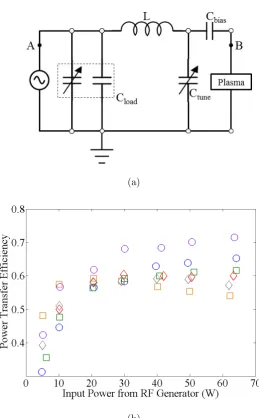
For this work, a π-matching network consisting of four capacitors (two variable and
two fixed capacitance) and a hand wound inductor, with schematic shown in Figure
2.2(a), matches the impedance of the plasma to the 50 Ω impedance of the generator
and cables.
The load capacitor (Cload) is a MEIVAC 0-1000 pF variable vacuum capacitor placed in parallel with a 500 pF fixed capacitor, and the tune capacitor (Ctune) is a MEIVAC 0-500 pF variable vacuum capacitor. The hand wound inductor is
constructed of 5 mm thick copper wire wound into 4.25 loops with 75 mm diameter
and a total length of 85 mm.
self-22 Apparatus and Diagnostics
(a)
[image:40.595.133.393.155.574.2](b)
Figure 2.2: Impedance matching network: (a) circuit diagram of theπ-matching network used to match Pocket Rocket to the 50 Ω generator including the locations of two Impedans Octiv probes to measure current and voltage at A and B, and (b) power transfer efficiency through the matching network for N2 at 4.0 Torr (blue circles), 1.5 Torr (green squares)
Power System and Matching Network 23
bias that develops. The Pocket Rocket device is highly asymmetric, with a powered
electrode area of ∼1 cm2 compared to a grounded electrode area encompassing the
ground electrode surfaces in contact with the alumina tube, the grounded plenum
walls and the grounded end plate of ∼58 cm2. As discussed in Section 1.3.4, an
asymmetric CCP will develop a DC self-bias, and while the dielectric alumina tube
carries some of the DC self-bias, the bias capacitor is included for additional
protec-tion. This is especially relevant at higher applied voltages when the dielectric tube
cannot carry the entire DC self-bias.
Prior to the matching system a Daiwa CN-801 standing wave ratio (SWR) meter
inserted in series into the circuit measures the ratio of the forward to reflected power,
as a guide to the effectiveness of the match. The SWR is expressed as shown in
Equation 2.1 in terms of forward power (Pf) and reflected power (Pr). The closer the SWR value is to 1, the higher the ratio of forward to reflected power, the
more effective the match and the better the power transfer is through the matching
network and plasma load. Throughout this work, unless otherwise stated, the SWR
is less than or equal to 1.2.
SW R= 1 + p
Pr/Pf 1−p
Pr/Pf
(2.1)
Power transfer efficiency through the matching network for various operating
conditions is shown in Figure 2.2(b), measured using two Impedans Octiv 13.56 MHz
probes inserted in series into the circuit. One Octiv probe was positioned pre-match
(position A in Figure 2.2(a)) and the other positioned post-match (position B in
Figure 2.2(a)), to simultaneously measure the power before and after the matching
network during operation. For power inputs from the generator of 20 W or higher,
power transfer efficiency is approximately 60%, decreasing to 40% for lower input
powers down to 5 W. All powers stated in this work represent the forward power
measured pre-match at position A.
Post match, an Impedans Octiv 13.56 MHz probe inserted in series into the
cir-cuit measures post-match power, current (Irms) and voltage (Vrms). Power is fed into the vacuum chamber through a hermetically sealed SMA connector, located at
the bottom of the Pocket Rocket housing, in line with the location of the powered
electrode. Input power is transferred from the SMA connector into the powered
24 Apparatus and Diagnostics
diameter and 20 mm length. The pin sits within a hole drilled into the aluminium
and Macor housings (see Figure 2.1), protected from the grounded housing by a thin
sleeve of alumina tubing. One end of the pin is inserted into the female side of the
SMA connector and the other end screws into the powered copper electrode.
Within the Pocket Rocket device, the dielectric alumina tube acts as a capacitor
and carries at least some of the DC self-bias that develops [43, 61]. The weakly
ionised discharge, without considering the annular geometry, constitutes an
equiva-lent electrical circuit comprising a capacitance from the powered electrode sheath,
a resistance from the main plasma bulk and another capacitance from the grounded
electrode sheath.
2.3
Vacuum Chamber
As previously discussed in Section 1.3.1, the voltage required to initiate breakdown
of a gas discharge depends on the operating gas, gas pressure (p) and inter-electrode
or characteristic distance (d). Each gas will have a minimum breakdown voltage
at a particular pressure-distance (pd), regardless of the other operating parameters.
Paschen curves for Pocket Rocket discharges for Ar, N2, and CO2, determined by
recording the post-match voltage required for breakdown for various operating
con-ditions, measured using an Octiv probe, are shown in Figure 2.3. Using the diameter
of the Pocket Rocket tube (4.2 mm) as the characteristic distance, this gives
mini-mum breakdown voltages, hence standard operating pressures, of 1.2 Torr for CO2,
1.5 Torr for Ar and around 2.5 Torr for N2.
To achieve the required sub-atmospheric pressures for operation, a six way cross
vacuum chamber with 200 mm diameter arms, fitted with a 40 m3 hr−1 flow rate
rotary pump is used. The Pocket Rocket device connects to the left arm of the
chamber using the 50 mm diameter, 700 mm long glass tube to allow optical access
to the exhaust plume. The complete experimental setup including vacuum chamber,
Pocket Rocket, gas feed and power systems is shown in Figure 2.4.
Base pressures within the vacuum chamber are on the order of 10−3 Torr,
mea-sured using a Granville Phillips Convectron gauge mounted on the right arm of the
Bara-Vacuum Chamber 25
Figure 2.3: Paschen Curves for Pocket Rocket showing argon (red diamonds), N2 (blue
circles), and CO2 (green squares).
tron gauge mounted on the rear arm of the vacuum chamber for works presented
in Chapter 5. During operation of the Pocket Rocket device, the pressure gradient
between the plenum chamber and vacuum chamber is between two and four for all
operating conditions used.
2.3.1
Pressure Gradient and Choked Flow Criterion
As an electrothermal thruster operating in space, Pocket Rocket will be subjected
to significantly higher pressure gradients, with background pressures around 10−10
to 10−8 Torr in low earth orbit (LEO) giving pressure gradients between 108 to 1010.
However, as an electrothermal thruster Pocket Rocket operates on the principle
of neutral gas flow through a tube expanding into a lower pressure volume. The
gas starts in an effective near stagnant state in the plenum with pressure ppl, and accelerates through the discharge tube to expand into the downstream glass tube
with background pressure pex. When the pressure ratio ppl
pex reaches a critical value
given in Equation 2.2, the flow will reach Mach 1 at the tube exit and become
choked [67].
ppl pex
= (γ+ 1 2 )
γ
γ−1 (2.2)
For all gases the choked flow criterion is reached for values of ppl
pex less than 2.1 [67],
after which the pressure at the tube exit becomes independent of the pressure in
approxi-26 Apparatus and Diagnostics
Figure 2.4: Complete experimental setup of the Pocket Rocket apparatus including exter-nal power and gas systems
mately 2, the gas flow within the Pocket Rocket discharge tube is unlikely to change
significantly, and the preliminary experiments presented here can be performed
with-out the need to introduce additional complexities and costs to the vacuum chamber
setup described above by adding a higher pumping capacity.
The flow becoming choked at the exit of the discharge tube makes Pocket Rocket
naturally act similar to a de Laval nozzle, where flow converges through a narrow
section (the discharge tube) to reach Mach 1 at the throat (the discharge tube exit),
before expanding into a divergent section (the expansion tube). In the preliminary
experimental design state, as outlined above, the geometric properties of Pocket
Rocket in respect to nozzles is completely unoptimised, as noted by the sharp right
angle corners on the discharge tube inlet and outlet. For this work, the effects of
a nozzle are not important as the focus is on the underlying plasma physics within
the discharge tube and not the overall performance of the device as a thruster. For
future prototype development, addition of shaped converging and diverging nozzle
Chapter 3
Diagnostics
Understanding main discharge parameters such as plasma potential (Vp), electron temperature (Te) and plasma density (n0), is essential to characterise the discharge
for any plasma application. For Pocket Rocket, with its application as an
elec-trothermal thruster, it is also important to understand the background neutral
flow parameters such as velocity (v) and neutral gas temperature (Tg). To gain an understanding of both the discharge and flow properties within Pocket Rocket,
a combination of experimental and computational diagnostic techniques is used.
Experimental diagnostics for discharges are either invasive, where a diagnostic
tool is placed directly into the discharge, or non-invasive, where measurements are
made remotely without perturbing the discharge. For this work, the majority of
ex-periments are performed using non-invasive optical techniques outlined in Sections
3.2 and 3.3 with simplistic invasive probe experiments also performed as required,
outlined in Section 3.1. To complement the experimental diagnostics with a
com-putational diagnostic, Comcom-putational Fluid Dynamics (CFD) simulations are also
used and are discussed in Section 3.4.
3.1
Langmuir Probe
Electric probes have been used for laboratory plasma diagnostics since the 1920s [68]
and a variety of probes now exist to study different plasma parameters. Emissive
probes measure plasma potential [38,69] with a resolution around 0.2 eV [70],
28 Diagnostics
Figure 3.1: Langmuir Probe used for Pocket Rocket diagnostics
electron energy distribution function (EEDF) [45, 71, 72], and more advanced probe
configurations such as the retarding field energy analyser (RFEA) measure directed
current and infer energy distribution, n0 and localVp [73, 74].
Only Langmuir probe diagnostics are used in this work. Langmuir probes consist
of a metal wire, disk or ball inserted into the discharge that may be biased with an
electric potential [45, 71]. A biased probe tip will draw a current from either ions
or electrons (depending on applied bias voltage), from which Vp, Te, ne, ni and the EEDF can be inferred. When unbiased, the probe tip floats to the floating potential,
such that no net current is drawn by the probe tip.
The Langmuir Probe used in Pocket Rocket is shown in Figure 3.1. The end
cap provides the termination point for internal probe wiring, with a vacuum BNC
connection fitted to allow bias voltages to be applied to the tip and the collected
signal returned to an external reading device (multimeter or oscilloscope). The
end cap connects to the metal shaft, passing through the vacuum feed-through,
designed to be installed in place of the rear plenum viewport, allowing the probe
to be inserted and moved axially down the alumina tube of Pocket Rocket, without
needing to break vacuum.
The probe head is a planar disc with 1 mm diameter, separated from the metal
shaft by a 30 mm long, 2 mm diameter alumina tube. The probe tip protrudes
from the end of the alumina tube, held in place by Autocrete high temperature
Optical Emission Spectroscopy 29
shaft of the probe and perturbing the measurements. The alumina tube is inserted
telescopically inside the metal shaft, held in place by a small grub screw and sealed
with Autocrete, and provides an electrical separation between the grounded shaft
and the probe tip. For all measurements in this work, the probe is inserted through
the plenum probe port such that the probe tip lies on the central axis of the device,
at the axial midpoint of the tube in line with the centre of the powered electrode.
The plasma density is measured by applying a negative bias greater than the
floating potential to the Langmuir probe tip using a series of 9 V batteries, such
that probe tip collects positive ions but repels any negatively charged electrons. The
resulting net current, measured using the voltage drop across a 10 kΩ resistor, is the
ion saturation current (Isat). For a 1D planar probe, Isat is related to ni through Equation 3.1 [75–77], wherevb is the Bohm velocity andAs is the collecting area of the probe including the sheath. The constant 0.368 is to account for the shape of a
1D planar probe presheath [77].
Isat = 0.368eniAsvb (3.1) Further probe measurements of the Pocket Rocket discharge are not feasible as
the small diameter of Pocket Rocket combined with the invasive nature of Langmuir
probes results in plasma perturbation and flow constriction, and restricts the use
of RF compensation [78, 79]. Instead, non-invasive optical techniques are used for
further measurements.
3.2
Optical Emission Spectroscopy
Plasma discharges are naturally luminous, which means non-invasive emission
spec-troscopy diagnostics are a powerful tool for analysing plasma discharges. The light
emitted from a plasma arises from the continual excitation and de-excitation of
electrons to different electrical levels within the discharge atoms. Within an atom,
electrons are confined to orbitals defined by a wavefunction ψ, which is essentially
a probability function, and are therefore restricted to orbitals that form a standing
wave around the nucleus. Otherwise, over successive electron orbits, the
wavefunc-tion goes to zero at every point, the probability of finding the electron anywhere
30 Diagnostics
The wavefunctions of electron orbitals are eigenfunctions found through solving
the time independent Schr¨odinger equation [80], given in Equation 3.2.
Hψ =Eψ (3.2)
The Hamiltonian (H), defines the total energy of the electron. The eigenvalues of
the wavefunction (E), are the allowed energy levels of orbitals, with each orbital
(with wavefunction ψ) having a single allowed energy.
Transitions between any two orbitals with E0 and E00 (where E0 > E00) will
correspond to a discrete energy difference given by ∆E =E0−E00. For an electron to move to a higher energy orbit, energy equal to ∆E must be absorbed. This energy
may be gained through collisions or photon absorption. Absorption spectroscopy
uses this principle, where a laser is tuned to a specific energy to excite a certain
transition within a particle for the study of a resulting excited state [81, 82].
Conversely, emission spectroscopy utilises naturally occurring photon emission
from an electron in an upper or excited state spontaneously returning to a lower
state. During this transition, a photon with energy exactly equal to ∆E is emitted.
From Planck’s law, E = hν, and the frequency (hence wavelength) of the emitted
radiation is constant for a particular transition, as given by Equation 3.3.
1 λ =
ν c =
(E0−E00)
hc (3.3)
The wavelength of the emitted photons are often within the visible spectrum,
allowing for optical emission spectroscopy (OES) diagnostics. The simplest OES
diagnostics can be performed with just the human eye. Depending on the discharge
gas used, light emission will be weighted towards a set range of wavelengths, giving
different gases varying colours [46, 83]. For example, argon (Ar) appears purple,
nitrogen (N2) appears orange/pink and carbon dioxide (CO2) appears violet/blue,
as demonstrated by Figures 3.2(a), 3.2(b) and 3.2(c), capturing the Pocket Rocket
discharge as viewed through the plenum window for Ar at 10 W and 1.5 Torr, N2
at 10 W and 2.5 Torr and CO2 at 20 W and 1.0 Torr.
Sputtering of solid objects within the discharge may also be visible to the naked
eye. Figure 3.2(d) shows an argon discharge in Pocket Rocket at 10 W and 1.5 Torr