COMMISSION OF THE EUROPEAN COMMUNITIES
Third information seminar on the radiation protection
dosimeter intercomparison programme
Beta intercomparison - Grenoble
6 to 8 October 1980
COMMISSION OF THE EUROPEAN COMMUNITIES
Radiological protection - 24
Third information seminar on the radiation protection
dosimeter intercomparison programme
Beta intercomparison - Grenoble
6 to 8 October 1980
Directorate-General
Employment, Social Affairs and Education
Health and Safety Directorate
Published by the
COMMISSION OF THE EUROPEAN COMMUNITIES DirectorateGeneral Information Market and Innovation
Bâtiment Jean Monnet LUXEMBOURG
LEGAL NOTICE
Neither the Commission of the European Communities nor any person acting on behalf of the Commission is responsible for the use which might be made of the following information
Cataloguing data can be found at the end of this publication
Luxembourg, Office for Official Publications of the European Communities, 1982 ©ECSCEECEAEC, Brussels ■ Luxembourg, 1981
Printed in Belgium
CONTENTS
Page
P R E F A C E T
Part A - The Intercomparison Programme Sessions I + II - Chairman : H. DE CHOUDENS
1. Aims and Historical Survey 5 G. PORTAL
2. Description of the First Intercomparison Programme for
Per-sonal Beta-ray Dosemeters q H. SEGUIN / J. BÖHM
3. Description of the Beta Personal Dosemeter Irradiations at
LMRI, NPL and PTB 11 M. CANCE / B. OWEN / J. BÖHM
4. Comments by Participants
(a) CEA - Departement de Protection, Fontenay-aux-Roses .... 21 F. BERMANN
(b) CEA - Centre d'Etudes Nucléaires, Grenoble 25 Y. HERBAUT
(c) CEGB - Berkeley Nuclear Laboratories 27 I.M.G. THOMPSON
(d) KFA - Jülich 31 M. HEINZELMANN
(e) Nuclear Research Centre, Karlsruhe 39 B. BURCKHARDT
(f) NRMS, Dublin 45 D.J. MURNAGHAN
(g) NRPB, Chilton 51 T.O. MARSHALL
(h) SCK/CEN, Mol 53 L. GHOOS
(i) CNEN, Bologna 56 G. BUSUOLI
(j) GSF, Neuherberg 58 D.F. REGULLA
(k) Risd NL, Roskilde 62 P. CHRISTENSEN
5. Evaluation of the Results of the First Intercomparison
Page 6. Review of the Intercomparison Comments of the Editing
Committee 8 0
Session III Chairman : G.H. HOFMEESTER
7. Future Trends in Beta Dosimetry 95
I.M.G. THOMPSON
S. Future Intercomparison Programmes 109
S. WAGNER
Part Β General Topics of Interest Session IV Chairman : G. PORTAL
1. Legal Requirements on Beta Dosimetry 117
F. NOCERA
2. Quantities and Units 124
G. PORTAL
3. The Calibration Hierarchy for Beta Dosimetry 128
M.J. ROSSITER
4. Standardization of Beta Reference Radiation 132
J.L. CHARTIER
5. The Role of Beta Dosimetry in Radiation Protection 136
E. PIESCH
6. Practical Beta Dosimetry in Radiation Protection 146
P. CHRISTENSEN
7. State of the Art in Beta Dosimetry 161
D.F. REGULLA
8. Betaray Dosimetry in Mixed Beta/Gammaray Fields 1?8
T.O. MARSHALL / T.M. FRANCIS
9. The Influence of Bremsstrahlung on the Calibration of Doseme
ters for Beta Radiation Demonstrated by means of an example 181
M. HEINZELMANN
10. Determination of Absorbed Dose Rates with Airfilled extrapo lation Chambers at Small Chamber Dimensions or Low Gas Pres
sures 190
J. BÖHM / M. SCHNEIDER
11. Summary of Editing Committee 198
List of Participants 2C1
ν
PREFACE
Since 1964 the Health and Safety Directorate of the Commission of the European Communities, in collaboration with competent institutes and
laboratories in the Member States, has been conducting intercomparisons of personal dosemeters· The objective of these intercomparisons is to improve monitoring of exposure to ionizing radiation and to establish a common basis for dose assessment. They therefore have a direct bearing on one of the aspects of physical control, as regulated by the Directive of the Council,of the European Communities of 15th July 1980 which lays down the basic safety standards for the health protection of the general public and workers against the dangers of ionizing radiation.
This is the first time the Commission has carried out an intercompa rison exercise for betaray dosemeters.
There is still a great deal of uncertainty in this type of dosimetry and it is desirable to improve measuring techniques, particularly as the number of persons exposed to beta radiation is expected to increase in future as a result of the increasing production and use of radioisotopes in the medical and industrial sectors and because of the increase in the reprocessing of nuclear fuels.
The result of this intercomparison have been discussed at the 'Third Information Seminar of the European Radiation Protection Intercompa rison Programme', organised by the Commission of the European Communities in conjunction with the Commissariat a l'Energie Atomique, Centre d'Etudes Nucléaires de Grenoble, from 6 to 8 October 1980.
This document contains the original papers given on the occasion of this seminar together with the comments and conclusions of the editing committee.
1
-PART
-3-Session I + II
-5-AIHS AND HISTORICAL SURVEY
G. PORTAL
Commissariat à l ' E n e r g i e Atomique, Fontenay-aux-Roses
In 1964 the Health and Safety D i r e c t o r a t e i n i t i a t e d the dosemeter intercomparison programme together with a Working Party on Personal Dosimetry.
PRINCIPLE
In this programme reference radiations available at several centres are used to irradiate the dosemeters, submitted by the various participants, to known radiation doses. The values of these doses are made known to the participants by the secretary of the Working Party, after all the results of the evaluations have been received. On completion the participants meet to analyse the results and to use the experience gained to assist in the planning of future intercomparison exercises.
NATURE OF THE INTERCOMPARISONS
From the outset two essential principles were agreed to define the line of approach in these intercomparisons. They would be carried out mainly for dosimetric systems normally used in routine operations and dosemeters should be evaluated using the same methods during the intercomparison. Moreover they would be carried out in conditions which would guarantee anonymity. The results would be published with a code number known only to the laboratory concerned. These measures were taken to avoid discouraging any laboratory from taking part.
AIMS
These intercomparisons have a variety of aims. The ultimate objec-tive is to ensure regular surveillance of the quality of personal dosimetry in the various laboratories in the Community.
been achieved a new objective is envisaged namely standardization of perfor-mance at Community level. Of course the large laboratories should also bene-fit from these intercomparisons. The advantages for them would be the stimu-lating effect of the comparisons and the direct contact with other laborato-ries, facilitated by the programme. Thus, techniques in all the laboratories may be expected to improve, along with a steady improvement in dosimetry.
Finally, during these exercises, the laboratories which are particu-larly well equipped as regards reference radiation would be expected to help where possible with the irradiation of the dosemeters submitted by the participants. Obviously this would also give the other participants a chance to periodically recalibrate their own reference systems. In addition the reference laboratories would inevitably make contact with one another during this intercomparison, thus having the opportunity to standardize their own reference installations.
INTERCOMPARISON PROGRAMMES
(a) For photon radiations
The first campaign started in 1964 on a modest scale. At the time there were only a small number of participants and the first irradiations were carried out using only Co radioactive sources. The irradiation centres at the time were :
- the PTB in Brunswick,
- the R i j k s i n s t i t u u t in B i l t h o v e n , - the GSF in Muni ch,
- the CEA in Fontenay-aux-Roses.
The number of p a r t i c i p a n t s has increased over the y e a r s . Thus during one of the most recent campaigns 30 p a r t i c i p a n t s were i n v o l v e d .
At the same time the r a d i a t i o n s have been d i v e r s i f i e d with t h · i n t r o d u c t i o n of X-rays and X-ray and gamma-ray m i x t u r e s . I n i t i a l l y only f i l m dosemeters were t e s t e d . Subsequently, RPL and RTL dosemeters were included and t h i s added a new dimension to the intercomparison.
An optimum has thus been obtained and the conclusion was that there is no point in maintaining the photon programme at its present level; a campaign every 3 to 4 years should from now on be enough to ensure that standardiza-tion of performance is maintained. A new type of radiastandardiza-tion might then be introduced.
(b) For neutron radiations
The same type of intercomparison campaign was carried out for neutrons. Two initial campaigns which related exclusively to nuclear emul-sions showed that this dosimetric system cannot be used for neutrons with an energy lower than 0.7 MeV. Moreover between 0.7 and 2 MeV the results are not very precise.
During the second campaign the only progress made was by the labora-tories that applied correction factors i.e. a correction which is based on an estimate of the neutron energy. As this is not practicable for routine application it was decided to abandon this type of comparison and to replace it by that of albedo dosemeters.
The intercomparisons of this dosemeter type were carried out satisfactorily. For the present the results have shown for all the participants -the practical limits of this system, in that it can only be used in areas throughout which the neutron spectrum remains constant. Special calibration is required for each particular area. In my opinion these campaigns should be carried out with a different aim than the one referred to at the begin-ning of this note. They should be devoted to the development of new systems, even if these are not yet in routine use.
(c) For beta radiations
The intercomparison which is the subject of the present seminar was carried out in 1979 as a pilot intercomparison. The aim was to broaden the scope of the intercomparison programme following the preliminary intei— comparison between the irradiating laboratories (NPL, PTB, LMRI).
-8-CONCLUSION
One conclusion i s p e r f e c t l y obvious - i . e . the complete success of the photon intercomparison programme. The performances of the various labo r a t o r i e s have been standardized and t h e r e has been a general advance in techniques. An unexpected by-product of t h i s Working P a r t y ' s a c t i v i t i e s was the decision to set up a Working Party w i t h i n the ISO to prepare standards to be used for the production of reference r a d i a t i o n .
DESCRIPTION OF THE FIRST INTERCOMPARISON PROGRAMME FOR PERSONAL BETA-RAY DOSEMETERS
H. SEGUIN
Commission of the European Communities, Luxembourg
J. BOHM
Physikalisch-Technische Bundesanstalt, Braunschweig
The extensive use of radioactive sources in industry, medicine and research often requires a beta-ray dose assessment for radiation protection purposes. Some improvement in the performance of personal dosemeters for the measurement is required and the Commission of the European Communities therefore decided to organize an intercomparison programm for personal dosemeters irradiated with beta-radiation. As it was the first intercom parison if this kind the number of participants was limited to twelve. Only standard reference beta-radiations given in ISO/DP 6980, 1980 (draft proposal), would be used and the irradiations would be carried out by three primary standard laboratories, the PTB (Germany), NPL (United Kingdom) and LMRI (France).
T. ... 90 0 90 204_, . 147„ , The radionuclides Sr+ γ, Tl and Pm were employed. Their
147
maximum and mean energies are given in Table 1. Pm was used to irra diate thermoluminescence dosemeters with very thin covers and - in one case only - a film. Participants were instructed to mark dosemeters not to be irradiated with 147 Pm .
Maximum beta-energy at the dosemeter, MeV
Mean beta-energy at the dosemeter, MeV
Radionuclide
9 0S r+ 9 0Y
2.1
0.8
2 0 4n
0.68
0.26
147Pm
0.19
0.07
-10-The physical quantity which it was agreed to measure was the
absorbed dose D in soft tissue (composition see ICRU report 33, 1980) 70/urn below the surface of a soft tissue equivalent phantom with a density of 1 g cm assumed to be an infinitely thick slab (1). The factor for converting D into the absorbed dose in soft tissue averaged over tissue depths between 50/jn and 100/jm was also given for all the irradiations by the primary standard laboratories.
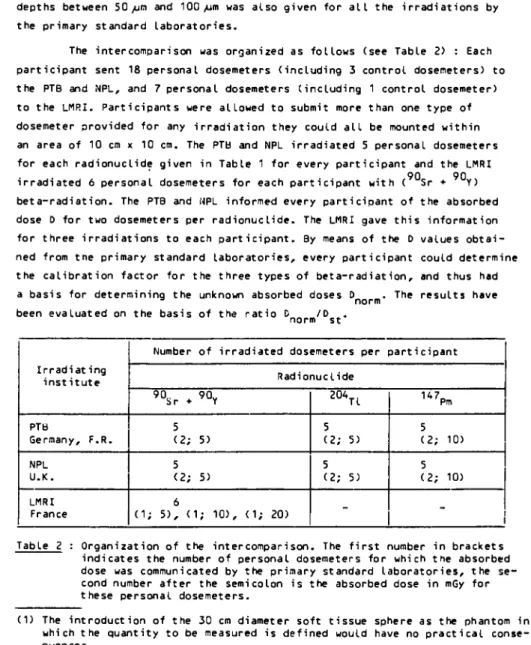
The intercomparison was organized as follows (see Table 2) : Each participant sent 18 personal dosemeters (including 3 control dosemeters) to the PTB and NPL, and 7 personal dosemeters (including 1 control dosemeter) to the LMRI. Participants were allowed to submit more than one type of dosemeter provided for any irradiation they could all be mounted within an area of 10 cm χ 10 cm. The PTB and NPL irradiated 5 personal dosemeters for each radionuclide given in Table 1 for every participant and the LMRI
90 90 irradiated 6 personal dosemeters for each participant with ( Sr + Y) beta-radiation. The PTB and NPL informed every participant of the absorbed dose D for two dosemeters per radionuclide. The LMRI gave this information for three irradiations to each participant. By means of the D values obtai ned from tne primary standard laboratories, every participant could determine the calibration factor for the three types of beta-radiation, and thus had a basis for determining the unknown absorbed doses D . The results have
norm been evaluated on the basis of the ratio D /D ^.
norm st
I r r a d i a t i n g i n s t i t u t e
PTB Germany, F.R. NPL U.K. LMRI France
Number of i r r a d i a t e d dosemeters per aart i cipant
Radionuclide 9 0 .Sr + Y x 90v
5 ( 2 ; 5)
5 ( 2 ; 5)
6
( 1 ; 5 ) , ( 1 ; 1 0 ) , ( 1 ; 20)
2 0 4n
5 ( 2 ; 5)
5 ( 2 ; 5)
-Pm
5 ( 2 ; 10)
5 ( 2 ; 10)
-Table 2 : Organization of the intercomparison. The first number in brackets indicates the number of personal dosemeters for which the absorbed dose was communicated by the primary standard laboratories, the se cond number after the semicolon is the absorbed dose in mGy for these personal dosemeters.
3 .
1 1
-DESCRIPTION OF THE BETA PERSONAL DOSBIETER IRRADIATIONS AT LMRI, NPL AND PTB
M. CANCE
Laboratoire de Métrologie des Rayonnements I o n i s a n t s , G i f - s u r - Y v e t t e 3 . OWEN
National Physical Laboratory, Teddington J . BÖHM
Physikalisch-Technische Bundesanstalt, Braunschweig
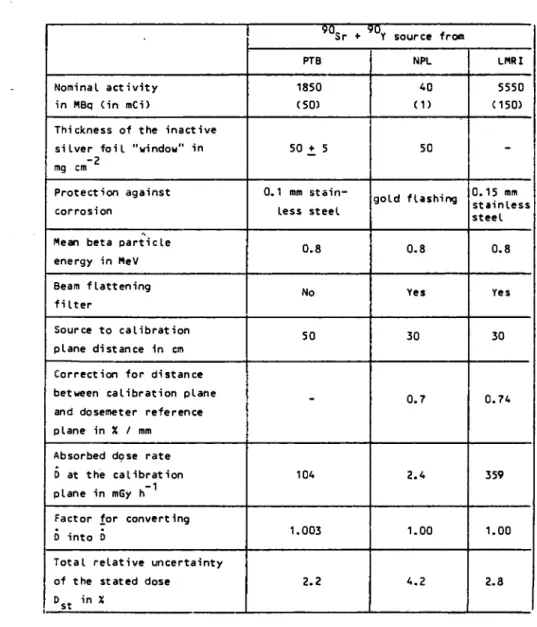
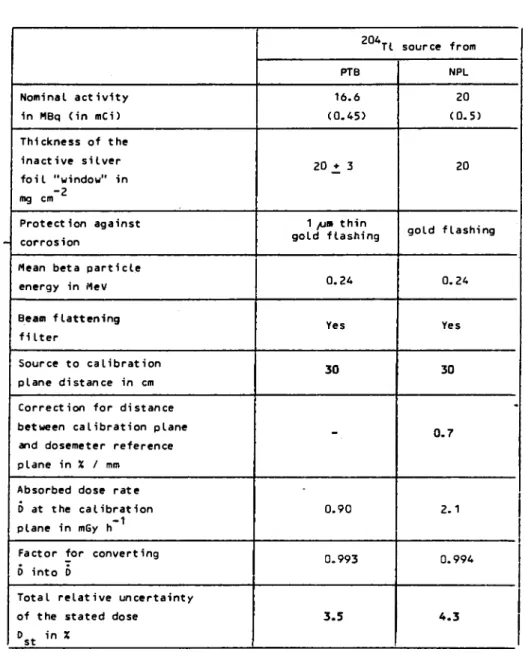
The schematic arrangement for the i r r a d i a t i o n s at each laboratory is shown i n Fig 1 . , d e t a i l s of the radionuclide sources and the absorbed dose r a t e s at the c a l i b r a t i o n planes are given i n Tables 1 , 2 and 3 .
Each laboratory measured for each i r r a d i a t i n g source the absorbed dose r a t e to t i s s u e at the c a l i b r a t i o n plane using i t s primary standard; the LMRI and PTB standards are a i r - f i l l e d e x t r a p o l a t i o n i o n i z a t i o n chambers in s e m i - i n i f i t e t i s s u e - e q u i v a l e n t phantoms (Böhm, 1976) and measure d i r e c t l y the absorbed dose to t i s s u e . The NPL standard is a p a r a l l e l - p l a t e i o n i z a t i o n chamber in which a r e l a t i v e l y large volume of a i r i s defined by a t h i n p l a s t i c f i l m e l e c t r o d e system (Owen, 1 9 7 2 ) . The standard measured absorbed dose to a i r and conversion f a c t o r s are necessary t o d e r i v e absorbed dose t o t i s s u e (BCRU, 1 9 7 7 ) . The absorbed dose to t i s s u e was s p e c i f i e d at two depths, at 7 mg en (5) and·averaged between 5 and 10 mg cm (D) below the t i s s u e s u r f a c e . Independent intercomparisons between LMRI and PTB, and PTB and NPL have shown t h a t agreement between the i r r a d i a t i n g l a b o r a t o r i e s for absorbed dose to t i s s u e measurements i s about 13Í for Sr + Y - 9 0 , 25! for T l - 2 0 4 and 7% for Pm-147.
As shown in Fig 1 , most sources were used with b e a m - f l a t t e n i n g f i l t e r s to produce an area of uniform dose r a t e about 7 cm i n radius at the c a l i b r a t i o n p l a n e . The same f i l t e r constructions were used by a l l t h r e e l a b o r a t o r i e s ; the f i l t e r m a t e r i a l was polyethylene t e r e p h t h a l a t e ( M e l i n e x , M y l a r , Hostaphan).
Sr + Y-90 3 concentric discs each 25 mg cm thick and r a d i i of 2 , 3 and 5 cm
TL-204 2 concentric discs one 25 mg cm t h i c k , 2.75 cm radius and one 7 mg cm thick and 4 cm radius
-12-The dosemeters were placed on a 1 cm thick methylmethacrylate sheet (Perspex, Lucite, Plexiglas). The doseneters were irradiated singly at LMRI, confined within a 5 cm radius of the source axis at PTB and within a 7 cm radius at NPL. The dose uniformity within the restricted areas at NPL and PTB was assessed as better than +_ 4ii. The dosemeters were separated by at least 1 cm at NPL and 0.5 cm at PTB. The irradiation times varied from 1 min to several days.
The primary standard measurements required several corrections to
derive the dose given to the dose'aeters; radioactive decay for the tine between the measurement and the irraaiaticn, corrections for changes from the measurement conditions in the air path aensity cet«een the source and the dosemeter, and corrections for tne distance setween the calibration plane and the dosemeter reference plane. The air path censity changes were most significant in altering the attenuation of low energy beta radiation, the corrections for Pm-147 being typically 10%. At the PTB the dosemeter reference plane was adjusted to be at the calibration Diane and no correc-tions were necessary; at LMRI and NPL correccorrec-tions were applied being a maximum of about 2ÛK for Pm-147 irradiations of the thickest dosemeters.
The total uncertainty, at the 95X confidence level, of the stated dose delivered to a dosemeter was the root of the quadratic sum of the statis-tical and systematic uncertainties due to the primary standard measurement of the source dose rate, the irradiation of the dosemeter and the correction and
conversion factors. The total uncertainties are given in Tables 1, 2 and 3. The majority of dosemeters were sent through the post; the NPL and PTB irradiations took place during February-March 1979 and the LMRI irra-diations in early June. The doseneters were returned to the participants as soon as possible after irradiation together with the unirradiated con-trol dosemeters whose purpose was to record any unintentional irradiation for example in the post.
The irradiation of the personal dosemeters in the PTB was performed with a commercially available beta-ray secondary standard, the prototype of which was developed in the PTB as illustrated in Fig 2 (Böhm, 1979).
13
shutter, 11 ms were needed for closing the shutter. The relative uncertain 4
ty of the irradiation time was (10 + 0.005/t), with t in seconds. A diagram of the calibration and irradiation equipment used at LMRI is shown in Fig 3. The 1 cm perspex sheet which formed the base and calibration plane for the dosemeters being irradiated was supported on the front window F of the extrapolation chamber.
A diagramatic representation of the source and beamflattening filter in use for irradiation of dosemeters in NPL is shown in Fig 4.
REFERENCES
BCRU
Further Discussion on the Conversion of BetaRay Dose Rates Measured i n A i r t o Dose Rates i n S k i n . Phys. Med. B i o l . _22 101103 ( 1 9 7 7 ) .
J Böhm, Ρ H i l l i o n , J Ρ Simoen
Intercomparison of t h e PTB and LMRI standards i n beta d o s i m e t r y . 8ème congrès i n t e r n a t i o n a l de l a s o c i é t é f r a n ç a i s e de r a d i o p r o t e c t i o n ( 1 9 7 6 ) . J Böhm
Sekundarnormal f ü r d i e Energiedosis durch 8 e t a s t r a h l u n g i n Gewebe. PTBJahresbericht 1978; p . 193 ( 1 9 7 9 ) .
Β Owen
-14-Nominal activity in M8q (in nCi)
Thickness of the inactive silver foil "window" in
-2 mg cm
Protection against corrosion
Mean beta particle energy in MeV Beam flattening filter
Source to calibration plane distance in cm Correction for distance between calibration plane and dosemeter reference plane in X / mm
Absorbed dose rate D at the calibration plane in mGy h Factor for converting D into D
Total relative uncertainty of the stated dose
Ds t in X
ar + Y source from PTB
1850 (50)
50 _+ 5
0.1 mm stain-less steel 0.8 No 50
-104 1.003 2.2 NPL 40 (1) 50 gold flashing 0.8 Yes 30 0.7 2.4 1.00 4.2 LMRI 5550 (150) -0.15 mm stainless steel 0.8 Yes 30 0.74 359 1.00 2.8 90 90
-15-Nominal a c t i v i t y i n MBq ( i n mCi) Thickness of t h e i n a c t i v e s i l v e r f o i l "window" i n mg cm
P r o t e c t i o n a g a i n s t c o r r o s i o n
Mean beta p a r t i c l e energy i n MeV
Beam f l a t t e n i n g f i l t e r
Source t o c a l i b r a t i o n plane d i s t a n c e in cm C o r r e c t i o n f o r d i s t a n c e between c a l i b r a t i o n p l a n e and dosemeter r e f e r e n c e p l a n e i n X 1 mm
Absorbed dose r a t e D at the c a l i b r a t i o n plane i n mGy h
Factor f o r c o n v e r t i n g D i n t o D
T o t a l r e l a t i v e u n c e r t a i n t y of the s t a t e d dose
Ds t i n X
204
T l source from PTB
1 6 . 6 ( 0 . 4 5 )
20 + 3
1 /U» t h i n g o l d f l a s h i n g
0 . 2 4
Yes
30
-0 . 9 -0
0 . 9 9 3
3 . 5
NPL 20 ( 0 . 5 )
20
g o l d f l a s h i n g
0 . 2 4
Yes
30
0 . 7
2 . 1
0 . 9 9 4
4 . 3
-16-Nominal a c t i v i t y in MBq ( i n mCi)
Thickness of the i n a c t i v e s i l v e r f o i l "window" in mg cm
Protection against corrosion
Mean beta p a r t i c l e energy in MeV
Beam f l a t t e n i n g f i l t e r
Source to c a l i b r a t i o n plane distance in cm
Correction for distance between c a l i b r a t i o n plane and doseneter reference
plane in .'. 1 mm
Absorbed dose r a t e D at the c a l i b r a t i o n olane in mGy h
Factor for converting
6 into δ
T o t a l r e l a t i v e uncer t a i n t y of the stated dose 0 in X
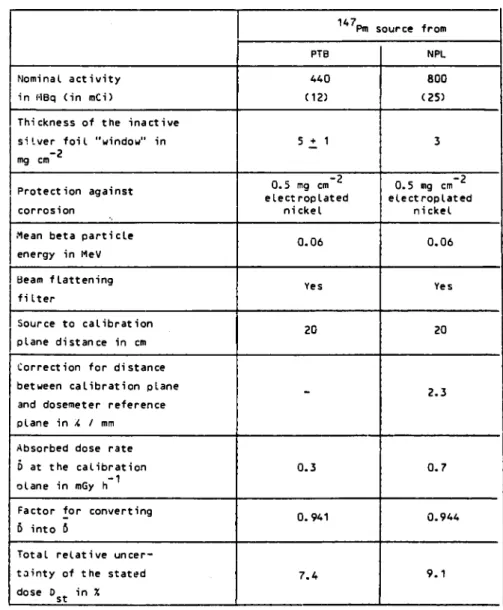
147„_
Pm source from PTB
440 (12)
5 + 1
0.5 mg cm e l e c t r o p l a t e d
n i c k e l
0.06 Yes 20
-0.3 0.941 7.4 NPL 800 (25) 3
0.5 mg cm e l e c t r o p l a t e d
n i c k e l
0 . 0 6
Yes
20
2.3
0 . 7
0.944
9 . 1
147
-17-τ
Γ
ΙΟ
cm
2 0 - 5 0 cm
L Z Z I -
Source
jT
Beam flattening filter
(when used)
Dosemeter
Dosemeter reference plane
Calibration plane
-18-Figure 2; Components of the beta-ray secondary standard.
Left: Control unit for remote operation of the shutter and for digital preselection of the irradiation time.
Middle: Jig for ß-source support with shutter and beam flattening filter.
-19-Fiqure 3
LMRI variable cavity ionization chamber
A nicrometic device to measure the distance between the source «id the reference plaie
Β beam flattening f i l t e r C collection e l
D connection to electrome E source support F front window
G micrometic device to measure displa cement of front-window
-20-1cm thick perspex —ι
Beta source
ι—Perspex jig
- Beam flattening filter
Dosemeter
2 1
-COMMENTS BY PARTICIPANTS
( a ) Ç2!!!DͧSâCÍit_ã_illQgCaÍg_*t2EÍgySx_£2QfSQiï:âyïz52SêI " £¿_§É5í!*ÍÍN
Our measurements were c a r r i e d out w i t h t h r e e types of dosemeters : - f i l m s i n m u l t i f i l t e r badges f o r personal d o s i m e t r y ;
- l i t h i u m f l u o r i d e p e l l e t s as used f o r personal d o s i m e t r y ; - thermoluminescent l i t h i u m b o r a t e , which i s s t i l l i n the e x p e r i
mental s t a g e .
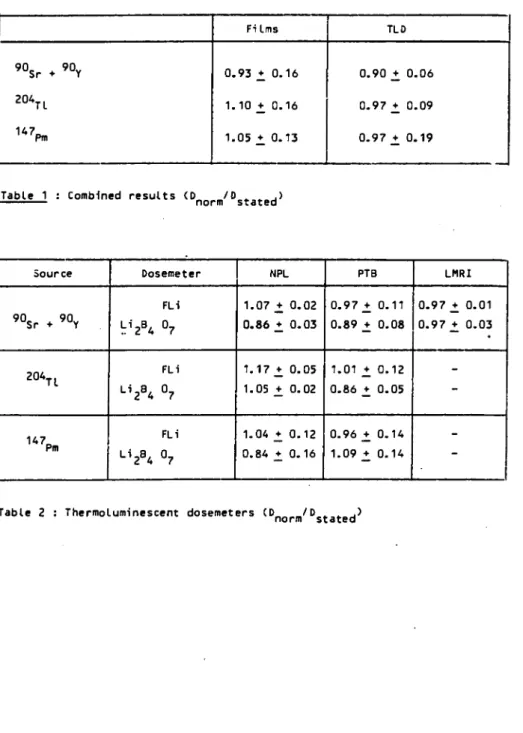
Table 1 shows the r e s u l t s o b t a i n e d , as compared with the s t a t e d doses, both f o r the f i l m dosemeters and the thermoluminescent dosemeters. On the whole t h e r e was close agreement which concealed a number of d i s p a r i t i e s d e t a i l e d below.
1) Response of the thermoluminescent dosemeters
Frequently the two types of thermoluminescent dosemeters g i v e s y s t e m a t i c a l l y d i f f e r e n t r e s u l t s ( T a b l e 2 ) .
N.B. The r e s u l t s supplied t o the CEC correspond to the sum of the l i t h i u m f l u o r i d e and l i t h i u m borate r e s u l t s .
For the same beta source the same type of dosemeter sometimes g i v e s s y s t e m a t i c a l l y d i f f e r e n t r e s u l t s depending on the i r r a d i a t i n g l a b o r a t o r y : e . g . 204 T l ^ » 1.2 ( c f . Table 2)
2) Beta response of the film dosemeter under PSI
Firstly it should be noted that this type of dosemeter is mainly used to measure penetrating radiation (X-rays, gamma rays, thermal neutrons) with a view to monitoring whole body irradiation.
In fact the dosemeter is very badly suited to measuring beta radia-tion, mainly because of the casing covering the film and the dosemeter
it-<· 2 147
self ( - 20 mg/cm ) . Measurement of Pm irradiation was possible only via the associated X-rays.
-22-emulsion facing the source has a higher sensitivity than the -22-emulsion placed behind it (Table 3 ) .
Very probably, a further factor is involved. The response of a given emulsion varies significantly with the irradiation laboratory for
204 147
the low-energy beta sources Tl and Pm (Table 4 ) . This variation indi-cates that the sensitivity is dependent to some extent on the spectrum of these sources and on the contribution of the associated bremsstrahlung.
For all these reasons the results we'have given have had to be normalized using the results obtained with dosemeters irradiated with known doses. In fact, as regards the film dosemeter, the main value of this inter-comparison is no doubt that it improves our knowledge of its response to beta radiation and that it has shown us how unreliable it is for energy sources lower than 1 MeV.
CONCLUSION
Present practice is to evaluate beta doses on the basis of calibra-tion via gamma rays from a Co source, possibly corrected by a factor eva-luated once and for all on the basis of irradiation by beta rays from a
9 0Sr + 9 0Y source.
This intercomparison has shown us the limits of precision which can be obtained even when using specific calibrations carried out with beta sources identical to the irradiation sources. Table 5 shows the coefficients used to compute the beta doses from the responses of the thermoluminescent dosemeters, expressed as a function of calibration by gamma rays from a
Co source (0 ) . These coefficients were obtained from the known intercom-ap parison doses. They were found to be constant and close to 1 for beta
radia-90 radia-90
23
9 0Sr ♦ 90Y 2 0 4τ ι
U 7Pm
Fi Ims
0.93 ♦ 0.16
1.10 _+ 0.16
1.05 + 0.13
TLD
0.90+^ 0.06
0.97 + 0.09
0.97 _+ 0.19
Table 1 : Combined results (0 /D .,. .) norm stated
Source
9 0Sr ♦ 90Y
2 0 4n
U 7P .
Dosemeter
FL i
b
12
B4 °7
FL i
L i284 °7
FL i
L Í2B4 °7
NPL
1.07 + 0.02 0.86 _+ 0.03
1.17 + 0.05 1.05 + 0.02
1.04 ♦ 0.12 0.84 ♦ 0.16
PTB
0.97 ± 0.11 0.89 _+ 0.08
1.01 _+ 0.12 0.86 + 0.05
0.96 ♦ 0.14 1.09 +_ 0.14
LMRI
0.97 + 0.01 0.97 + 0.03
24
1st emulsion 2nd emulsion
NPL 1.45 + 0 . 1 2 0 . 8 2 ± 0 . 0 7
PTB 1.71 _* 0 . 2 5 0 . 6 7 + 0 . 0 9
LMRI 1 . 6 0 0 . 8 8 ♦ 0 . 0 9
CEN G 1 . 2 7 _+ 0 . 0 9 0 . 7 5 ♦ 0 . 0 8
90 90
Table 3 : Response of the film dosemeter to beta radiation from Sr + Y; (D . . D.,)
C window Al)
stated
o0r
N.B. The responses are expressed in terms of a calibration by a Co gamma source (D, ) .
ap
2 0 4n U 7P m
NPL 0 . 4 1 _+ 0.04 0 . 1 3 + 0 . 0 2
PTB 0 . 5 3 ♦ 0 . 0 8 0 . 3 0 + 0 . 0 4
Table 4 : Response of t h e f i r s t emulsion of the f i l m dosemeter (D /D .) ap s t a t e d
Source 9 0S r ♦ 9 0Y
2 0 4n
U 7P m
Dosemeter FL i L i2B4 ° 7
FL i L i2S4 ° 7
FL i L i2B4 ° 7
NPL 1.04 1.07
3 . 6 3 3 . 2 2
3 0 . 4 10.0
PTB 1.09 1.07
3 . 3 1 2 . 5 2
14.7 14.3
LMRI 1.05 1.00
Table 5 : C a l i b r a t i o n c o e f f i c i e n t s determined on the b a s i s of the known doses (D „ ,/D )
-25-4. COMMENTS BY PARTICIPANTS
(b) £ΙΑ_:_ί§ηΐΓβ_α1Εΐυαβ§_Νυ£ΐέ§Ϊ£:β§Λ_6Γβηο2ΐβ - ïi.üËBëayT
Our measurements were c a r r i e d out w i t h f o u r types of dosemeter : m u l t i s c r e e n f i l m d o s e n e t e r ;
t h r e e t y p e s of l i t h i u m f l u o r i d e t h e r n o l u n i n e s c e n t dosemeters of d i f f e r e n t t h i c k n e s s e s ( f r o m 30 mg.cn t o 230 mg.cm ) .
T h i s i n t e r c o m p a r i s o n e n a b l e d us t o e v a l u a t e the r e p r o d u c i b i l i t y and t h e response o f t h e s e dosemeters i n respect o f t h e d i f f e r e n t beta r a d i a t i o n e n e r g i e s .
The r e s u l t s a r e p r e s e n t e d i n Tables 1 and 2. D r e p r e s e n t s t h e 60, ap
dosemeter r e a d i n g f o r dosemeters c a l i b r a t e d w i t h a Co photon s o u r c e . The f i l m s and t h e thermoluminescent dosemeter t y p e s 1 and 3 cannot
147
measure beta r a d i a t i o n from a Pm source as t h e y are t o o t h i c k .
I n t h e case of t h e t y p e 2 thermoluminescent d o s e m e t e r , t h e measure 147
ment u n c e r t a i n t i e s f o r Pm a r e v e r y high because of the e f f e c t s of the v a r i a t i o n of dosemeter t h i c k n e s s on dosometer response t o lowenergy beta r a d i at i o n .
Source
9 0S r ♦ 9 0Y 2 0 4n
U 7P m
Film
0 . 9 7 _+ 0 . 0 5
0 . 9 5 + 0 . 0 9
TLD type 1
0 . 9 3 + 0 . 0 9
0 . 9 9 + 0 . 0 6
TLD t y p e 2
1.03 _+ 0 . 0 6
1.03 + 0 . 1 3
0 . 9 6 + 0 . 2 8
TLD t y p e 3
0 . 9 4 + 0 . 1 5
1.02 + 0 . 1 4
Table 1 : D st
26
Source
9 0Sr ♦ 90Y
2 0 4n
147Pm
TLD type 1
0.97 _+ 0.1
0.30 .+ 0.01
TLD type 2
0.94 _+ 0.03
0.80 + 0.10
0.08 ♦ 0.02
27
4 . COMMENTS BY PARTICIPANTS
( c ) £í£E_§££!S£Í£X_IÍ!¿£Í£3£_¿Jbi2I5l£L'Í£5 " I¿íliSi_THOMPSON
Assessment o f t h e b e t a doses f r o n t h e f i l m s are nade using t h e f o l l o w i n g e q u a t i o n :
D = F ( O P ) where 0 i s t h e apparent dose i n t h e "open window"
D
and Ρ i s t h e apparent dose i n t h e " p l a s t i c f i l t e r " ( 3 0 0 mg.cm"2)
F i s t h e energy c o r r e c t i o n f a c t o r whose v a l u e depends on t h e r a t i o R where
0P
R = pyTp where PW i s t h e apparent dose i n t h e " p l a s t i c window" ( 5 0 mg.cn ) The r e l a t i o n s h i p between F and R i s determined from t h e d a t a and graph i n BCS 0 8 2 1 , 1977 ( * ) , d e t a i l s of which a r e a t t a c h e d . During r o u t i n e e s t i m a t i o n s o f b e t a doses t h i s graph i s d e s c r i b e d by a q u a d r a t i c r e l a t i o n s h i p , except when R < 2 . 2 when F i s taken t o e q u a l 1 . 0 5 . The o r i g i n a l
90 9 0
D r e s u l t s f o r t h e S r / Y i r r a d i a t i o n s have been c a l c u l a t e d using t h i s v a l u e o f F, i . e . as per t h e B r i t i s h C a l i b r a t i o n S e r v i c e recommenda
90 9 0
t i o n s . For t h e S r / Y i r r a d i a t i o n s R had a mean v a l u e o f 1.03 f o r t h e NPL i r r a d i a t i o n s , 1.04 f o r t h e PTB i r r a d i a t i o n s and 1.11 f o r t h e LMRI i r r a d i a t i o n s . The BCS c u r v e , f o r t h e combined e m u l s i o n s , shown i n t h e a t t a c h e d notes i s o n l y p l o t t e d f o r R v a l u e s exceeding 1 . 3 . I f t h i s curve i s e x t r a p o l a t e d back t o t h e above t h r e e v a l u e s o f R then new v a l u e s of F a r e o b t a i ned which have a higher v a l u e than 1 . 0 5 .
90 90
For t h e S r / Y i r r a d i a t i o n s t h e s e higher F f a c t o r s have been used t o c a l c u l a t e new v a l u e s o f t h e d o s e , D and t h e s e are l i s t e d
' e v a , n e w , below t o g e t h e r w i t h t h e o r i g i n a l e s t i m a t e s D
3 eva
Further, it should be noted that the BCS data assumes that the badge is irradiated at 35° whereas the intercomparison was performed at normal, i.e. 0 ° , incidence.
-28· Irradiation Lab NPL PTB LMRI „ Absorbed doses at 7 mg/ err ,nGy
Dst 4.95 4.95 2.47 49.5 21.0 5 5 2.4 16 IOC
D eva
3.4 3.3 1.7
-16.2 5.5 5.6 3.5 12.3 130 D eva,new 4.56 4.48 2.37 -21.6 7.27 7.52 4.6 16.3-6.2 3.3 4.¿8 10.5 6.6 e.3o 21.0 Films damageo on receipt
(when arrived at BNL they were already damaged)
It was thought that the inconsistent results for the PTB irradiation compared with LMRI and NPL might be due to the different irradiation conditions used at the PTB, this could result in the beta spectrum having
-29-BETA RADIATION 0.5 TO 3.5 MeV Burt, AK and Smith, JW Film dosimetry
with the AERE/RPS film holder UKAEA report 6156, 1972
Dose equivalent in rens = F I DQ p e n - Dt M
The factor F is related to the ratio R, where
]
R = open thick
thin thick
The relation between F and R is given in Figure 1 and nay be described by the quadratic
F = A + BR + CR2
over the range 2.2 < R < 7 . 0 , where A = 0 . 0 7 0 , Β = 0 . 5 1 0 , C = - 0 . 0 2 9
O Slow emubion, Estar bise • Fast emulsion,, Estar base
— — Combined emulsion, Actate base (Adams ti al - Reference 4) — — — Suggested approximation(Adams el al- Reference 4)
tí
O
d
<
u. Z O tu
tí. tí
SLOW EMULSION
COMBINED EMULSION
3 1
4 . COMMENTS BY PARTICIPANTS
( d ) K e r n f g r s ç h u n a s a n i a g ei_ J u i i ç h M¿_HJINZELMANN
DOSEMETER EVALUATION AMD RESULT
The beta dosemeter i n t e r c o m p a r i s o n programme o f t h e Commission o f t h e European Communities was implemented at a t i n e when t h e H e a l t h Physics D i v i s i o n o f t h e J ü l i c h N u c l e a r Research Centre s t a r t e d t e s t s f o r d e t e r n i n i n g t h e dose o f beta r a d i a t i o n using TLD. We were t h e r e f o r e p l e a s e d , on t h e one h a n d , t o be a b l e t o p a r t i c i p a t e i n an i n t e r n a t i o n a l comparison programme ^_at such an e a r l y s t a g e w h i l e , on t h e o t h e r h a n d , we had g a t h e r e d l i t t l e
e x p e r i e n c e y e t w i t h beta d o s i m e t r y using TLD.
For our e x p e r i m e n t s , we used TLD100 ribbons o f t h e s i z e 0 . 1 2 5 " χ 0 . 1 2 5 " χ 0 . 0 1 5 " . The response o f t h e s e dosemeters t o b e t a r a d i a t i o n i s known t o depend on t h e energy of r a d i a t i o n . S i n c e , however, our aim i s t o a r r i v e at a p o s s i b l y e n e r g y i n d e p e n d e n t dose d e t e r m i n a t i o n , we t r i e d t o o b t a i n a d d i t i o n a l i n f o r m a t i o n about t h e r a d i a t i o n f i e l d by using s e v e r a l TLD's i n one d o s e m e t e r . For our i n i t i a l e x p e r i n e n t s , we used t h r e e TLD's arranged b e h i n d one a n o t h e r and covered w i t h a f o i l of 1 mg/cm ( F i g . 1 ) . From t h e r e a d i n g s of t h e s e t h r e e T L D ' s , we wanted t o g a i n i n f o r m a t i o n about t h e energy o f beta r a d i a t i o n . Our measurements r e v e a l e d t h a t t h e t h i r d TLD v i r t u a l l y d i d not p r o v i d e any a d d i t i o n a l i n f o r m a t i o n on t h e r a d i a t i o n f i e l d , so t h a t we o n l y used t h e r e a d i n g s D. and D_ o f t h e f i r s t two TLD's f o r our dosemeter e v a l u a t i o n .
32
r e s u l t s had been sent t o Euratom. The r e s u l t s according t o our own c a l i b r a t i o n were about 13% higher than the values of NPL f o r the S r 9 0 i r r a d i a t i o n , about 6% higher than t h e v a l u e s o f LMRI f o r t h e S r 9 0 i r r a d i a t i o n and about 15% lower than t h e v a l u e s of NPL f o r the Pm147 i r r a d i a t i o n .
Among our r e s u l t s , two v a l u e s d e v i a t e d s u b s t a n t i a l l y from t h e a c t u a l v a l u e . However, t h e s e were due t o computational e r r o r s i n e v a l u a t i o n . The dosemeters had i n d i c a t e d t h e dose c o r r e c t l y . A f t e r c o r r e c t i o n o f t h e s e v a
l u e s , our r e s u l t s d i f f e r by not more than _+ 5% from t h e a c t u a l v a l u e i n 57% of t h e cases. For 29% of t h e r e s u l t s , t h e d e v i a t i o n f r o n t h e a c t u a l value was between + 5% and _♦ 10%, and only f o r 14% was t h e d e v i a t i o n h i g h e r . The maxinun d e v i a t i o n from t h e a c t u a l value amounted t o 20%. I n view of t h e f a c t t h a t t h i s i s a f i r s t i n t e r c o m p a r i s o n , we a r e s a t i s f i e d w i t h our r e s u l t s .
DISCUSSION
The r e s u l t s of dosemeters i r r a d i a t e d by PTB under the i n t e r c o m p a r i son programme d i d not have t o be c o r r e c t e d a f t e r e v a l u a t i o n w i t h t h e a i d of our own c a l i b r a t i o n . T h i s was to be e x p e c t e d , since we use t h e secondary standard developed by PT3 f o r our c a l i b r a t i o n s . The r e s u l t s of dosemeters i r r a d i a t e d w i t h Pm147 at the NPL had to be c o r r e c t e d by 15% on account o f t h e r e s u l t s o b t a i n e d f o r dosemeters i r r a d i a t e d w i t h known doses. According t o Owen, t h e p r e l i m i n a r y r e s u l t s of t h e NPLPTB i n t e r c o m p a r i s o n d i f f e r by 8% f o r t h e Pm147 source. Our c o r r e c t i o n was twice as high as t h e d i f f e r e n ces in t h e NPLPTB i n t e r c o m p a r i s o n . The reason f o r the requirement o f a c o r r e c t i o n o f our r e s u l t s f o r t h e S r 9 0 i r r a d i a t i o n s at NPL and LMRI i s not known. Perhaps, t h e depth doses d i s t r i b u t i o n f o r i r r a d i a t i o n s at t h e S r 9 0 source of NPL and LMRI d i f f e r s from t h a t at t h e S r 9 0 source of PTB.
-33-These d i f f e r e n c e s in weight i n f l u e n c e tne dosemeter s e n s i t i v i t y and, i n p a r t i c u l a r , t h e r a t i o D. : D, of the readings of two dosemeters arranged behind each other during i r r a d i a t i o n . I f , f o r i n s t a n c e , two TLD's are a r r a n ged behind each other and i r r a d i a t e d in f r o n t of the T l - 2 0 4 source ( F i g 2 ) , the r a t i o of the readings D. : D. i s 5.9 when t h e f i r s t TLD weighs 9 . 1 mg and the second TLD 8 . 1 mg. However, the r a t i o D. : D. i s only 4 . 2 when t h e f i r s t TLD weighs 8 . 2 mg and the second TLD 9 . 1 mg.
FURTHER RESULTS WITH DOSEMETERS CONTAINING SEVERAL TLD's
As mentioned above, we only s t a r t e d w i t h our t e s t s on beta d o s i metry w i t h TLD's at the time of the intercomparison programme, and i n the f o l l o w i n g , we w i l l b r i e f l y r e p o r t on the experience with and advancement of our dosemeters. From the r a t i o of t h e readings D. : D- of the two TLD's i n
2 the dosemeter and from the value of D . , the dose in t i s s u e at 7 mg/cm depth can be c l e a r l y determined f o r r a d i a t i o n of the n u c l i d e s Pm-147, T l - 2 0 4 and Si—90 ( F i g 3 ) . However, a dosemeter should not only be s u i t a b l e f o r these n u c l i d e s , but a l s o f o r more g e n e r a l a p p l i c a t i o n , f o r instance a l s o in mixed beta-gamma r a d i a t i o n f i e l d s . As the response of TLD's to gamma-r a d i a t i o n i s known, the gamma-r a t i o s D„ : D. (D_ = dose in t i s s u e at 7 mg/cm depth) and D. : D, can be c a l c u l a t e d f o r mixed r a d i a t i o n f i e l d s composed of ganma- and Τ Ι - 2 0 4 - b e t a - r a d i a t i o n , gamma- and P m - 1 4 7 - b e t a - r a d i a t i o n , as u e l l as T l - 2 0 4 and P n - 1 4 7 - b e t a - r a d i a t i o n . The r e s u l t s of these c a l c u l a t i o n s are shown in F.ig 3 , and i t may be seen t h a t a value of a r a t i o D1 : D may be a s s o c i a t e d w i t h two very d i f f e r e n t values of D_ : D . . This
means t h a t , i n unknown r a d i a t i o n f i e l d s , the r a t i o D. : D, can no longer be used to c l e a r l y determine the 3ose. The dosemeters used f o r the intercompa r i s o n programme are not s u i t e q in nixed r a d i a t i o n f i e l d s .
For f u r t h e r e x p e r i m e n t s , we arranged the TLD's side by side ( F i g 4) and added a t h i n absorber in f r o n t of one of the T L D ' s . The r e s u l t s of measurements w i t h these dosemeters on beta e m i t t e r s of t h e secondary standard and c a l c u l a t i o n s f o r mixed r a d i a t i o n f i e l d s are shown i n Fig 5. For these dosemeters, a value of D. : D i s only a s s o c i a t e d i n a f i r s t approximation
t o one value of DQ : D.. Such a dosemeter would be s u i t e d f o r measurements
in the mixed r a d i a t i o n f i e l d s considered t o d a t e .
34did not carry out c a l c u l a t i o n s f o r mixed r a d i a t i o n f i e l d s w i t h C 1 4 b e t a -r a d i a t i o n . Howeve-r, i t i s obvious t h a t a value of 0 . : 0 . w i l l no longe-r be associated w i t h only one value of D. : D. when considering C 1 4 b e t a r a d i a -t i o n .
The reason why the r a t i o DQ : D. f o r C - 1 4 - b e t a - r a d i a t i o n i s smaller than the corresponding r a t i o f o r Pm-147-beta r a d i a t i o n may be e a s i l y e x p l a i n e d . The absorber f o i l in f r o n t of the f i r s t TLD is only 1 mg/cm t h i c k . Between 1 and 7 mg/cm , C-14-beta r a d i a t i o n i s attenuated considerably more than Pm-147-beta r a d i a t i o n , so t h a t t h e r e i s a higher resoonse of the dose-meter t o C-14-beta r a d i a t i o n f o r doses in t i s s u e at 7 mg/cm deoth.
TLD1 TLD1
1 mg/cm
-or·»
•§r-
u
¡f TLD 1 has a mass of 9.1 mg and TLD 2 has a mass of 8.1 mg
if TLD 1 has a mass of 8.2 mg andTLD2 has a mass of 9.2 mg
Fig.2: Ratio of dosimeter readings for different masses of the dosimeters
TLD 2
TLD 3
1 mg/cm
Rg.1:Construction of the dosimeter
-36-D/
3-
2-
1--r—
15
Fig.3'
Calibration factor in mixed radiation fields as function of
i ¡5
the ratio Ly
Ώ
22 TLD behind one another
D
0= Absorbed dose in tissue at 7mg/cm'
D, = Reading of the first TLD
CL= Reading of the second TLD
-37-TLD1
TLD2
2
1 mgfcm 6,4 mg/cm
Fig.A:New construction of the dosimeter
TLD 1 reading D;
38
* l
3
2
Pm-H7
<K
C-UTl-204
—τ— t —
5
1
2
3
4
5
è
Fig.5:Coiibration factor in mixed radiation fields as function of
the ratio CL:
D
22 TLD side by side
Dj= Absorbed dose in tissue at 7 m g / c m
2D
;= Reading of TLD1 behind an absorber of 1 mg/cm
D^s Reading of TLD 2 behind an absorber of 7mg/cm*
39
COMMENTS BY PARTICIPANTS
( e ) rjU£isaC_3£5SâC£!î_ÇeOtCSx_KaCÎSCUÎ!e B._eURgKHARDT
INTRODUCTION
The K a r l s r u h e N u c l e a r Research C e n t r e p a r t i c i p a t e d i n t h e European i n t e r c o m p a r i s o n experiment 1 9 7 9 / 1 9 8 0 ( B e t a D o s i m e t r y ) . The TLD 700
dosemeters have been c a l i b r a t e d at K a r l s r u h e by using a b e t a s e c o n d a r y 90 90 s t a n d a r d manufactured by B u c h l e r . The b e t a r a y f i e l d s of two ( Sr + Y) sources o f d i f f e r e n t a c t i v i t i e s had been c a l i b r a t e d by t h e PTB by means of an e x t r a p o l a t i o n chamber as t h e primary s t a n d a r d . On t h e b a s i s of t h e c e r t i f i c a t e d b e t a d o s e a t s e v e r a l d i s t a n c e s from t h e s o u r c e s , t h e c a l i b r a t i o n o f t h e same TLD d e t e c t o r s r e s u l t e d i n response f a c t o r s which d i f f e r e d by more than 10%. Taking i n t o account t h e known t r a n s m i s s i o n f a c t o r s o f t h e b e t a s o u r c e s i n a s u i t a b l e way, t h i s s y s t e m a t i c a l u n c e r t a i n t y can be reduced s i g n i f i c a n t l y .
EXPERIMENT
Li F dosemeter chips of t h e s i z e o f 3 χ 3 χ 0 . 2 mm and
3 χ 3 χ 0 . 9 mm have been i r r a d i a t e d on t h e s u r f a c e of a t i s s u e e q u i v a l e n t phantom t o an absorbed dose o f 25 mGy a c c o r d i n g t o t h e s t a n d a r d c a l i b r a t i o n procedure of t h e b e t a s e c o n d a r y s t a n d a r d . The i r r a d i a t i o n o f t h e b a r e d o s e meter has been performed i n a v e r t i c a l p o s i t i o n o f t h e secondary s t a n d a r d w i t h o u t any dosemeter support or a d d i t i o n a l c o v e r s .
For t h e b e t a c a l i b r a t i o n TLD batches of 5 chips have been u s e d . I n 137
a d d i t i o n , 5 TLD chips have been i r r a d i a t e d w i t h Cs gammaray t o an e x p o s u r e o f 2 . 5 Reabsorbed dose i n s o f t t i s s u e o f 2 3 . 7 5 mGy). The dosemeters have been e v a l u a t e d t o g e t h e r by p l a c i n g t h e d e t e c t o r i n t h e r e a d e r w i t h t h e i r r a d i a t e d d e t e c t o r s u r f a c e i n d i r e c t i o n t o t h e p h o t o m u l t i p l i e r .
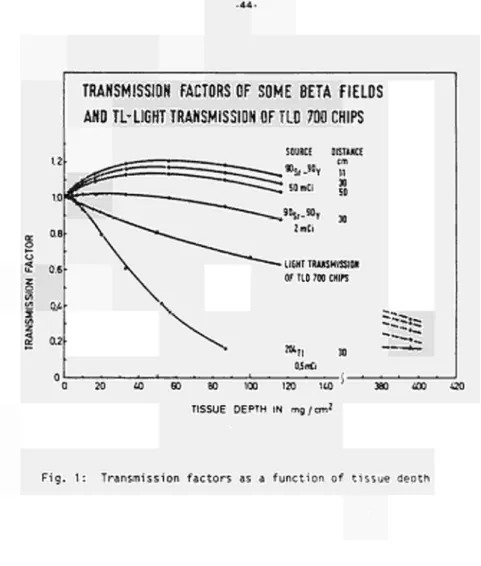
TRANSMISSION FACTORS
40
between source and d e t e c t o r . Fron t h e PTB c a l i b r a t i o n values of t r a n s m i s sion f a c t o r s are g i v e n as a f u n c t i o n of t i s s u e depth f o r d i f f e r e n t d i s t a n ces of t h e s o u r c e s . The b e t a d o s e i s presented i n t h e q u a n t i t y absorbed dose in s o f t t i s s u e at t h e s u r f a c e of a s e n i i n f i n i t e t i s s u e e q u i v a l e n t phantom.
I n Fig 1 t h e t r a n s m i s s i o n f a c t o r te i s presented as a f u n c t i o n of t h e t i s s u e depths f o r t h e d i f f e r e n t b e t a s o u r c e s according t o the c e r t i f i c a t e of t h e b e t a s e c o n d a r y standard ( 1 ) and the data g i v e n by the PTB f o r t h e t i s s u e depths of 390 mg/cm ( 2 ) . For a l a r g e r d i s t a n c e between source and d e t e c t o r the t» v a l u e decreases s i g n i f i c a n t l y . For t i s s u e depths higher than 100 mg/cm the t r a n s m i s s i o n f a c t o r was found by l i n e a r i n t e r p o l a t i o n of t h e tö v a l u e s between 100 and 390 mg/cm . The ta f a c t o r g i v e n i n Fig 1
can be a p p l i e d t o c a l c u l a t e the absorbed dose in the t i s s u e depths or i n t h e d e t e c t o r depth of i n t e r e s t .
The o p t i c a l t r a n s m i s s i o n f a c t o r t . t a k e s i n t o account the a b s o r p t i o n of TL l i g h t in t h e d e t e c t o r d u r i n g e v a l u a t i o n . The t . values as a f u n c t i o n of d e t e c t o r t h i c k n e s s p r e s e n t e d i n Fig 1 have been found by gammair r a d i a t e d TLD d e t e c t o r s of 0.2 mm t h i c k n e s s which was covered d u r i n g r e a d o u t
c o n s e c u t i v e l y by a d d i t i o n a l u n i r r a d i a t e d chips of 0.2 mm t h i c k n e s s . The response of t h e TL d e t e c t o r f o r b e t a and gammarays i s given by the e q u a t i o n s :
R
=
It
R = L. L
V X . k Dy
RR βresponse / Vresponse for absorbed dose in soft tissue in counts per rad
,» , a detector reading in counts
0 , , D absorbed dose in soft tissue in rads
Ρ y
X exposure in R
41
On the basis of Fig 1 the mean transmission factor T„ can be calculated taking into account the absorption of /j = particles and of the TL light in the detector of the thickness s.
τ 1
?
V î :
0% ·
V
sThe T. light absorption in the gamma irradiated detector is given by
TL = 1 f\ . ds
o
The response v a l u e s R« and R „ a r e c o r r e c t e d by t h e t r a n s m i s s i o n . i n o r d e r t i
T h i s r e s u l t s i n
f a c t o r Τΰ and T. in order t o be independent of t h e d e t e c t o r t h i c k n e s s .
ai ROß »Λ Τ R°„ =
^s
'ßJß
y x . k . τ ,
The r a t i o between öresponse and y r e s p o n s e i s then
*°a an . x.k . Ti
R = 7 · *y D;J J,.
RESULTS
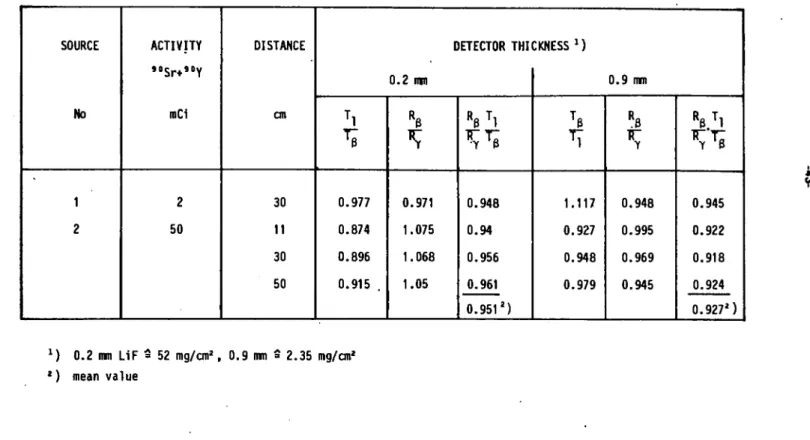
I n T a b l e 1 t h e e x p e r i n e n t a l r e s u l t s o f t h e response r a t i o Rg / R „ , t h e f a c t o r T . / T n and t h e c o r r e c t e d response r a t i o i s p r e s e n t e d f o r t h e TLD d e t e c t o r s of 0 . 2 nm and 0 . 9 mm t h i c k n e s s and f o r t h e c a l i b r a t i o n p o s i t i o n s
90 90
of t h e Sr + Y s o u r c e s .
The u n c o r r e c t e d response r a t i o s c a t t e r s f o r t h e d i f f e r e n t i r r a d i a t i o n p o s i t i o n s between 0 . 9 7 and 1.075 f o r t h e 0 . 2 mm t h i c k TLD 700 and between 0 . 8 4 6 and 0 . 9 9 5 f o r t h e 0 . 9 mm t h i c k TLD 7 0 0 . Taking i n t o account a b s o r p t i o n of b e t a r a y s and l i g h t in t h e d e t e c t o r t h e c o r r e c t e d response r a t i o s have been found t o be n e a r l y constant w i t h i n *_ 1.5%.
-42-The systematical uncertainty for the ß I y reference dose is in the order of 2% / 3% and for the TLD irradiations 2% / 2X. The results of the response ratios are found to be within the t o t a l measuring uncertainty of about +_ 5X.
With respect to intercomparison experiments, a comparison of the results found in the laboratories with different calibration sources is thus only possible, i f a correction of the detector thickness on the basis of known transmission factors has been made. This reduces the systematic uncertainty from 15% to about 1%.
REFERENCES
(1) Certificate of the beta secondary standard No 4 PTB-Berichte No 6.41/04/78 SB
Table 1: Beta/gamma ray response ratio for TLD700 and detector specific transmission factors
SOURCE No 1 2 ACTIVITY»°Sr+9 0Y
mCi 2 50 DISTANCE cm 30 11 30 50 T
l
Ti
0.977 0.874 0.8960.915 .
DETECTOR THICKNESS1)
0.2 mu
0.971
1.075
1.068
1.05
RßTl
0.948 0.94 0.956 0.961 0.951')
ïï
1.117 0.927 0.948 0.9790.9 mm
Rß TT γ 0.948 0.995 0.969 0.945
RßTl
0.945
0.922
0.918
0.924
0.9272)
*) 0.2 mm LiF = 52 mg/cm
2, 0.9 mm = 2.35 mg/cm
2oc
o ο
<
Σ ¡Λ
<
OCTRANSMISSION FACTORS OF SOME BETA FIELDS
AND TLLIGHT TRANSMISSION OF TLD 700 CHIPS
SOURCE DISTANCE «S,»Y η
30 SO 30 LIGHT TRANSMISSION OF TIO 700 CHIPS
2 0 4 0 6 0 8 0 100 120 140 TISSUE DEPTH IN mg/cm2
<:!?
380 ¿00 420
45
4 . COMMENTS BY PARTICIPANTS
( f ) N a t i o n a l R a d i a t i o n _ M o n i t o r i n g _ S e r y i c e ¿ _ D u b U n D^_MURNAGHAN
The F i l m Badge Dosemeter S e r v i c e o p e r a t e d by t h e N a t i o n a l R a d i a t i o n
M o n i t o r i n g S e r v i c e ( N . R . M . S . ) i n I r e l a n d uses Kodak R.M. F i l m and t h e
U . K . A . E . A . / N . R . P . B . t y p e h o l d e r . The e v a l u a t i o n methods i n use a r e p r i m a
r i l y based on t h e system d e v i s e d by Jones and i l a r s h a l l ( 1 9 6 4 ) i n t h e U n i t e d
K i n g d o m .
The o v e r a l l N . R . M . S . r e s u l t s f o r t h e b e t a i n t e r c o m p a r i s o n a r e shown
_in t h e f i r s t d i a g r a m ( f i g u r e 1) where t h e p a t c h e d a r e a s r e f e r t o T h a l l i u m 2 0 4
i r r a d i a t i o n s . The n e x t t h r e e d i a g r a m s ( f i g u r e s 2 , 3 & 4) show t h e b e t a
r e s u l t s f o r e a c h o f t h e i r r a d i a t i n g l a b o r a t o r i e s ; t h e P . T . B . , L . M . R . I , and
N . P . L . The o r d e r i n w h i c h t h e l a b o r a t o r i e s a r e l i s t e d i s o f some r e l e v a n c e
as s h a l l be seen l a t e r . I t s h o u l d be p o i n t e d o u t t h a t t h i s i s a f a c t o r
a s s o c i a t e d w i t h t h e t i m e s c a l e o f t h e i n t e r c o m p a r i s o n e x e r c i s e and n o t
d i r e c t l y w i t h t h e i r r a d i a t i n g l a b o r a t o r i e s . I n t h e n e x t d i a g r a m ( f i g u r e 5)
t h e t i m e i n t e r v a l b e t w e e n t h e e x p o s u r e o f t h e f i l m d o s e m e t e r s a t t h e
i r r a d i a t i n g l a b o r a t o r i e s and t h e i r subsequent d e v e l o p m e n t i n D u b l i n i s
i l l u s t r a t e d . The l i n e i n d i c a t e d by "CAL" r e f e r s t o o u r s e t o f c a l i b r a t i o n
and r e f e r e n c e f i l m s w h i c h was p r e p a r e d a t a t i m e w h i c h t h e n seemed l i k e l y
t o c o i n c i d e w i t h t h e a c t u a l e x p o s u r e d a t e s a t t h e i r r a d i a t i n g l a b o r a t o r i e s .
A c o n s i d e r a b l e p e r i o d o f t i m e e l a p s e d b e t w e e n t h e e x p o s u r e and d e v e l o p m e n t
o f t h e t e s t d o s e m e t e r s due t o d e l a y s i n t h e i r r e t u r n t o D u b l i n . These
d e l a y s were o u t s i d e t h e c o n t r o l o f t h e i r r a d i a t i n g and e v a l u a t i o n l a b o r a t o
r i e s b e i n g due t o a p r o l o n g e d d i s r u p t i o n o f t h e p o s t a l s e r v i c e s .
The f i r s t e x p o s e d d o s e m e t e r s t o r e a c h o u r l a b o r a t o r y were f r o m t h e
P . T . B . and t h e i r d e v e l o p m e n t was p o s t p o n e d i n t h e e x p e c t a t i o n t h a t t h e
exposed d o s e m e t e r s f r o m t h e L . r i . R . I . and N . P . L . w o u l d soon a r r i v e . A f t e r
w a i t i n g f o r a month t h e d e c i s i o n was made t o d e v e l o p t h e P . T . B . and c a l i
b r a t i o n f i l m s and so t o s a l v a g e as much as p o s s i b l e f r o m t h e i n t e r c o m p a r i s o n
programme. Two a d d i t i o n a l s e t s o f c a l i b r a t i o n f i I n s were t h e n o r e p a r e d . Set
A b e i n g d e v e l o p e d s h o r t l y a f t e r t h e e x p o s u r e and s e t Β b e i n g h e l d f o r d e v e
lopment w i t h t h e f i l m s f r o m t h e r e m a i n i n g t w o i r r a d i a t i n g l a b o r a t o r i e s . The
exposed d o s e m e t e r s f r o m b o t h t h e L . M . R . I , and t h e N . P . L . d i d n o t r e a c h o u r
l a b o r a t o r y u n t i l J u l y when t h e y were d e v e l o p e d t o g e t h e r w i t h c a l i b r a t i o n s e t