1
Frequency Support Using Multi-terminal HVDC Systems
Based on DC Voltage Manipulation
J. Rafferty 1, L. Xu 2, Y. Wang3, G. Xu3 and F. Alsokhiry4
1 ESBI, Dublin, Ireland. Email: [email protected]
2 University of Strathclyde, Glasgow, G1 1XW, UK. Email: [email protected]
3 North China Electric Power University, Baoding, China. Email: [email protected], [email protected] 4 King Abdulaziz University, Saudi Arabia. Email: [email protected]
Abstract
This paper investigates the use of multi-terminal HVDC systems to provide primary frequency support to connected AC networks via coordinated DC voltage manipulation. Control schemes for multi-terminal HVDC systems to allow redistribution of active power, based on the idea of “power priority” are proposed. Inertia response from DC connected large offshore wind farms can also be incorporated based on the detection of DC voltage derivation at the offshore converter terminal without the need for telecommunication between the DC terminals. Simulation studies based on a three-terminal HVDC system connecting one large wind farm and two separate AC networks validate the operation of the system during frequency events.
1 Introduction
The occurrence of substantial AC frequency events, brought about by an imbalance between the generated power and the power demand within an AC network can destabilise the system and potentially risk de-synchronisation. Primary frequency support can be provided by the inherent inertia of conventional rotating machines thus automatically offsetting frequency deviations within the overall system. However, when proposed large multi-terminal HVDC (MTDC) systems, incorporating a significant number of interconnected wind farms are considered, the decoupling of both the large rotating mass of the modern, variable speed wind turbines, via their power electronic converters and the further decoupling of the different power networks through interconnected HVDC systems, could result in a system with a large generating capacity but with its overall inertia being substantially reduced making the system frequency more susceptible to changes in load and generation [1].
To provide frequency support to offset high levels of wind penetration several options including flywheel and fast response battery storage have been proposed [2, 3]. However these can have high capital costs and, when MTDC systems are consider, are only capable of providing support to the local AC network connected to the DC grid [2]. However, due to the large rotating mass within the turbine blades, wind farms have significant inertia stores and are capable of providing frequency support through manipulation of their power electronic controls [4, 5].
2
and the decoupling of the AC and DC grids. Therefore, effective DC grid management strategies will be required to optimise the full network support benefits available.
The ability of a MTDC system to provide frequency support has been investigated, however its capacity to do so is limited in these studies to the amount of available active power on the DC system, and/or the additional power generated from wind turbine inertia response [4–8]. Primary frequency support in MTDC systems has been proposed by the means of DC voltage and AC frequency droop control [7]. However, this work considers only minor frequency events on the system and results in a low common DC voltage even under normal conditions, e.g. no load imbalance. It does not consider the utilisation of wind turbine inertia for the provision of frequency support, nor does it consider the AC interconnection of the DC converter grid points at the receiving end via AC (or DC) interconnectors between neighbouring AC grids. This raises its own problems in terms of detection of frequency events and subsequent support capabilities of HVDC converters due to the averaging of the frequency over a few seconds within all parts of a synchronous AC system [9]. Work has been carried out on the effect of the loss of a converter on the frequency deviation in a MTDC system, proposing a method of sharing the power imbalance between the remaining terminals to offset the frequency event [6]. However the model does not consider any “load priority” at the receiving end converters and the subsequent grid management requirements of ensuring that sufficient active power is available to offset the load imbalances [10].
Another feature of MTDC yet to be fully utilised is the fact that manipulation of the DC voltage at a single converter in a DC system will register at all other terminals within the system. This relationship could be exploited as a method of circumventing the issue of decoupling between HVDC interconnected offshore wind systems and onshore AC networks and potentially utilised as an additional method of frequency event detection, a process which currently has to be carried out by long distance telecommunication between the onshore and offshore converter terminals. This also applies to cases whether the MTDC system connects independent AC networks.
The objective of this work is to further assess the capabilities of converters within a MTDC system to provide frequency support to interconnected AC systems during periods of under/over frequency. It proposes the redistribution of available active power in the MTDC system to offset the effect of load imbalances on the AC networks utilising the implementation of DC grid management strategies. It also develops a method of detecting frequency deviations in HVDC interconnected AC networks including offshore wind farms without using telecommunication among the DC converters. The rest of the paper is organised as follows. Section 2 describes the proposed system and Section 3 outlines the proposed frequency supporting method. Case studies are presented in Section 4 and finally Section 5 draws conclusions.
2
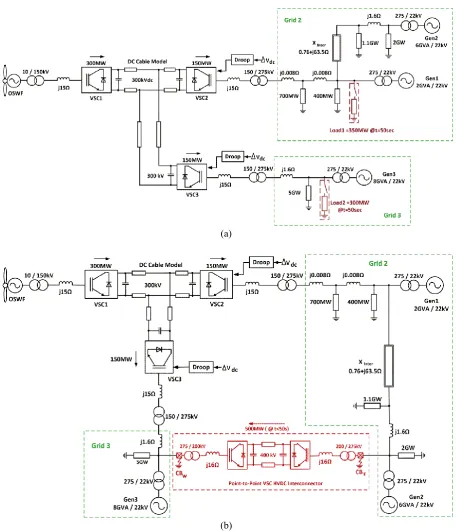
Proposed system for case study
3
600MW. The AC system at the remaining receiving end VSC3, i.e. Grid 3, is modelled as a single synchronous generator of 8GW (Gen3) and supplies a load of 5GW under normal conditions. For the purposes of this study a 500MW offshore wind farm (WF) is connected to converter VSC1 and the wind farm is modelled as a lumped PMSG connected to VSC1 at 150kV offshore AC line. The DC cable parameters are: 13.9mΩ/km, 0.159mH/km, 0.231µF/km [11] and the length of each cable to the DC cable midpoint is 50km.
(a)
[image:3.595.71.528.175.707.2](b)
4
The basic three-terminal MTDC system proposed here is modified to include an additional point-to-point DC interconnector between Grid 2 and Grid 3, with a DC voltage of ±200kV and a maximum export capacity of 500MW, for an additional case study as shown in Fig. 1 (b). It is worth noting in this instance that if the active power flow between this DC interconnector is set at zero then the system will behave similarly to the one shown in Fig. 1 (a).
3 MTDC systems for frequency support
3.1 Inertia Response in Variable Speed Wind Turbines
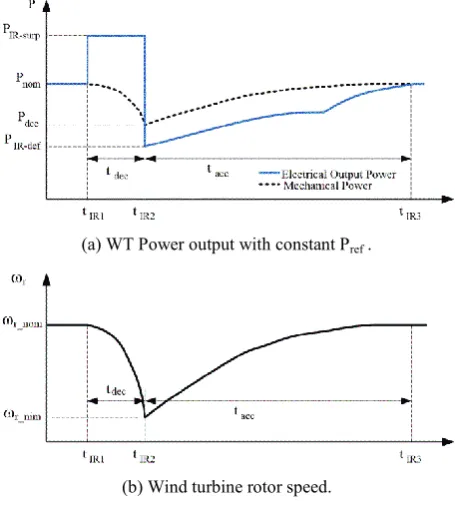
Due to the significant rotating mass large wind turbines are capable of generating temporary excess electrical power via power electronics controls [1, 2]. This is achieved by decreasing the mechanical speed of the turbine rotor to release the stored kinetic energy within the turbine blades to yield a temporary increase in the output electrical power which can be utilised for AC frequency support. The provision of frequency support using wind turbine inertia response has been well documented [4, 5], therefore only a brief description is given here.
(a) WT Power output with constant Pref .
[image:4.595.184.412.320.574.2](b) Wind turbine rotor speed.
Fig. 2 Wind turbine inertia response
A typical profile for the extraction of additional power from wind turbine inertia is shown in Figs. 2 (a) and (b). is the normal output active power of the wind turbine at the normal rotor speed of ωr_nom, is
the electrical power generated by the wind turbine during inertia support at time , and is the
minimum output active power at the end of inertia support at time when the turbine has reached its
minimum rotor speed ωr_nim and needs to be reaccelerated, as indicated in Fig. 2 (b). Hence, the limit of the
possible turbine inertia available, in other words, the maximum additional energy from inertia response is determined by the size of the turbine blade, its mechanical input power and output electrical power, and the the initial turbine operating speed, which in turn also determines the reacceleration period ( ) back to its
5
3.2 Criteria of potential frequency support methods
It is acknowledged that wind turbine inertia response can temporary provide additional power to offset frequency events within the AC system in which large offshore wind farms are considered [4, 10, 12, 13]. However, this is in reality only a temporary solution, since the issue of the reduction of the mechanical power turbine produces a power shortfall that will need to be recouped eventually by the turbine as the rotor has to accelerate back to its optimum speed, as evident in Fig. 2. Therefore, the frequency support capacities from the wind turbine inertia are limited for two reasons:
1. Limited reduction in speed, therefore limited power extractable due to possibility of turbine stalling.
2. Reduction in mechanical kinetic power reduces overall power output of the turbine, as the turbine needs to accelerate back to normal speed.
Given these limitations, it would be advantageous that such a system as proposed would be capable using the inherent power sharing flexibility of MTDC systems to offset small scale frequency events, without the need for additional power from the turbine inertia. Further, in the event that inertia response is utilised, when multi-terminal systems with isolated AC networks are considered, it is necessary for the system to allocate the extracted additional power to the correct converter terminal to ensure that AC system experiencing the load imbalance is alleviated, as any additional power on the DC system could be redistributed to the receiving ends indiscriminately based on the existing power sharing control arrangement. This can be particularly challenging as different terminals in a MTDC grid can be prioritised to allow the allocation of power dependant on the demand at the receiving ends while ensuring that security of supply is maintained [14].
With this in mind, care must be taken to ensure that the proposed frequency support method does not compromise the stable operation of a terminal not experiencing a load imbalance. This could be caused by redistributing too much active power in an attempt to offset the load imbalance at the offending terminal, and will be dependent on the power requirements of the unoffending terminal.
Another issue that arises from the use of wind turbine inertia in MTDC systems is how the turbine detects when and at what terminal the imbalance has occurred since the turbines are decoupled from the onshore AC grid. This also applies to the connection of different power networks via MTDC systems.
3.3 Frequency Support utilising DC Grid Management
By utilisation of DC grid management strategies for the control of DC active power within the system relocation of active power via DC converter control can be used to redistribute power away from low priority receiving end terminals to offset the power imbalances, and hence frequency deviations, at offending terminals. This redistribution of active power would result in the sharing of large frequency dips between multiple grid points thus resulting in smaller, more manageable frequency dips at each terminal, and ensuring that the total frequency of the system remains within acceptable levels as outlined by the system operators.
As previously discussed, it would be advantageous to keep telecommunication between DC terminals to a minimum, to minimise the response time of the system during frequency support and to eliminate any possible connection issues that can arise from long distance telecommunications.
6
dc dc
ref dc dc
V k I
V V V
(1)
where and are the reference and measured DC voltages respectively, and k is the droop constant.
The active power output at a converter terminal is given as
dc dc I
V
P (2)
Therefore, via manipulation of the set DC voltage reference of the droop controller we can manipulate the perceived voltage change by the controller
V I P
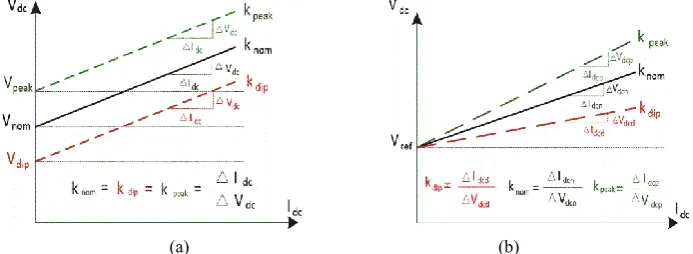
Vref dc dc (3) With regards to the method of manipulating the Vref value, there are two options available
.
The first is toincrease/decrease the value of Vref dependent on whether the converter is detecting a frequency peak/dip at its
respective AC grid point. In this example, the droop integral k value will remain the same, independent of the DC voltage reference. The voltage-current characteristic for a system utilising this control method is shown in Fig. 3(a), where, knom, kdip, kpeak and Vnom, Vdip, Vpeak are the droop constants and reference voltages under normal,
frequency dip and frequency surplus conditions, respectively.
Alternatively, manipulation of can also be achieved by manipulation of the droop constant value k
directly. In this control option,
peak nom
dip
k
k
k
(4)The VI characteristics are shown in Fig. 3(b). Although this could potentially achieve similar frequency support capabilities manipulation of the integral k values in real time could present its own challenges, particularly as the actual power sharing between the two converters would be dependent on not only the k value, but also the cable resistance.
[image:6.595.125.472.454.581.2]
(a) (b)
Fig. 3: Frequency support options for normal and load imbalance: DC voltage droop characteristics
[image:6.595.182.431.621.683.2](a) Option 1: manipulation (b) Option 2: Droop constant k manipulation
Fig. 4: Frequency support algorithm
The proposed frequency support (FS) algorithm in this paper utilises Option 1 and is shown in Fig. 4. It should be noted that kf is the frequency event constant, and is provided to allow a certain degree of flexibility
7
connection point respectively, Δfreq, fover_limit and funder_limit are the change in frequency, and over and under
frequency threshold limits respectively. As can be seen from Figs. 3 and 4, the setting of Vref (i.e. Vdip/Vpeak)
when a frequency transient has been detected affects the available additional active power for supporting the AC offending network. The selection of the gain value kf shown in Fig. 4 has to consider the following two aspects:
The maximum and minimum DC voltages allowed for the MTDC system as indicated in (5a) and (5b) in the next paragraph.
The effect on active power redistribution and ultimately on frequency support.
In order to avoid compromising the DC grid, upper and lower acceptable DC voltage limits during periods of frequency support will need to be clearly defined. The European Network of Transmission System Operators for Electricity (ENTSO–E) is working towards a Network Code on HVDC Connections for a European DC grid and has proposed a working draft [15], which is used for the basis of this study. Therefore here the proposed upper / lower DC voltage limits of the system are set as:
During over-frequency event (5a)
During under-frequency event (5b)
Due to the flexible nature of the DC droop control at other terminals automatic and instantaneous readjustment of the unaffected converter when power is redistributed to an offending terminal is achieved without the need for additional control. For example, if VSC2 detects a frequency drop in its connected AC network GP2, its DC voltage reference will drop to increase its exported power to GP1 (
2 2 2
2 V I P
Vref dc dc ). Due to the increased power export by VSC2, the common DC voltage
drops and consequently, the power export by VSC3 to Grid 3 drops accordingly to achieve automatic power redistribution (Vdc3Vdc3Idc3P3). If DC voltage control utilising a PI controller is more suitable to meeting the control requirements of the system under normal conditions it is proposed that the system operate in two separate modes, namely: Normal (PI Control) and Imbalance operation, where the converter terminal would switch to DC droop control when a load imbalance is detected. The effect of this control algorithm when a PI controller is utilised at a receiving end VSC is not given here again due to space limitation.
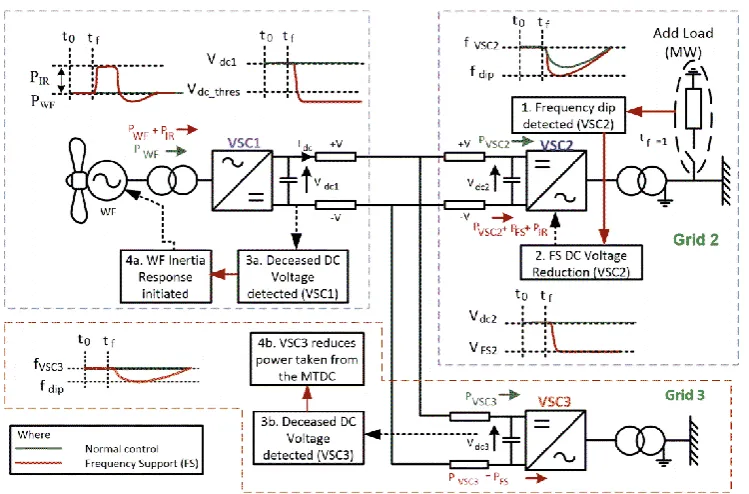
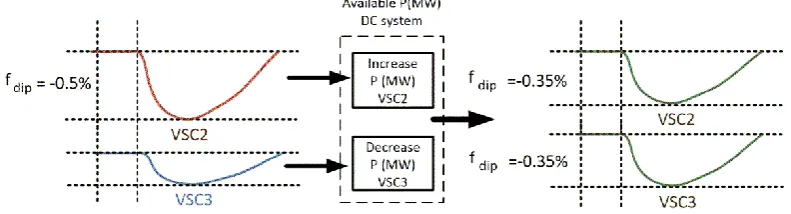
A graphical depiction of the proposed power redistribution method for frequency support is shown in Fig. 5, (based on Fig. 1 (a)) where PWFand PIR are the normal power output and additional power output from wind
8
Fig. 5: Frequency dip/inertia response detection based on shared DC voltage in a MTDC system
3.4 Detection of Frequency Events at Isolated Wind Farms within MTDC
As previously discussed, another characteristic of this frequency support via DC voltage manipulation method is that changes in the DC voltage at a single terminal are reflected at all terminals within the MTDC system. Utilisation of this could potentially provide a means by which a decoupled offshore wind farm or other DC connected independent AC networks can be informed of the occurrence of a frequency event on the onshore/other AC system and hence, provide additional power via either inertia response or power redistribution.
Taking a wind farm as an example, the drop in DC voltage at the wind farm converter terminal can be used to detect that the receiving AC system is suffering a load imbalance and it can, therefore, supply additional active power to the DC system via inertia response. By using the proposed controller, the drop in onshore AC system frequency could be reflected by the drop of the DC link voltage. As the DC link voltage variation is almost the same along the DC transmission line, thus DC link voltage measured at the wind farm side converter can be used as an indicator for the AC system’s requirement for frequency support from the offshore wind farm. The frequency of the wind farm collection system can be modulated by adding an additional controller to the wind farm side VSC once DC voltage reduction is detected. In this instance the frequency link between the main AC network and the offshore wind farm collection network is re-established, and the wind turbines can be controlled to emulate the inertial response to provide frequency support to the main network. Another option is to directly use the DC link voltage to activate the inertial response of the wind turbines using local communication between the offshore DC terminal and the wind turbines. For this strategy, a voltage relay which activates a flag signal once it detects the DC voltage drops below ΔVdc_n is communicated from the wind farm
9
3.5 Frequency Events at Multiple Receiving End VSC
A simultaneous load imbalance occurring at both receiving end terminals limits the system in frequency support options. If substantial frequency nadirs occur at both converters, then the redistribution of available power from the DC grid and/or supply of additional active power from the AC system of a low priority converter may not be an option without further compromising the stability of at least one AC system. In such an instance, despite its previously discussed limitations, inertia response may be the only viable frequency support option.
However, if the magnitude of at least one frequency nadir is not excessive and differs at each terminal, there exists the capacity to average the frequency dip between the two grid points thus sharing the load imbalance between all the receiving end VSCs. This can be achieved by increasing the DC output power at the VSC with the largest frequency nadir, and conversely decreasing the DC output power at the VSC with the smaller frequency nadir producing even frequency dips at each VSC as oppose to a large frequency event at a single VSC. This could potentially avoid a situation where a severe frequency nadir (i.e. one that violates the grid code on a single AC system and risks de-synchronisation) in favour of two less severe nadirs (that would allow synchronisation to be maintained) on both systems. This is achieved by utilisation of the FS algorithm at both receiving end VSC. Although a frequency event occurs on the AC network of both receiving end VSCs, the FS algorithm will cause the DC voltage at the VSC with the most severe frequency dip to drop lower than that in the other VSC, thus redistributing power from the stronger AC network to the network with the greater load imbalance until equilibrium is achieved. This is depicted graphically in Fig. 6.
[image:9.595.101.497.492.599.2]This frequency support method requires more flexible sharing of power between both receiving end VSCs, thus shared priority of available active power would be required in which both receiving end converters may be required to operate as a rectifier or an inverter, extracting and supplying power from the DC grid as necessary. Again this can be automatically facilitated by DC voltage droop control at both VSCs.
Fig. 6 Frequency event at multiple receiving VSC for sharing of load imbalance,
3.6 Loss of Point-to-Point HVDC Interconnector between Grid 2 and Grid 3
10
under-frequency and over-frequency event could occur on the respective AC grids, and would be detected as such by conventional frequency event detection methods.
However, if such a system as depicted in Fig. 1 (b) is considered, the shared MTDC system, when used in conjunction with the DC voltage manipulation algorithm as proposed here, can potentially facilitate the redistribution of available active power on the system, so as to automatically offset the imbalances between the frequencies at each grid point. This will be demonstrated in section 4.3.
4 Case studies
The systems proposed in Fig. 1 were simulated using Matlab/Simulink, with the Frequency Support algorithm utilised for DC voltage control at the receiving end VSC 2 and 3. All frequency events on the proposed systems occur at t=50s. When wind turbine inertia response is utilised, the power output from the wind farm increases from 300MW to 400MW from t=50s – 60s.
4.1 Frequency event at single receiving end
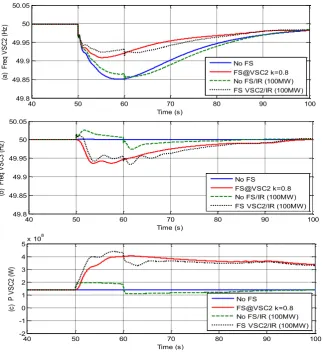
Frequency event case studies where two isolated AC systems connected at each grid side receiving end VSCs as shown in Fig. 1 (a) were carried out. In this case study, a significant load imbalance is simulated by an increase in the demand (switch in Load 1) at Grid 2 (VSC2) of 350MW at time t=50s while Load 2 at Grid 3 is not switched, resulting in a frequency nadir of approximately 0.3% (50Hz to 49.85Hz) at Grid 2 when frequency support (FS) from the MTDC system is disabled, as can be observed in Fig. 7(a) (the curve with No FS). It is important to note that in this example the total available power on the DC grid is insufficient to offset the load imbalance at VSC2.
4.1.1 Frequency Support Algorithm Utilised at VSC2
For this example it is assumed that there is no inertia response (IR) from the wind farm. When frequency support is utilised the dip in the AC frequency below the under frequency threshold of the Grid 2 system, detected by VSC2, causes the FS algorithm to activate resulting in an automatic decrease in the DC voltage reference at VSC2 in relation to the size of the frequency dip, as can be observed in Fig. 7(e). This informs the DC system that additional power is required at VSC2, therefore diverting power away from VSC3 (Fig. 8(d)) results in an increase in the active power supplied to VSC2 as seen in Fig. 7(c), in an attempt to offset the frequency dip. In this example, the frequency dip presents an issue in that even with the full available DC power supplied to VSC2 the power demand still exceeds the supply.
11
In should be noted that, although the common DC voltage experiences a larger drop than the previous example, due to the necessity to redistribute more power in this case, the system still operates within grid code specifications as can be observed in Figs. 7(e) and (f).
4.1.2 Frequency Support and Inertia Response Utilised (FS VSC2/IR (100MW))
It should be noted that due to utilisation of the FS algorithm the triggering of the wind turbine inertia response is based on the shared DC voltage drop as outlined in Section 3.3. With both the frequency support algorithm and the inertia response utilised, the small amount of active power released from the turbines kinetic energy makes minimum contribution to the offsetting of the frequency deviation but does help offset the initial frequency nadir at VSC2 when compared to the system utilising solely the FS algorithm, as can be observed in Fig. 7(a) (FS VSC2/IR vs. FS@VSC2). Also, this additional power does help to offset the frequency nadir of VSC3 which arises from the sharing of the load imbalance between the receiving end VSCs by compensating for some of the power imbalance at VSC2, thus the amount of power supplied to the DC system by VSC3 for frequency support is initially reduced as can be observed in Fig. 7(f). However, again this additional power must be recouped by accelerating the turbine back to nominal speed thus leading to a decrease in the active power available on the DC system and hence the FS algorithm reduces the DC voltage at VSC2 once the inertia response has finished, to increase the power supplied to VSC2 to offset the frequency dip as can be in Figs. 7(c) – (d) at t=60s. It should also be observed that due to the reacceleration of the turbine post inertia response a second frequency dip occurs at VSC3 at t=62s, however this is less than the initial frequency nadir, since the system frequency is recovering.
40 50 60 70 80 90 100
49.8 49.85 49.9 49.95 50 50.05 Time (s) (a ) Fr eq V S C 2 (H z) No FS FS@VSC2 k=0.8 No FS/IR (100MW) FS VSC2/IR (100MW)
40 50 60 70 80 90 100
49.8 49.85 49.9 49.95 50 50.05 Time (s) (b ) Fr eq V S C 3 (H z) No FS FS@VSC2 k=0.8 No FS/IR (100MW) FS VSC2/IR (100MW)
40 50 60 70 80 90 100
-2 -1 0 1 2 3 4 5x 10
[image:11.595.133.457.408.761.2]12
Fig. 7: Simulation results during single load imbalance at Grid 2 (Load 1 of 350MW switched in at 50s), where FS denotes a system utilising frequency support control algorithm, and IR denotes that the system is utilising inertia response from the wind farm
4.2 Multiple Frequency Events: FS algorithm utilised at VSC2 and VSC3
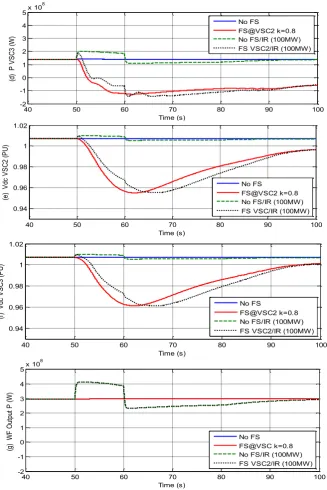
In this case study, multiple load imbalances were simulated by an increase in the demand at Grid 2 (VSC2) of 350MW and Grid 3 (VSC3) of 300MW at time t=50s, resulting in a frequency nadir of approximately 0.2% and 0.25% (50Hz to 49.90Hz and 49.87Hz) respectively, as can be observed in Fig. 8 (a) (the curve with No FS).
4.2.1 Frequency support algorithm utilised at VSC2 and VSC3
40 50 60 70 80 90 100
-2 -1 0 1 2 3 4 5x 10
8 Time (s) (d ) P V S C 3 (W ) No FS FS@VSC2 k=0.8 No FS/IR (100MW) FS VSC2/IR (100MW)
40 50 60 70 80 90 100
0.94 0.96 0.98 1 1.02 Time (s) (e ) V dc V S C 2 (P U ) No FS FS@VSC2 k=0.8 No FS/IR (100MW) FS VSC/IR (100MW)
40 50 60 70 80 90 100
0.94 0.96 0.98 1 1.02 Time (s) (f) V dc V S C 3 (P U ) No FS FS@VSC2 k=0.8 No FS/IR (100MW) FS VSC2/IR (100MW)
40 50 60 70 80 90 100
-2 -1 0 1 2 3 4 5x 10
13
For this example it assumes no inertia response from the wind farm. When frequency support is utilised, the dip in the AC frequency below the under frequency threshold of the Grid 2 and 3, detected by VSC2 and VSC3 respectively again causes the FS algorithm to activate.
In this instance it is important to notice that the frequency dip profile at Grid 2 (VSC2) and Grid 3 (VSC3) is different due to the relative strength and configuration of the system as shown in Fig. 1(a), with Grid 3 experiencing a greater overall frequency dip than Grid 2 even though the actual power imbalance at Grid 3 is less than that at Grid 2. As the frequency dip (and ROCOF) at Grid 3 is greater, the FS algorithm reduces at
VSC3 lower than that of VSC2 thus redistributing active power from VSC2 to VSC3 on minimise its frequency dip when compared to if the FS algorithm was not utilised, and as a result increases the ROCOF at Grid 2, as can be observed in Figs. 8 (a) and (b) (LI 350MW @ VSC2/300MW @ VSC3 vs. FS) at t=52s. As the frequency at Grid 3 naturally restores quicker than Grid 2 (as observed in Fig. 8 (a) and (b) (LI 350MW @ VSC2/300MW @ VSC3) once the frequency dip at Grid 3 is less that at Grid 2 (t=54s), active power is redistributed from VSC3 to VSC2 as can be observed in Fig. 8 (c) and (d) (FS). This redistribution of power to each terminal continues until the system reaches equilibrium. Due to the different rates of the frequency restoration profiles of Grid 3 and Grid 2 coupled with the droop control utilised at each converter, this results in small oscillation of the frequency at the two receiving end terminals until equilibrium is achieved.
As can be observed, overall the FS algorithm successfully reduces the more significant frequency nadir at VSC3 though a small increase in the ROCOF at VSC2. However in this instance the frequency nadir at VSC2 is actually reduced, again due to the profile of frequency dip at VSC3, which initially restores its frequency more rapidly than the frequency dip at VSC2 as can be observed in Figs. 8 (a) and (b) (LI 350MW @ VSC2/300MW @ VSC3 vs. FS).
Again, although the common DC voltage experiences a larger drop than the previous example, due to the necessity to redistribute more power in this case, the system still operates within grid code specifications as can be observed in Figs. 8 (e) and (f).
4.2.2 Frequency Support and Inertia Response Utilised (FS VSC2/IR (100MW))
Again in this example utilisation of the FS algorithm allows the triggering of the wind turbine inertia response based on the shared DC voltage drop as outlined in Section 3.3. The combination of the additional active power from the wind turbine inertia and utilisation of the FS algorithm allows a more optimised sharing of the inertia response between the receiving end grid points than observed if solely inertia response is utilised (FS/IR vs. No FS/IR). This allows the sharing of the total wind farm output power available on the DC system at each VSC proportional to the magnitude of the observed frequency nadir, as can be observed in Figs. 8 (c) and (d). Additionally, as can be observed in Figs. 8 (a) and (b) the frequency nadir at VSC2 and VSC3 is reduced further than if solely FS or IR was utilised (FS and No FS/IR vs. FS/IR).
14
frequency dip is still, however, significantly less that the initial nadir, and is corrected as the turbine accelerates back to its optimum speed.
40 50 60 70 80 90 100
49.85 49.9 49.95 50 50.05 (a ) Fr eq V S C 2 (H z)
LI 350MW @ VSC2/300MW @ VSC3 FS k=0.8
No FS/IR FS/IR
40 50 60 70 80 90 100
49.85 49.9 49.95 50 50.05 Time (s) (b ) Fr eq V S C 3 (H z)
LI 350MW @ VSC2/300MW @ VSC3 FS k=0.8
No FS/IR FS/IR
40 50 60 70 80 90 100
-2 -1 0 1 2 3 4 5x 10
8 Time (s) (c ) P V S C 2 (W )
LI 350MW @ VSC2/300MW @ VSC3 FS k=0.8
No FS/IR FS/IR
40 50 60 70 80 90 100
-2 -1 0 1 2 3 4 5x 10
8 Time (s) (d ) P V S C 3 (W )
LI 350MW @ VSC2/300MW @ VSC3 FS k=0.8
No FS/IR FS/IR
40 50 60 70 80 90 100
0.92 0.94 0.96 0.98 1 1.02 Time (s) (e ) V dc V S C 2 (P U )
LI 350MW @ VSC2/300MW @VSC3 FS k=0.8
15
Fig. 8: Simulation results during two load imbalances at Grid 2 (350MW) and Grid 3 (300MW) (isolated networks) applied at 50s.
4.3 Frequency deviation due to loss of HVDC Interconnector between Grid 1 and 2
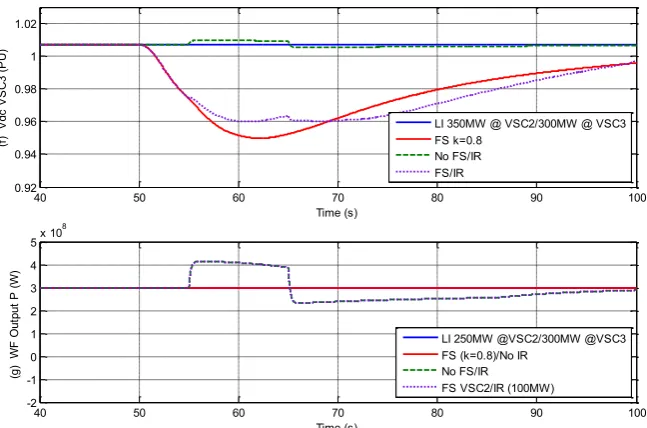
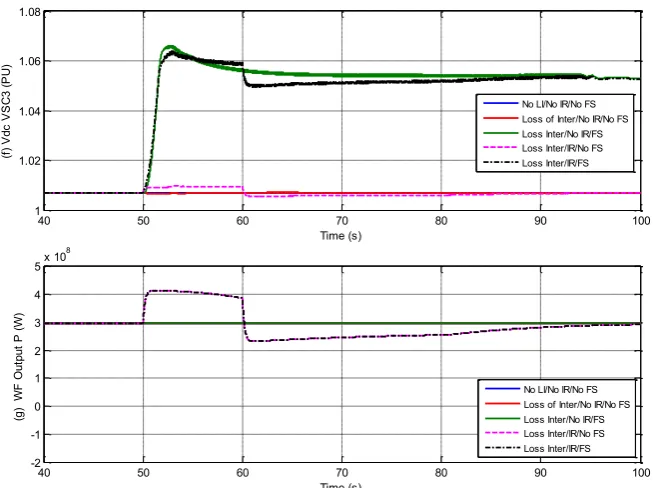
As observed in Figs. 9 (a) and (b), utilisation of the FS algorithm results in a redistribution of the available active power from VSC2 to VSC3 via the MTDC system, thus significantly reducing the over and under frequency occurrence at each respective AC grid point, when compared to the baseline (Loss Inter/No IR/FS vs. Loss Inter/No IR/No FS).
Although the sharing of the power imbalance initially leads to an increase in the frequency at VSC3 above the normal value, the frequency peak (+0.15Hz) is still smaller in magnitude than the frequency nadir (-0.22Hz) that would occur if the FS algorithm was not utilised as can be observed in Fig. 9(b) (Loss Inter/No IR/FS vs. Loss Inter/No IR/No FS).
It should be noted in this example that the large redistribution of the active power through the DC system results in a slight increase in the DC system voltage as can be observed in Figs. 9 (e) and (f) (Loss Inter/No IR/FS vs. Loss Inter/No IR/No FS). In this instance, once the FS algorithm is activated, VSC2 which now has a surplus of power has its voltage increased higher than VSC3, which is now at a power deficit, thus ensuring more power is distributed to VSC3 and away from VSC2 based on (3).
It can be noted that the proposed utilisation of DC voltage manipulation as a method of frequency event detection can correctly diagnose a power mismatch between the two isolated AC systems to ensure correct redistribution of the available power in the network. In contrast, conventional methods of frequency event detection can only detect under/over frequency events at the receiving end terminals and ha to rely on communications to redistribute the power.
40 50 60 70 80 90 100
0.92 0.94 0.96 0.98 1 1.02
Time (s)
(f
)
V
dc
V
S
C
3
(P
U
)
LI 350MW @ VSC2/300MW @ VSC3 FS k=0.8
No FS/IR FS/IR
40 50 60 70 80 90 100
-2 -1 0 1 2 3 4 5x 10
8
Time (s)
(g
)
W
F
O
ut
pu
t
P
(
W
)
LI 250MW @VSC2/300MW @VSC3 FS (k=0.8)/No IR
16
40 50 60 70 80 90 100
49.8 49.9 50 50.1 50.2 50.3 50.4 50.5 Time (s) (a ) Fr eq V S C 2 (H z)
No LI/No IR/No FS Loss Inter/No IR/No FS Loss Inter/No IR/FS Loss Inter/IR/No FS Loss Inter/IR/FS
40 50 60 70 80 90 100
49.8 49.9 50 50.1 50.2 50.3 50.4 50.5 Time (s) (b ) Fr eq V S C 3 (H z)
No LI/No IR/No FS Loss of inter/No IR/No FS Loss Inter/No IR/FS Loss Inter/IR/No FS Loss Inter/IR/FS
40 50 60 70 80 90 100
-1 -0.5 0 0.5 1
x 109
Time (s) (c ) P V S C 2 (M W )
No LI/No IR/ No FS Loss of Inter/No IR/No FS Loss Inter/No IR/FS Loss Inter/IR/No FS Loss Inter/IR/FS
40 50 60 70 80 90 100
-1 -0.5 0 0.5 1
x 109
Time (s) (d ) P V S C 3 (M W )
No LI/No IR/No FS Loss of Inter/No IR/No FS Loss Inter/No IR/FS Loss Inter/IR/No FS Loss Inter/IR/FS
40 50 60 70 80 90 100
1 1.02 1.04 1.06 1.08 Time (s) (e ) V dc V S C 2 (P U )
17
Fig. 9: Simulation results during the loss of a Point-to-Point VSC interconnector exporting 500MW from Grid 2 to Grid 3 at t=50s.
5 Conclusions
This work investigates the capacity of multi-terminal HVDC systems to offset frequency events on the connected AC systems via the regulation of the DC active power at each terminal. For larger frequency events caused by larger load imbalances between multi-terminal systems it was shown that a redistribution of the available active power including that from wind turbine inertia response to the offending AC system via the interconnected DC network can be utilised through manipulating the DC voltage within the system. It was further demonstrated that utilisation of DC voltage droop controllers at converter terminals allows the converter not experiencing a frequency dip to automatically readjust to the increased power demand of the converter experiencing the frequency dip, thus stable system operation is maintained. In addition, during the occurrence of multiple frequency events, redistributing active power at the receiving end terminals successfully reduces the severity of frequency nadirs generated at each terminal via the sharing of the burden of the power deficit that occurred.
References
[1] G. Xu, L. Xu, D. J. Morrow, “System Frequency Support using Wind Turbine Kinetic Energy and Energy Storage,” IET Renewable Power Generation Conference, Beijing, Sept. 2014.
[2] International Renewable Energy Agency Report, “Battery Storage for Renewables: Market Status and Technology Outlook,” January 2015. [online] Available at: http://www.irena.org/documentdownloads/publications/irena_battery_storage_report_2015.pdf . (Last accessed: April 2016)
[3] G. Xu, L. Xu, D. J. Morrow, and D Chen, “Coordinated DC Voltage Control of Wind Turbine with Embedded Energy Storage System”, IEEE Trans. Energy Conversion, Vol. 27, No. 4, Dec. 2012, pp. 1036-1045.
[4] A. B. T. Attya, T. Hartkopf, “Control and Quantification of Kinetic Energy released by Wind Farms during Power System Frequency Drops,” IET Renew. Power Gen., Vol. 7, Iss. 3, pp. 210-224, May 2013.
40 50 60 70 80 90 100
1 1.02 1.04 1.06 1.08
Time (s)
(f
)
V
dc
V
S
C
3
(P
U
)
No LI/No IR/No FS Loss of Inter/No IR/No FS Loss Inter/No IR/FS Loss Inter/IR/No FS Loss Inter/IR/FS
40 50 60 70 80 90 100
-2 -1 0 1 2 3 4 5x 10
8
Time (s)
(g
)
W
F
O
ut
pu
t
P
(
W
)
18
[5] G. Xu, L. Xu, and D. J. Morrow, “Assessment and implementation of inertia response from variable speed wind turbines”, Proc. of the 11th International Workshop on Large-Scale Integration of Wind Power into Power Systems as well as on Transmission Networks for Offshore Wind Power Plants, Lisbon, Portugal, Nov. 2012.
[6] J. Ekanayake. N. Jenkins, “Comparison of the Response of Doubly Fed Fixed-Speed Induction Generator Wind Turbines to Changes in Network Frequency,” IEEE Trans. on Energy Conversion, Vol. 19, No. 4, pp. 800 – 802, Dec 2004.
[7] T. M. Haileselassie, R. Torres-Olguin, T. Vrana, K. Uhlen, T. Undeland, “Main Grid Frequency Support Strategy for VSC-HVDC Connected Wind Farms with Variable Speed Wind Turbines,” IEEE Conc. PowerTech, Trondheim, June 2011.
[8] Y. Sun, Z. Zhang, G. Li, J. Lin, “Review on Frequency Control of Power Systems with Wind Penetration,”
IEEE conf. on Power System Technology (POWERCON), Hangzhou, Oct. 2010.
[9] T. M. Haileselassie, K. Uhlen, “Frequency Sensitivity Analysis of AC Grids Connected to MTDC Grid”
IET conf. ACDC Power Tranmission., London, Oct. 2010.
[10] N. R. Ullah, T. Thiringer and D. Karlsson, "Temporary primary frequency control support by variable speed wind turbines- potential and applications," IEEE Trans. Power Systems, Vol. 23, No. 2, pp. 601– 612, May. 2008.
[11] G. Xu, “Power Network Support using Wind Turbines with Embedded Energy Storage,” PhD Thesis, Queen’s University Belfast, March 2013.
[12] G. C. Tarnowski, P. C. Kjær, P. E. Sørensen and J. Østergaard, "Variable speed wind turbines capability for temporary over production," IEEE PES General Meeting, July. 2010.
[13] G. Ramtharan, J. B. Ekanayake, N. Jenkins, “Frequency Support from Doubly Fed Induction Generator Wind Turbines,” IET Renew. Power Gen., Vol.1, pp.2–9, March 2007.
[14] L. Xu, L. Yao, “DC Voltage Control and Power Dispatch of a Multi-Terminal HVDC System for Integrating Large Offshore Wind Farms” IET Renew. Power Gen., Vol.5, Iss.3 , pp. 1752-1416, April 2011.
[15]ENTSO–E Draft Network Code on High Voltage Direct Current Connections and DC–connected Power Park Modules, Nov. 2013. [Online] available for download at: https://www.entsoe.eu/major-projects/network-code-development/high-voltage-direct-current/ (last accessed: Jan. 2014).
[16] National Grid Report, “Notice of Proposed Income Adjustment Event –Moyle Interconnector Fault,” [online]. Available at:
http://www.google.co.uk/url?sa=t&rct=j&q=&esrc=s&source=web&cd=1&cad=rja&uact=8&ved=0CCw QFjAA&url=http%3A%2F%2Fwww2.nationalgrid.com%2FWorkArea%2FDownloadAsset.aspx%3Fid% 3D7956&ei=HuRfU7OKCcPnOrTjgdgO&usg=AFQjCNGBuIJ3eGf2WZaOrVipheRx8LknGg&bvm=bv.6 5397613,d.ZWU (last accessed: April 2015)