fire
Article
Conceptualizing Ecological Flammability:
An Experimental Test of Three Frameworks Using
Various Types and Loads of Surface Fuels
Lynda D. Prior1,*ID, Brett P. Murphy2and David M. J. S. Bowman2,*ID
1 School of Natural Sciences, University of Tasmania, Private Bag 55, Hobart, TAS 7001, Australia 2 Affiliation 2; Research Institute for the Environment and Livelihoods, Charles Darwin University,
Darwin, NT 0909, Australia; [email protected]
* Correspondence: [email protected] (L.D.P.); [email protected] (D.M.J.S.B.); Tel.: +61-03-6226-1737 (L.D.P.)
Received: 5 March 2018; Accepted: 27 April 2018; Published: 1 May 2018
Abstract: Vegetation flammability remains poorly defined and involves many intercorrelated components and metrics. Schwilk (2015) proposed a flammability framework with only two axes: total heat release and rate of spread. Pausas et al. (2017) modified this framework by standardizing the heat release axis by fuel load, and adding a third axis of fuel ignitability. We tested these frameworks using data from a field experiment that quantified flammability metrics and survival ofCallitris intratropicasaplings in relation to fuel type (grass, litter, and mixed grass and litter, all air-dried) and fuel load. Principal components analysis showed PC1 was closely aligned with rate of combustion, flame height and temperature, and PC2 was aligned with duration of combustion. The Schwilk framework separated the fuel types according to rate of spread, and fuel loads according to total heat release. The Pausas framework was less useful in describing community-scale flammability because it removed the effects of fuel load, and there was no support for adding the ignitability axis. Both frameworks successfully predicted sapling mortality, an indicator of fire severity. In addition, the three flammability strategies proposed by Pausas et al. were not well-supported because they assumed unrealistically low heat release by ‘fast-flammable’ fuels. We conclude that the Schwilk framework is useful for conceptualizing community-scale flammability and facilitates modelling for fire management purposes, and exploration of evolutionary relationships.
Keywords:Callitris intratropica; combustibility; flammability components; grass fuels; heat release; ignitability; litter fuels; rate of spread
1. Introduction
In everyday language, flammability describes the ease with which something can be set on fire. Fire scientists adopt a narrower usage, referring to flammability as ‘the thermal degradation and combustion attributes of a fuel’ [1], resulting from its chemical composition and morphology [2]. When applied ecologically, the concept of flammability is more complex and its usage is varied. Individual plants and whole vegetated landscapes are often described as having varying degrees of flammability, which implies flammability is unidimensional and quantifiable. However, more detailed treatments of flammability recognize it does not lie on a single scale, but is, rather, ‘a group of characteristics that influence fire probability and behavior’ [3], contribute to fire hazards [4], and shape the risk of uncontrolled wildfire. Indeed, fire scientists regard flammability of a given fuel type as having multiple components, which are partially interrelated, and some even negatively so. The components of flammability are typically considered to becombustibility(associated metrics are
Fire2018,1, 14 2 of 18
rate of consumption, flame temperature and flame height),ignitability(time to ignition),sustainability (time to flame extinction and residence time) andconsumability(proportion of mass consumed) [5–7]. In addition, fuel load (above-ground biomass) is a key driver of whole-plant combustibility and sustainability [8,9] and is central to understanding community- and landscape-scale flammability.
[image:2.595.79.517.418.764.2]It is important to note that the flammability components themselves are not directly quantifiable, but are measured indirectly through various proxies (here termed ‘metrics’—see Table1). Sustainability metrics can be independent of or negatively correlated with metrics of the other components; for example, a highly combustible fuel typically sustains combustion for a shorter duration than the same quantity of a less combustible one [8,10,11]. Therefore attempts at ranking fuels on a single flammability scale hinge on the weight accorded to its various components [7], and are often also shaped by the ease or practical difficulties in measuring the associated metrics. Adding to these complications, values of flammability metrics are affected by the measurement scale (plant parts, whole plants or whole plant communities and landscapes), fuel loads and arrangement and mixtures of fuel types [6,8,10–16]. The values also vary according to factors such as weather conditions, fuel moisture content and ignition method [17–19]. To facilitate comparisons of species, there have been attempts to standardize measurements, for example, by cutting foliage to the same size and shape [20] and by developing protocols and devices that allow plants or plant parts to be ignited and burnt under standard conditions [8,18,21]. Standardization of the meaning of flammability, and identifying the best metrics to measure it, are vital to advance our understanding of how and why flammability varies in space and time, as well as facilitating comparative studies and communication amongst fire scientists, practitioners and land managers.
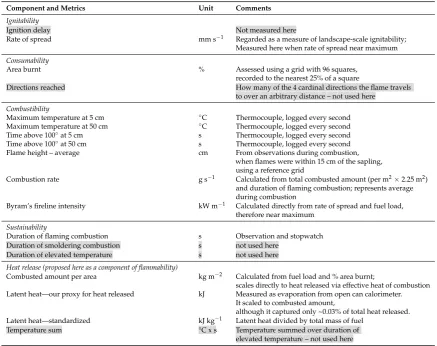
Table 1. Flammability components (in italics) and their associated metrics. All metrics used in this study are listed, as well as some commonly used ones that we did not measure (shaded grey).
Component and Metrics Unit Comments
Ignitability
Ignition delay Not measured here
Rate of spread mm s−1 Regarded as a measure of landscape-scale ignitability; Measured here when rate of spread near maximum Consumability
Area burnt % Assessed using a grid with 96 squares,
recorded to the nearest 25% of a square
Directions reached How many of the 4 cardinal directions the flame travels to over an arbitrary distance – not used here
Combustibility
Maximum temperature at 5 cm ◦C Thermocouple, logged every second Maximum temperature at 50 cm ◦C Thermocouple, logged every second
Time above 100◦at 5 cm s Thermocouple, logged every second
Time above 100◦at 50 cm s Thermocouple, logged every second
Flame height – average cm From observations during combustion,
when flames were within 15 cm of the sapling, using a reference grid
Combustion rate g s−1 Calculated from total combusted amount (per m2×2.25 m2) and duration of flaming combustion; represents average during combustion
Byram’s fireline intensity kW m−1 Calculated directly from rate of spread and fuel load, therefore near maximum
Sustainability
Duration of flaming combustion s Observation and stopwatch Duration of smoldering combustion s not used here
Duration of elevated temperature s not used here
Heat release (proposed here as a component of flammability)
Combusted amount per area kg m−2 Calculated from fuel load and % area burnt;
scales directly to heat released via effective heat of combustion Latent heat—our proxy for heat released kJ Measured as evaporation from open can calorimeter.
It scaled to combusted amount,
although it captured only ~0.03% of total heat released. Latent heat—standardized kJ kg−1 Latent heat divided by total mass of fuel
Temperature sum °C x s Temperature summed over duration of
Fire2018,1, 14 3 of 18
Recognizing that empirical evidence does not support viewing ignitability, combustibility, sustainability and consumability as independent dimensions, Schwilk [22] and Pausas et al. [3] have proposed two flammability frameworks that collapse these metrics into two and three axes (or ‘dimensions’) respectively (referred to hereafter as the ‘Schwilk’ and ‘Pausas’ frameworks). The Schwilk framework has axes representing total heat release and rate of spread, which essentially scale to the total energy release by a fire, and the rate at which it is released (power). From first principles, total energy release is a function of the amount of dry biomass consumed (which, in turn, is a function of fuel load and fuel consumability) and the net heat of combustion per mass of fuel. Although not explicitly stated by Schwilk [22], for dry, consumable fuels, total heat release is driven largely by fuel load (mass per unit area), because dry biomass releases similar amounts of heat per unit mass combusted, regardless of whether it is derived from herbaceous or woody plants [7,23,24]. Like the Schwilk framework, the Pausas framework has an axis representing rate of spread, and one related to heat release. However, Pausas et al. [3] scaled heat release to fuel mass, effectively removing the direct dependence of this axis on fuel load. Pausas et al. [3] also added a third axis, ignitability. Rate of spread is often considered an indicator of landscape-scale ignitability [6], and moderately strong correlations have been reported between rate of spread and ignition delay (an ignitability metric) in laboratory studies [11,25]. Thus two of the three axes of the Pausas framework are not independent.
Although the Schwilk framework was framed on the experimental results of Cornwell et al. [26], it is important to note that these frameworks and associated predictions have not been tested against empirical data. We assert that an effective flammability framework must have axes that are approximately independent, show interpretable trends according to fuel type and load, and allow prediction of ecological consequences (e.g., sapling survival) of burning the fuel. Here, we undertake these tests using a dataset [27] acquired from a recent field experiment [16]. This small-scale, replicated field experiment compared the effect of fuel type and fuel load on the flammability metrics of fine surface fuels, and the resulting mortality of saplings of the fire-sensitive coniferCallitris intratropica in northern Australia. Northern Australia is an ideal environment in which to conduct in situ fire experiments, because the fine surface fuels which are produced each wet season reliably cure during the following dry season, and there is little day-to-day variability in fire weather during the warm, virtually rain-free winter dry season [28].
Pausas et al. [3] also applied their framework to posit that individual plants in fire-prone ecosystems have evolved three flammability ‘strategies’ (fast flammable, hot flammable and nonflammable), corresponding to high flame rate of spread, high heat release and low ignitability, respectively. They suggested that these strategies increase survival and reproduction following fire, and represent alternative ways to succeed in a fire-prone environment. The Bowman and Prior data [27] are ideally suited for testing of these three flammability strategies, because the three types of fine surface fuels in the study correspond to the three Pausas et al. [3] strategies: (1) very well-aerated tall tropical grass fuels (‘fast flammable’), which burn rapidly and are typical of grassy landscapes such as savannas; (2) well-aerated, eucalypt litter fuels (‘hot flammable’), which burn more slowly and less completely than grass fuels; and (3) dense mats of conifer litter beneath stands ofC. intratropica(‘nonflammable’), which are difficult to ignite and tend to burn incompletely [11,19,29–33]. Furthermore, these data also include mixtures of contrasting fuel types (grasses and litter fuels). Our focus is on surface fuels, and we acknowledge there are limitations to the extent to which the results can be extrapolated to other ecosystems such as forests, which also have complex arrays of live canopy fuels vertically separated from surface fuels, which can include vey coarse woody fuels. In addition, fuel moisture has a large influence on flammability [19], but was not considered in this study of dry surface fuels.
Fire2018,1, 14 4 of 18
and Pausas flammability frameworks with another putative framework suggested by the PCA of our data, the temperature-duration framework. This is based on two commonly used flammability metrics for surface fuels: maximum temperature at 5-cm height (representing the rate of energy release) and the duration over which flaming occurs, which are fundamentally independent [11]. We also assess how well each framework predicted the mortality ofC. intratropicasaplings as a result of burning the various fuels. Finally, we apply the Schwilk framework to the Bowman and Prior data [27] and data from other studies to illustrate the differences in flammability between four contrasting ecosystems in northern Australia, and to discuss the flammability strategies proposed by Pausas et al. [3].
2. Materials and Methods
2.1. Outline of Experimental Methods
The methods used for the fire experiment are described in detail by Bowman et al. [16], and briefly summarized here. The study site was aC. intratropicaplantation, abandoned for economic reasons, located at 12.18◦S, 131.02◦E (about 40 km from Darwin), in the Northern Territory, Australia. There were 220 experimental plots, each 1.5 m×1.5 m in area and centered on aC. intratropicasapling (0.3–2.5 m tall). Fuel treatments were stratified according to sapling height. These plots represented 20 replicates of 11 fuel treatments (i.e., fuel type×fuel load combinations). One fuel treatment was the ambientC. intratropicaleaf litter, which had an average load of 1.0 kg m−2. For the other fuel treatments, theC. intratropicalitter was scraped away and a weighed mass of grass, eucalypt litter or a 50:50 mix of grass and eucalypt litter was then placed on the soil surface within the 2.25 m2 area of each experimental plot. The grass was spread on the soil surface to simulate a fuel bed of the native tall tropical grasses, which typically collapse during the dry season. The eucalypt litter and grass–litter mix were spread loosely to resemble the well-aerated, naturally occurring fuel beds within the eucalypt-dominated tropical savannas of northern Australia. The fuels used in the experiment were air dry (5.2% moisture content), as is typical of fine dead fuels during the dry season in Australian tropical savannas. Fuel moisture content was measured on a total of 199 subsamples with an average fresh weight of 50 g, which were oven-dried for a minimum of 24 h. The moisture content did not differ significantly amongst fuel types. Fuel loads (expressed on a dry weight basis) for the grass and the eucalypt litter fuel treatments were 0.24, 0.47, 0.71 and 0.95 kg m−2, while for the 50:50 mixes of grass and eucalypt litter fuels only the extremes of these loads were used (i.e., total loads of 0.24 and 0.95 kg m−2), due to time constraints.
Weather conditions were measured using a weather station (Kestrel 4000; Nielson-Kellerman Co., Boothwyn, PA, USA), which was placed at 1.3 m height, 0.5 m from the edge of each experimental burn, in the shade and exposed to wind. Wind speed, air temperature and humidity were measured every 10 s, and averaged for the duration of each experimental combustion. During measurements, wind speed ranged from 0 to 4.3 km h−1, temperature from 24.9 to 33.8◦C and vapor pressure deficit from 9 to 41 hPa [16].
Fire2018,1, 14 5 of 18
total mass of fuel combusted (r2= 0.74 for the area –based estimate,vsmeasured mass loss on a subset of 150 plots). The rate of combustion was calculated from the total mass of fuel combusted and the duration of flaming combustion. Byram’s fireline intensity was calculated according to the equation:
I=H*W*r
whereIis fire intensity (kW m−1),His the net heat of combustion,wis the mass of fuel combusted (kg m−2) andris the rate of spread of the fire (m s−1) [35].
Total heat release was a key metric in evaluating the Schwilk and Pausas frameworks, and we described it in two ways:
1) Theoretically, as the product of the total mass of fuel consumed and the net heat of combustion (H). For all fuel types, a value forHof 17.8 MJ kg−1was assumed, as in other savanna studies [23,36]. This is within the range of values measured for dry savanna leaf material [29] and close to the value of 18.6 MJ kg−1assumed for biomass fuels by Rothermel [37].
2) Empirically, using evaporation of water during each fire from an open can calorimeter, and the latent heat of vaporization of water (2.26 MJ kg−1). We half-filled open aluminum cans with water and placed them on the ground near the center of each plot, and weighed them immediately before and after the fire, following Pérez and Moreno [38]. We then calculated latent heat captured by the cans as the mass of water lost multiplied by the latent heat required to evaporate it. Although the cans captured only a fraction of a percent of the theoretical energy released (see below), they provide a proxy for the energy released by the fires that is independent of assumptions about the heat of combustion. For our statistical evaluation of the Schwilk and Pausas frameworks, we used the metric of latent heat, because this avoids making assumptions about the heat of combustion of the fuels. Overall, there was a good correlation between the two methods used to determine heat release (r= 0.82). The theoretical total heat release calculated from the biomass consumed and heat of combustion for the highest (1.0 kg m−2) fuel loads over the 2.25 m2area of each plot, was 38 MJ for grass, 37 MJ for the grass–litter mix and 29 MJ for eucalypt litter, reflecting the less complete consumption of the eucalypt litter. By comparison, the average latent heat captured by our water-filled cans at the highest fuel loads was 9.0 kJ for grass, 10.7 kJ for the grass–litter mix and 9.9 kJ for eucalypt litter (overall this represented ~0.03% of the theoretical total heat release, reflecting that the cans receive only a small amount of the total heat, and that energy is also required to raise the water temperature in the can to boiling). Our latent heat metric probably underestimates heat release from grass relative to litter fuels because the water-filled cans were placed on the ground, but a greater proportion of the heat was released above ground level in grass fires than litter fires, as shown by higher flames and higher temperatures at 50 cm height [11].
Prior to burning, we measured the height of each targetedC. intratropicasapling, and 10 months after burning and following a full wet season, we assessed its survival, controlling for height. We used the percentage deviance explained by the axes of the flammability frameworks in predicting sapling survival to compare their usefulness in describing the ecological impact of burning (e.g., fire severity sensuKeeley [39]) in the various fuel treatments.
2.2. Statistical Analyses
Fire2018,1, 14 6 of 18
Weather conditions were not considered in our analyses after we found they had only a small effect on our measurements (2% of the deviance in both the first and second principal component axes (referred to as PC1 and PC2, respectively), compared with fuel treatment, which explained 88% of the deviance in PC1 and 54% of the deviance in PC2) (TableA1).
We used the PCA of the combined data as the benchmark by which to assess the Schwilk and Pausas frameworks. We evaluated three putative flammability frameworks: (1) the Schwilk framework (rate of spread and total heat release); (2) two axes of the Pausas framework (rate of spread and total heat release standardized for fuel load); and (3) the temperature-duration framework, with axes of maximum temperature at 5 cm height and duration of flaming combustion. Our evaluation was based on the following criteria: (a) independence of the two axes in each framework, assessed according to the Pearson correlation coefficients; (b) clear discrimination of fuel types and fuel loads, using generalized linear modelling to compare the percentage deviance explained relative to the null model of models with the terms (i) fuel load * type, (ii) fuel load and (iii) fuel type; (c) interpretability, based on how easy it was to interpret patterns in the ordination plots of the various frameworks; and (d) power in predicting sapling survival after burning the fuel, using binomial generalized linear models with a logit link. The response variable was status (binary—alive or dead), and the explanatory variables were the pairs of metrics used in the framework, together with sapling height as a control for sapling size. The percentage deviance explained, relative to the sapling height-only model, was calculated. All metrics except PC1 and PC2 were log transformed to normalize the data.
3. Results
3.1. Principal Components Analysis
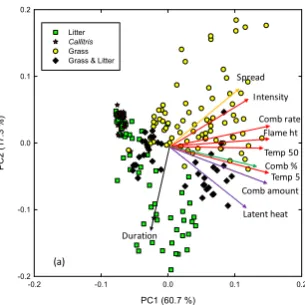
Most flammability metrics were strongly inter-correlated (TableA2), and PCA of the full dataset showed that flammability could be summarized by two orthogonal axes, which explained a combined total of 78% of the variation in the data (PC1 = 61%, PC2 = 17%; Figure1). PC1 had high loadings on flame height, rate of combustion, amount combusted and maximum temperature (both 5 cm and 50 cm height), and therefore can be described as representing combustibility, while PC2 had the highest loading on duration of combustion (Figure1; TableA3). The other components had a standard deviation <1, and thus were considered unimportant.
Fire 2018, 2, x FOR PEER REVIEW 6 of 18
axes (referred to as PC1 and PC2, respectively), compared with fuel treatment, which explained 88% of the deviance in PC1 and 54% of the deviance in PC2) (Table A1).
We used the PCA of the combined data as the benchmark by which to assess the Schwilk and Pausas frameworks. We evaluated three putative flammability frameworks: (1) the Schwilk framework (rate of spread and total heat release); (2) two axes of the Pausas framework (rate of spread and total heat release standardized for fuel load); and (3) the temperature-duration framework, with axes of maximum temperature at 5 cm height and duration of flaming combustion. Our evaluation was based on the following criteria: (a) independence of the two axes in each framework, assessed according to the Pearson correlation coefficients; (b) clear discrimination of fuel types and fuel loads, using generalized linear modelling to compare the percentage deviance explained relative to the null model of models with the terms (i) fuel load * type, (ii) fuel load and (iii) fuel type; (c) interpretability, based on how easy it was to interpret patterns in the ordination plots of the various frameworks; and (d) power in predicting sapling survival after burning the fuel, using binomial generalized linear models with a logit link. The response variable was status (binary—alive or dead), and the explanatory variables were the pairs of metrics used in the framework, together with sapling height as a control for sapling size. The percentage deviance explained, relative to the sapling height-only model, was calculated. All metrics except PC1 and PC2 were log transformed to normalize the data.
3. Results
3.1. Principal Components Analysis
[image:6.595.222.375.502.655.2]Most flammability metrics were strongly inter-correlated (Table B1), and PCA of the full dataset showed that flammability could be summarized by two orthogonal axes, which explained a combined total of 78% of the variation in the data (PC1 = 61%, PC2 = 17%; Figure 1). PC1 had high loadings on flame height, rate of combustion, amount combusted and maximum temperature (both 5 cm and 50 cm height), and therefore can be described as representing combustibility, while PC2 had the highest loading on duration of combustion (Figure 1; Table C1). The other components had a standard deviation <1, and thus were considered unimportant.
Figure 1. Principal components analysis of flammability variables. The biplot of PC1 and PC2, shows individual data points categorized according to fuel type; ‘Callitris’ refers to Callitris litter, and ‘Litter’ to eucalypt litter. Note the cluster of Callitris intratropica litter plots and some eucalypt plots to the left of the biplot, representing fuels that burnt incompletely. Arrow color indicates the related flammability component (black—sustainability; pink—heat release, red—combustibility; green—consumability and blue—ignitability at a landscape scale). The effect of fuel load is shown using the same ordination plane in Figure 2a.
PC1 (60.7 %)
-0.2 -0.1 0.0 0.1 0.2
P C 2 (1 7.3 % ) -0.2 -0.1 0.0 0.1 0.2 Litter Callitris Grass Grass & Litter
Spread Intensity Comb rate Flame ht Temp 50 Comb % Temp 5 Latent heat Duration Comb amount (a)
Fire2018,1, 14 7 of 18
Fuel type explained 51% of the deviance for PC1 and 24% of the deviance for PC2, compared with 13% and 7% respectively for fuel load (Table2). The PCA plot showed clear separation according to fuel type, and the grass–litter mix plots were generally located between the grass and the eucalypt litter plots (Figure1). There was a cluster of points representing plots that burnt incompletely, which were mostly theCallitrislitter plots as well as some with low loads of eucalypt litter. There was a strongly supported interaction between fuel type and fuel load, with the interactive model explaining 87% and 50% of the deviance in PC1 and PC2 respectively (Table2). Increasing fuel loads were mainly reflected in increases in PC1 in grass fuels and the grass–litter mix, but to decreases in PC2 in litter fuels (Figure2a).
Fire 2018, 2, x FOR PEER REVIEW 7 of 18
[image:7.595.140.456.223.530.2]Fuel type explained 51% of the deviance for PC1 and 24% of the deviance for PC2, compared with 13% and 7% respectively for fuel load (Table 2). The PCA plot showed clear separation according to fuel type, and the grass–litter mix plots were generally located between the grass and the eucalypt litter plots (Figure 1). There was a cluster of points representing plots that burnt incompletely, which were mostly the Callitris litter plots as well as some with low loads of eucalypt litter. There was a strongly supported interaction between fuel type and fuel load, with the interactive model explaining 87% and 50% of the deviance in PC1 and PC2 respectively (Table 2). Increasing fuel loads were mainly reflected in increases in PC1 in grass fuels and the grass–litter mix, but to decreases in PC2 in litter fuels (Figure 2a).
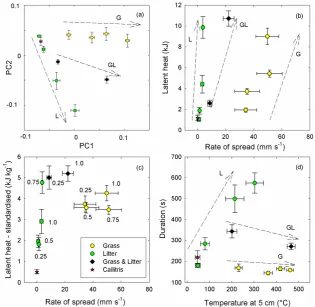
Figure 2. Differences amongst fuel types and loads according to (a) PCA and the (b) Schwilk, (c) Pausas and (d) temperature-duration flammability frameworks. Fuel type is indicated by the symbols, and the effects of increasing loads are indicated by the arrows for each type (G = grass, GL = grass and eucalypt litter and L = eucalypt litter). Trends with increasing fuel loads were inconsistent in (c), so fuel loads (in kg m−2) are indicated by numbers. The Callitris intratropica litter
fuel load averaged 1.0 kg m−2. Error bars represent standard errors.
The PCA could effectively separate live and dead saplings (Figure 3a). Relative to the tree-height-only model (which explained 7.4% of the deviance in sapling mortality), the first two components of the PCA explained 79% of the deviance in sapling mortality.
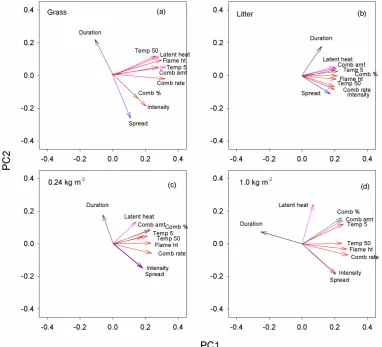
There were broad similarities among PCAs of the data subsets with fixed fuel types or fixed fuel loads. PC1 was consistently aligned with combustibility variables such as flame height, temperature and rate of combustion (Figure 4). When heat release varied among plots (due to variable fuel load and/or consumability), PC2 was most strongly correlated with duration and rate of spread, but when total heat release was similar (i.e., the 1.0 kg m−2 fuel load, which had near-complete consumption), duration was instead aligned with PC1 (Figure 4d). For all data subsets, the positions of the metrics
Figure 2.Differences amongst fuel types and loads according to (a) PCA and the (b) Schwilk, (c) Pausas and (d) temperature-duration flammability frameworks. Fuel type is indicated by the symbols, and the effects of increasing loads are indicated by the arrows for each type (G = grass, GL = grass and eucalypt litter and L = eucalypt litter). Trends with increasing fuel loads were inconsistent in (c), so fuel loads (in kg m−2) are indicated by numbers. TheCallitris intratropicalitter fuel load averaged 1.0 kg m−2. Error bars represent standard errors.
The PCA could effectively separate live and dead saplings (Figure 3a). Relative to the tree-height-only model (which explained 7.4% of the deviance in sapling mortality), the first two components of the PCA explained 79% of the deviance in sapling mortality.
Fire2018,1, 14 8 of 18
metrics (Figure4). Spread and duration were opposed to each other for grass fuels and high fuel loads, but were almost orthogonal for litter fuels, for which all metrics were compressed into a smaller portion of the ordination space. Combusted amount (a proxy for heat release) and rate of spread were almost orthogonal for grass fuels and the fixed, high (1.0 kg m−2) fuel loads, but not with eucalypt litter fuels or, to a lesser extent, low fuel loads.
Fire 2018, 2, x FOR PEER REVIEW 8 of 18
relative to each other were similar, with rate of spread and duration bracketing the other flammability metrics (Figure 4). Spread and duration were opposed to each other for grass fuels and high fuel loads, but were almost orthogonal for litter fuels, for which all metrics were compressed into a smaller portion of the ordination space. Combusted amount (a proxy for heat release) and rate of spread were
almost orthogonal for grass fuels and the fixed, high (1.0 kg m−2) fuel loads, but not with eucalypt
[image:8.595.109.488.167.539.2]litter fuels or, to a lesser extent, low fuel loads.
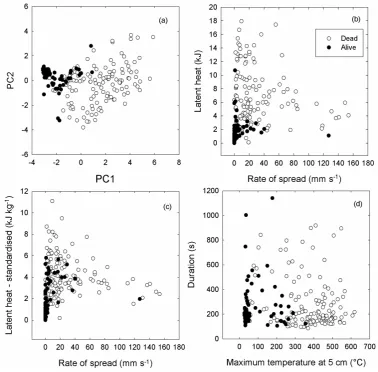
Figure 3. Survival of saplings in relation to (a) PCA and the (b) Schwilk, (c) Pausas and (d) temperature-duration flammability frameworks. Percent deviance explained by the four frameworks was 78%, 63%, 52%, and 75%, respectively.
3.2. Evaluation of Flammability Frameworks
The metrics used as axes in the Schwilk, Pausas, and temperature-duration frameworks were
found to be close to orthogonal, with R values of 0.16, 0.16, and −0.01 respectively (evaluation
criterion (a)). These frameworks also all clearly separated the fuel types (criterion (b)), which formed
distinct clusters (except that Callitris litter was not clearly distinguishable from the lowest load of
eucalypt litter) (Figure 2). Of the metrics used as axes in the three flammability frameworks, the effect of fuel type was strongest for rate of spread (72% deviance explained), while that of fuel load was strongest for latent heat (11% deviance explained) (Table 2). Increasing fuel loads showed clear trends within a fuel type for the Schwilk and temperature duration, but not the Pausas, frameworks (criterion (b)).
However, only under the Schwilk framework were these trends similar for the contrasting fuel types (Figure 2b). The divergence was especially apparent under the temperature-duration framework, because duration of combustion increased with litter fuels and was almost constant for
Figure 3.Survival of saplings in relation to (a) PCA and the (b) Schwilk, (c) Pausas and (d) temperature-duration flammability frameworks. Percent deviance explained by the four frameworks was 78%, 63%, 52%, and 75%, respectively.
3.2. Evaluation of Flammability Frameworks
The metrics used as axes in the Schwilk, Pausas, and temperature-duration frameworks were found to be close to orthogonal, withRvalues of 0.16, 0.16, and−0.01 respectively (evaluation criterion (a)). These frameworks also all clearly separated the fuel types (criterion (b)), which formed distinct clusters (except thatCallitrislitter was not clearly distinguishable from the lowest load of eucalypt litter) (Figure2). Of the metrics used as axes in the three flammability frameworks, the effect of fuel type was strongest for rate of spread (72% deviance explained), while that of fuel load was strongest for latent heat (11% deviance explained) (Table2). Increasing fuel loads showed clear trends within a fuel type for the Schwilk and temperature duration, but not the Pausas, frameworks (criterion (b)).
Fire2018,1, 14 9 of 18
(Figure2d). Our generalized linear modelling thus showed strong support for an interaction between fuel type and fuel load (Table2), with the interactive model ranked highest for all the metrics used as axes in the three flammability frameworks. The explanatory power of the interactive model was especially high for rate of spread (78% deviance explained), and maximum temperature at 5 cm (71% deviance explained) (Table2). The pattern of results were easiest to interpret in the Schwilk framework, because variation in the rate of spread axis corresponded primarily to fuel type and variation in the latent heat axis corresponded to fuel load. By contrast, in the temperature-duration framework, both axes were strongly influenced by both fuel type and load, complicating interpretation (criterion (c)).
All frameworks were useful in predicting sapling mortality (criterion (d)), and showed clear clustering of surviving saplings (Figure3). Relative to the tree-height-only model (7.4% deviance explained), the temperature-duration framework explained 75% of the deviance in sapling mortality, compared with 63% by the Schwilk framework and only 52% by the two axes we considered of the Pausas framework.
Fire 2018, 2, x FOR PEER REVIEW 9 of 18
grass fuels (Figure 2d). Our generalized linear modelling thus showed strong support for an interaction between fuel type and fuel load (Table 2), with the interactive model ranked highest for all the metrics used as axes in the three flammability frameworks. The explanatory power of the interactive model was especially high for rate of spread (78% deviance explained), and maximum temperature at 5 cm (71% deviance explained) (Table 2). The pattern of results were easiest to interpret in the Schwilk framework, because variation in the rate of spread axis corresponded primarily to fuel type and variation in the latent heat axis corresponded to fuel load. By contrast, in the temperature-duration framework, both axes were strongly influenced by both fuel type and load, complicating interpretation (criterion (c)).
[image:9.595.107.490.274.621.2]All frameworks were useful in predicting sapling mortality (criterion (d)), and showed clear clustering of surviving saplings (Figure 3). Relative to the tree-height-only model (7.4% deviance explained), the temperature-duration framework explained 75% of the deviance in sapling mortality, compared with 63% by the Schwilk framework and only 52% by the two axes we considered of the Pausas framework.
Figure 4. Variation in principal components analyses according to fuel type and fuel load. (a) grass fuels only, (b) eucalypt litter fuels only, (c) fixed, low fuel load (0.24 kg m-2) only, and (d) fixed, high
fuel load (1.0 kg m−2) only. ‘Comb’ means combustion. Combustibility metrics are indicated by the
red arrows, ignitability by the blue arrow, consumability by the green arrow, heat release by the pink arrows and sustainability by the black arrow.
Fire2018,1, 14 10 of 18
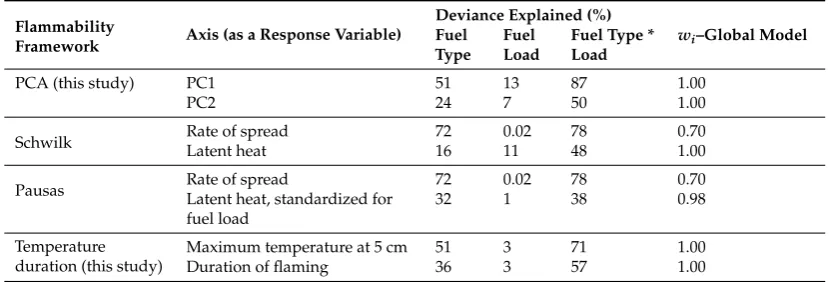
Table 2.The deviance explained by models containing fuel type, fuel load and their interaction, for the first two principal components of the flammability PCA. The deviance explained is relative to the null (intercept only) model, and the ‘*’ represents main effects and their interaction.wiis the Akaike weight received by the global model (fuel type * fuel load) in the candidate set containing models with all combinations of fuel type and fuel load.
Flammability
Framework Axis (as a Response Variable)
Deviance Explained (%)
wi–Global Model
Fuel Type
Fuel Load
Fuel Type * Load
PCA (this study) PC1 51 13 87 1.00
PC2 24 7 50 1.00
Schwilk Rate of spreadLatent heat 7216 0.0211 7848 0.701.00
Pausas Rate of spreadLatent heat, standardized for 72 0.02 78 0.70
fuel load
32 1 38 0.98
Temperature duration (this study)
Maximum temperature at 5 cm 51 3 71 1.00
Duration of flaming 36 3 57 1.00
4. Discussion
4.1. Flammability Components and Metrics
Our analysis revealed that the individual flammability metrics occupied a large part of the ordination plane, rather than clustering closely to the first two PCA axes. Notably, the flammability metrics are positioned in a broadly consistent way across a range of studies (Figures1and4of this study and [8,10,11,13,14,26]), with duration of combustion and rate of spread bracketing the combustibility, consumability and heat release metrics, as summarized in Figure5. White and Zipperer [7] included four heat release metrics under the flammability component ‘sustainability’ (area or volume consumed; total heat released; heat of combustion and oxygen index), but total heat release is a product of both rate of heat release (combustibility) and duration of heat release (sustainability), and this is reflected in the intermediate position that heat release and latent heat occupy in our PCAs.
Our results also suggest total heat release is an important and easily measured aspect of flammability that scales to both fuel load and consumability. Schwilk (2015) used heat release as one of two axis of a model that can summarize community-scale flammability and Pausas et al. (2017) used heat release (albeit standardized for fuel load) as one of three axes in their model of plant flammability. Building on these studies, we suggest heat release could be considered a key component of a fuel array, in addition the other accepted measures of ‘ignitability’, ‘combustibility’, ‘sustainability’ and ‘consumability’ in comparative ecological studies and quantification of fire hazard.The ecological importance of total heat release is apparent when considering a landscape with a heavy load of grassy fuels, which would score more highly on all flammability metrics than one with a sparse layer of the same grassy fuels.
Fire2018,1, 14 11 of 18
PC1 (60.7 %)
-0.2 -0.1 0.0 0.1 0.2
P
C
2
(17.
3
%
)
-0.2 -0.1 0.0 0.1 0.2
Litter
Callitris
Grass Grass & Litter
P
C2
PC1
Ignitability
Combustibility
Consumability
Heat release
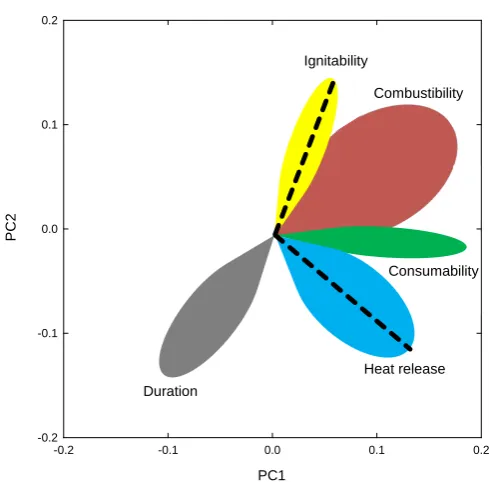
[image:11.595.173.418.86.327.2]Duration
Figure 5.Schematic diagram showing generalized relationships between flammability components (shaded areas), as well as the two axes of the Schwilk framework (dashed lines), plotted on the ordination space of the PCA of all the fuel types and loads (Figure1). The angles between the components vary according to the context of each study, but the relative positions are broadly consistent across studies (e.g., combustibility lies between duration and ignitability).
4.2. Variation in Flammability Metrics and Flammability Frameworks
The empirical data of Bowman and Prior [27] enable evaluation of deductive conceptual models of flammability, such as the Schwilk and Pausas frameworks, as they apply to dry surface fuels. Our PCA of these data showed that a broad range of routinely measured flammability metrics can be described by two major axes, which clearly segregated variation in fuel type and fuel load, as well as fire severity as measured by sapling mortality. Therefore, in principle it is possible to describe flammability according to a two dimensional framework.
Schwilk’s two proposed axes of flammability, namely rate of spread/ intensity and total heat release, aligned reasonably well with the two principal components extracted by the PCA. The rate of spread axis was primarily influenced by fuel type, while total heat release was constrained by fuel load and consumability. Although rate of spread and total heat release were not the metrics most closely aligned with the principal components of the PCA, they have the practical advantage that fuel load directly constrains total heat release but has very little influence on rate of spread. Thus the rate of spread axis captures an inherent property of the fuel, almost independent of fuel load, whereas total heat release is fundamentally influenced by the amount of fuel present. It is also worth noting that under both Schwilk and Pausas frameworks, for a given amount of fuel combusted, the concept of ‘flammability’ simplifies to rate of spread, a key ignitability metric for plant communities [6]. This is very much in keeping with the everyday use of the term ‘flammable’ to mean ‘ignitable’.
Fire2018,1, 14 12 of 18
and this can indeed be regarded as an ignitability metric at a landscape scale [6]. Second, total heat release standardized for fuel loads provided little information that was not already captured by rate of spread, whereas unstandardized heat release (as used by Schwilk) describes a very important aspect of fire, albeit not of the inherent flammability of the fuel itself. For fine, dry fuels, heat of combustion and consumability (captured by Pausas’s standardized heat release axis) typically vary less than fuel load, so the heat release axis of the Schwilk framework should offer better separation of fuels and prediction of their ecological effects. Indeed, sapling mortality was predicted more accurately by the other frameworks than by the Pausas one [6].
The temperature-duration framework had axes that were closely related to PC1 and PC2, and thus responded strongly to variation in fuel type and fuel load. It also better predicted sapling mortality than did the Schwilk or Pausas frameworks. Its disadvantage relative to the Schwilk framework is that both axes are strongly influenced by fuel type and fuel load, whereas the Schwilk framework largely separates these influences (Figure2). We consider the slightly higher explanatory power of the temperature-duration framework relative to the Schwilk framework is outweighed by the benefits the Schwilk framework provides in interpreting the effects of fuel type and fuel load on community-level flammability.
Fire2018,1, 14 13 of 18
Spread vs Load
35 30 25 20 15 10 5 0
0 200 400 600 800 1000 1200 1400
Rate of spread (mm s-1)
Flame spread rate (m min-1) (a)
Wet eucalypt forest Eucalypt savanna
- Gamba grass
Shrubland
Dry eucalypt forest
Eucalypt savanna - native grasses
Callitris
(b)
Hot flammable
Non
flammable flammable Fast
[image:13.595.102.495.90.286.2]H ea t re lea s e ( MJ m -2 ) H ea t re lea se (k J g -1)
Figure 6.(a) Ecosystem flammability plotted according to the Schwilk framework [22], using north Australian examples. Values are for surface fires and are indicative, based on the results from this study and [48–52]. In all cases we assume low wind speeds (<10 km/h), dry fuels, and consumption levels as follows: grassy savanna fuels 98% (this study), eucalypt litter 80% (this study) and shrubs 50% [53]. (b) The Pausas et al. framework [3], showing their three flammability ‘strategies’: nonflammable, hot flammable and fast flammable. The pale colors show their posited locations in their ordination space. Dashed arrows point to the location (in deeper colors) where our results indicate these ‘strategies’ lie. Note that Pausas et al. standardized heat release to fuel mass (the units here are as presented by them), whereas Schwilk used total heat release (which we have standardized for ground area).
4.3. Landscape Flammability and Evolutionary Strategies
Our study showed that fuel type (grass vs. litter) is a key driver of flammability, and under our experimental conditions, it was more important than fuel load in determining how fine surface fuels burn. Fuel type affected all flammability metrics, and alone accounted for 51% of the variance in PC1 and 24% in PC2. In addition, the effects of increasing fuel load were different for the contrasting fuel types – for grass, there was a large increase in maximum temperature, but this was not so pronounced for eucalypt litter. Conversely, duration of flaming combustion was sensitive to fuel load for eucalypt litter, but not for grass.
Some researchers have hypothesized that plant traits that promote a fast rate of fire spread could have evolved to protect plants by minimizing times to which they are exposed to heat [3,54]. However, we found a positive, albeit modest, relationship between rate of spread and total heat release (amount consumed), especially in eucalypt litter fuels (r= 0.37 overall, 0.54 in eucalypt litter fuels), consistent with the observation that rate of spread is positively correlated with the amount of fine fuel in eucalypt forests [55]. Although rate of spread was weakly and negatively correlated with duration of flaming (r=−0.31 overall), we consider this unlikely to outweigh the higher maximum temperatures, flame heights and intensities also associated with a fast rate of spread. We therefore found little support for a protective effect of a fast rate of spread in this study system.
Fire2018,1, 14 14 of 18
be different with coarser fuels or during smoldering combustion than with the fine surface fuels used in this study. Regardless, grass fuels—which are the prevailing fuel type across most of the Australian continent [56]—represent the most combustible form of biomass. This draws into question Pausas et al.’s notion [3] that combusting ‘nonflammable’ plants could generate as much heat as burning an equivalent mass of grass (as implied by their Figure1).
5. Conclusions
Research on flammability has been handicapped by unclear definitions of flammability, and the fact it has several partially correlated components, which in turn have various associated metrics. Schwilk [22] has identified two key metrics (rate of spread and total heat release) that can be successfully used as a framework to describe the flammability of varying loads of contrasting fuels. Using an experimental approach, we have demonstrated its utility for describing flammability of surface fuels in some important flammable ecosystems. However, for forested ecosystems that are subject to canopy fires a far more complex experimental approach is required to describe and test conceptual models of community flammability. Describing flammability according to only two axes facilitates modelling for fire and ecosystem management purposes, and exploration of evolutionary relationships, and is recommended where a simple quantitative approach is paramount. We also found merit in recognizing the traditional flammability components of ignitability, combustibility, consumability and sustainability, as well as total heat release, which allows for the key role of fuel load in determining community flammability.
Author Contributions:D.B. and B.M. conceived and designed the experiments; L.P. analyzed the data; L.P. led the writing, with substantial contributions from D.B and B.M.
Acknowledgments:We thank Cédric Haverkamp and Karl Rann for fieldwork under difficult conditions. This project was funded by an Australian Research Council grant (DP150101777).
Conflicts of Interest:The authors declare no conflicts of interest.
Appendix A
Table A1.Summary of modelling to determine the relative influence of fuel treatment (the 11 fuel type and load combinations), air temperature, vapor pressure deficit and wind speed on combustion.w+ values for the model terms were calculated using all-subsets regression. Values >0.73 were considered statistically important [57], and are shown in bold.
Response Variable
PC1 PC2
Model term w+
Fuel treatment 1.00 1.00
Air temperature 0.70 0.32
Vapor pressure deficit 0.99 0.73
Wind speed 0.28 0.94
Deviance Explained (%)
Model with all terms 90 56
Fuel only model (categorical) 88 54 Fuel type * load (interactive) 87 50
Fire2018,1, 14 15 of 18
[image:15.842.93.752.169.328.2]Appendix B
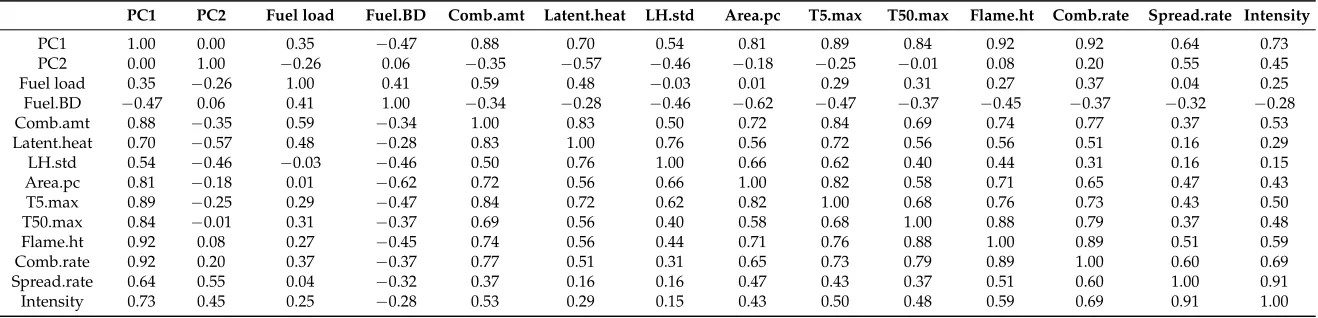
Table A2.Correlation matrix for selected flammability metrics. PC1 and PC2 are the first and second principal components of the PCA, Fuel.BD is bulk density, Comb.amt is amount consumed, LH.std is latent heat standardized for fuel load, Area.pc is percent area burnt, Comb.rate is rate of combustion, T5.max and T50.max are maximum temperatures at 5 cm and 50 cm height, respectively.
PC1 PC2 Fuel load Fuel.BD Comb.amt Latent.heat LH.std Area.pc T5.max T50.max Flame.ht Comb.rate Spread.rate Intensity
PC1 1.00 0.00 0.35 −0.47 0.88 0.70 0.54 0.81 0.89 0.84 0.92 0.92 0.64 0.73
PC2 0.00 1.00 −0.26 0.06 −0.35 −0.57 −0.46 −0.18 −0.25 −0.01 0.08 0.20 0.55 0.45
Fuel load 0.35 −0.26 1.00 0.41 0.59 0.48 −0.03 0.01 0.29 0.31 0.27 0.37 0.04 0.25
Fuel.BD −0.47 0.06 0.41 1.00 −0.34 −0.28 −0.46 −0.62 −0.47 −0.37 −0.45 −0.37 −0.32 −0.28
Comb.amt 0.88 −0.35 0.59 −0.34 1.00 0.83 0.50 0.72 0.84 0.69 0.74 0.77 0.37 0.53
Latent.heat 0.70 −0.57 0.48 −0.28 0.83 1.00 0.76 0.56 0.72 0.56 0.56 0.51 0.16 0.29
LH.std 0.54 −0.46 −0.03 −0.46 0.50 0.76 1.00 0.66 0.62 0.40 0.44 0.31 0.16 0.15
Area.pc 0.81 −0.18 0.01 −0.62 0.72 0.56 0.66 1.00 0.82 0.58 0.71 0.65 0.47 0.43
T5.max 0.89 −0.25 0.29 −0.47 0.84 0.72 0.62 0.82 1.00 0.68 0.76 0.73 0.43 0.50
T50.max 0.84 −0.01 0.31 −0.37 0.69 0.56 0.40 0.58 0.68 1.00 0.88 0.79 0.37 0.48
Flame.ht 0.92 0.08 0.27 −0.45 0.74 0.56 0.44 0.71 0.76 0.88 1.00 0.89 0.51 0.59
Comb.rate 0.92 0.20 0.37 −0.37 0.77 0.51 0.31 0.65 0.73 0.79 0.89 1.00 0.60 0.69
Spread.rate 0.64 0.55 0.04 −0.32 0.37 0.16 0.16 0.47 0.43 0.37 0.51 0.60 1.00 0.91
Fire2018,1, 14 16 of 18
[image:16.595.168.429.182.346.2]Appendix C
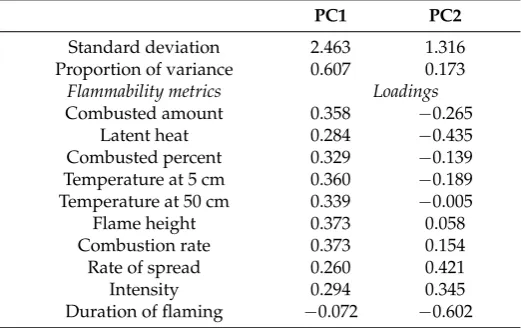
Table A3. Results of principal components analysis, showing standard deviation, proportion of variance explained, and variable loadings for the first two principal components, PC1 and PC2. The remaining principal components had a standard deviation <1.0, so were not considered statistically important [34].
PC1 PC2
Standard deviation 2.463 1.316
Proportion of variance 0.607 0.173
Flammability metrics Loadings
Combusted amount 0.358 −0.265
Latent heat 0.284 −0.435
Combusted percent 0.329 −0.139
Temperature at 5 cm 0.360 −0.189 Temperature at 50 cm 0.339 −0.005
Flame height 0.373 0.058
Combustion rate 0.373 0.154
Rate of spread 0.260 0.421
Intensity 0.294 0.345
Duration of flaming −0.072 −0.602
References
1. Sullivan, A.L. Inside the inferno: Fundamental processes of wildland fire behaviour. 1. Combustion chemistry and heat release.Curr. For. Rep.2017,3, 132–149. [CrossRef]
2. Sullivan, A.L. Inside the inferno: Fundamental processes of wildland fire behaviour. 2. Heat transfer and interactions.Curr. For. Rep.2017,3, 150–171. [CrossRef]
3. Pausas, J.G.; Keeley, J.E.; Schwilk, D.W. Flammmability as an ecological and evolutionary driver. J. Ecol.
2017,105, 289–297. [CrossRef]
4. McCarthy, G.J.; Tolhurst, K.G.; Chatto, K.Overall Fuel Hazard Guide, 3rd ed.; Department of Natural Resources and Environment: East Melbourne, Australia, 1999.
5. Anderson, H.E. Forest fuel ignitibility.Fire Tech.1970,6, 312–319. [CrossRef]
6. Gill, A.M.; Zylstra, P. Flammability of Australian forests.Aust. For.2005,68, 87–93. [CrossRef]
7. White, R.H.; Zipperer, W.C. Testing and classification of individual plants for fire behaviour: Plant selection for the wildland-urban interface.Int. J. Wildland Fire2010,19, 213–227. [CrossRef]
8. Simpson, K.J.; Ripley, B.S.; Christin, P.-A.; Belcher, C.M.; Lehmann, C.E.R.; Thomas, G.H.; Osborne, C.P. Determinants of flammability in savanna grass species.J. Ecol.2016,104, 138–148. [CrossRef] [PubMed] 9. Padullés Cubino, J.; Buckley, H.L.; Day, N.J.; Pieper, R.; Curran, T.J. Community-level flammability declines
over 25 years of plant invasion in grasslands.J. Ecol.2018. [CrossRef]
10. De Magalhães, R.M.Q.; Schwilk, D.W. Leaf traits and litter flammability: Evidence for non-additive mixture effects in a temperate forest.J. Ecol.2012,100, 1153–1163.
11. Prior, L.D.; Murphy, B.P.; Williamson, G.J.; Cochrane, M.A.; Jolly, W.M.; Bowman, D.M.J.S. Does inherent flammability of grass and litter fuels contribute to continental patterns of landscape fire activity?J. Biogeogr.
2017,44, 1225–1238. [CrossRef]
12. Madrigal, J.; Marino, E.; Guijarro, M.; Hernando, C.; Diez, C. Evaluation of the flammability of gorse (ulex europaeus l.) managed by prescribed burning.Ann. For. Sci.2012,69, 387–397. [CrossRef]
13. Fréjaville, T.; Curt, T.; Carcaillet, C. Bark flammability as a fire-response trait for subalpine trees.Front. Plant
Sci.2013,4, 466. [CrossRef] [PubMed]
14. Clarke, P.J.; Prior, L.D.; French, B.J.; Vincent, B.; Knox, K.J.E.; Bowman, D.M.J.S. Using a rainforest-flame forest mosaic to test the hypothesis that leaf and litter fuel flammability is under natural selection.Oecologia
Fire2018,1, 14 17 of 18
15. Blauw, L.G.; Wensink, N.; Bakker, L.; van Logtestijn, R.S.P.; Aerts, R.; Soudzilovskaia, N.A.; Cornelissen, J.H.C. Fuel moisture content enhances nonadditive effects of plant mixtures on flammability and fire behavior.
Ecol. Evol.2015,5, 3830–3841. [CrossRef] [PubMed]
16. Bowman, D.M.J.S.; Haverkamp, C.; Rann, K.D.; Prior, L.D. Differential demographic filtering by surface fires: How fuel type and fuel load affect sapling mortality of an obligate seeder savanna tree.J. Ecol.2018,106, 1010–1022. [CrossRef]
17. Madrigal, J.; Hernando, C.; Guijarro, M.; Diez, C.; Marino, E.; de Castro, A.J. Evaluation of forest fuel flammability and combustion properties with an adapted mass loss calorimeter device.J. Fire Sci.2009,27, 323–342. [CrossRef]
18. Jaureguiberry, P.; Bertone, G.; Diaz, S. Device for the standard measurement of shoot flammability in the field.Austral Ecol.2011,36, 821–829. [CrossRef]
19. Bowman, D.M.J.S.; French, B.J.; Prior, L.D. Have plants evolved to self-immolate?Front. Plant Sci.2014,5, 590. [CrossRef]
20. Dickinson, K.J.M.; Kirkpatrick, J.B. The flammability and energy content of some important plant species and fuel components in the forests of southeastern tasmania.J. Biogeogr.1985,12, 121–134. [CrossRef] 21. Wyse, S.V.; Perry, G.L.W.; O’Connell, D.M.; Holland, P.S.; Wright, M.J.; Hosted, C.L.; Whitelock, S.L.;
Geary, I.J.; Maurin, K.J.L.; Curran, T.J. A quantitative assessment of shoot flammability for 60 tree and shrub species supports rankings based on expert opinion.Int. J. Wildland Fire2016,25, 466–477.
22. Schwilk, D.W. Dimensions of plant flammability.New Phytol.2015,206, 486–488. [CrossRef] [PubMed] 23. Trollope, W.S.W.; Trollope, L.A.; Potgieter, A.F.L.; Zambatis, N. Safari-92 characterization of biomass and
fire behavior in the small experimental burns in the Kruger National Park.J. Geophys. Res.-Atmos.1996,101, 23531–23539. [CrossRef]
24. Boundy, B.; Diegel, S.W.; Wright, L.; Davis, S.C.Biomass Energy Data Book, 4th ed.; Oak Ridge National Laboratory: Oak Ridge, TN, USA, 2011.
25. Curt, T.; Schaffhauser, A.; Borgniet, L.; Dumas, C.; Esteve, R.; Ganteaume, A.; Jappiot, M.; Martin, W.; N’Diaye, A.; Poilvet, B. Litter flammability in oak woodlands and shrublands of southeastern France.For.
Ecol. Manag.2011,261, 2214–2222. [CrossRef]
26. Cornwell, W.K.; Elvira, A.; van Kempen, L.; van Logtestijn, R.S.P.; Aptroot, A.; Cornelissen, J.H.C. Flammability across the gymnosperm phylogeny: The importance of litter particle size.New Phytol.2015,
206, 672–681. [CrossRef] [PubMed]
27. Bowman, D.M.J.S.; Prior, L.D. Data from: Differential demographic filtering by surface fires: How fuel type and fuel load affect sapling mortality of an obligate seeder savanna tree.Figshare2017. [CrossRef]
28. Bureau of Meteorology Climate Statistics for Australian Locations. Darwin Airport. Available online:
http://www.bom.gov.au/climate/averages/tables/cw_014015.shtml(accessed on 9 June 2015).
29. Bowman, D.M.J.S.; Wilson, B.A. Fuel characteristics of coastal monsoon forests, northern territory, australia.
J. Biogeogr.1988,15, 807–817. [CrossRef]
30. Trauernicht, C.; Murphy, B.P.; Portner, T.E.; Bowman, D.M.J.S. Tree cover-fire interactions promote the persistence of a fire-sensitive conifer in a highly flammable savanna.J. Ecol.2012,100, 958–968. [CrossRef] 31. Bowman, D.M.J.S.; MacDermott, H.J.; Nichols, S.C.; Murphy, B.P. A grass-fire cycle eliminates an
obligate-seeding tree in a tropical savanna.Ecol. Evol.2014,4, 4185–4194. [CrossRef] [PubMed]
32. Hollis, J.J.; Gould, J.S.; Cruz, M.G.; McCaw, W.L. Framework for an australian fuel classification to support bushfire management.Aust. For.2015,78, 1–17. [CrossRef]
33. Just, M.G.; Hohmann, M.G.; Hoffmann, W.A. Where fire stops: Vegetation structure and microclimate influence fire spread along an ecotonal gradient.Plant Ecol.2016,217, 631–644. [CrossRef]
34. Quinn, G.P.; Keogh, M.J.Experimental Design and Data Analysis for Biologists; Cambridge University Press: Cambridge, UK, 2002.
35. Byram, G.M. Combustion of forest fuels. InForest Fire: Control and Use; Davis, K.P., Ed.; McGraw-Hill: New York, NY, USA, 1959; pp. 61–89.
36. Ondei, S.; Prior, L.D.; Vigilante, T.; Bowman, D.M.J.S. Post-fire resprouting strategies of rainforest and savanna saplings along the rainforest-savanna boundary in the australian monsoon tropics.Plant Ecol.2016,
217, 711–724. [CrossRef]
Fire2018,1, 14 18 of 18
38. Pérez, B.; Moreno, J.M. Methods for quantifying fire severity in shrubland-fires.Plant Ecol.1998,139, 91–101.
[CrossRef]
39. Keeley, J.E. Fire intensity, fire severity and burn severity: A brief review and suggested usage.Int. J. Wildland
Fire2009,18, 116–126. [CrossRef]
40. R Core Team.R: A Language and Environment for Statistical Computing; R Foundation for Statistical Computing: Vienna, Austria, 2016.
41. Midgley, J.J. Flammability is not selected for, it emerges.Aust. J. Bot.2013,61, 102–106. [CrossRef]
42. Bradstock, R.A.; Auld, T.D. Soil temperatures during experimental bushfires in relation to fire intensity—Consequences for legume germination and fire management in south-eastern australia.J. Appl.
Ecol.1995,32, 76–84. [CrossRef]
43. Department of the Environment and Energy. National Vegetation Information Systems (NVIS). Available online:
http://www.environment.gov.au/land/native-vegetation/national-vegetation-information-system(accessed on 22 December 2017).
44. Fox, I.D.; Neldner, V.J.; Wilson, G.W.; Bannink, P.J. The Vegetation of the Australian Tropical Savannas; Environmental Protection Agency: Brisbane, Australia, 2001.
45. Nano, C.E.M.; Jobson, P.; Wardle, G.M. Arid shrublands and open woodlands of inland Australia.
InAustralian Vegetation, 3rd ed.; Keith, D.A., Ed.; Cambridge University Press: Cambridge, UK, 2017;
pp. 626–650.
46. Prior, L.D.; McCaw, W.L.; Grierson, P.F.; Murphy, B.P.; Bowman, D.M.J.S. Population structures of the widespread australian conifer callitris columellaris are a bio-indicator of continental environmental change.
For. Ecol. Manag.2011,262, 252–262. [CrossRef]
47. Department of the Environment and Energy.MVG 7—Callitris Forests and Woodlands; Australian Government: Canberra, Australia, 2017.
48. Rossiter, N.A.; Setterfield, S.A.; Douglas, M.M.; Hutley, L.B. Testing the grass-fire cycle: Alien grass invasion in the tropical savannas of northern australia.Divers. Distrib.2003,9, 169–176. [CrossRef]
49. Williams, R.J.; Gill, A.M.; Moore, P.H.R. Seasonal changes in fire behaviour in a tropical savanna in northern Australia.Int. J. Wildland Fire1998,8, 227–239. [CrossRef]
50. Cruz, M.G.; Gould, J.S.; Alexander, M.E.; Sullivan, A.L.; McCaw, W.L.; Matthews, S. Empirical-based models for predicting head-fire rate of spread in Australian fuel types.Aust. For.2015,78, 118–158. [CrossRef] 51. Thomas, P.B.; Watson, P.J.; Bradstock, R.A.; Penman, T.D.; Price, O.F. Modelling surface fine fuel dynamics
across climate gradients in eucalypt forests of south-eastern Australia.Ecography2014,37, 1–11. [CrossRef] 52. Anderson, W.R.; Cruz, M.G.; Fernandes, P.M.; McCaw, L.; Vega, J.A.; Bradstock, R.A.; Fogarty, L.; Gould, J.; McCarthy, G.; Marsden-Smedley, J.B.; et al. A generic, empirical-based model for predicting rate of fire spread in shrublands.Int. J. Wildland Fire2015,24, 443–460. [CrossRef]
53. Bowman, D.; Prior, L.; Cochrane, M.; Murphy, B. A continental-scale assessment of fuel loads and consumption by wildfire.Figshare2018. [CrossRef]
54. Gagnon, P.R.; Passmore, H.A.; Platt, W.J.; Myers, J.A.; Paine, C.E.T.; Harms, K.E. Does pyrogenicity protect burning plants?Ecology2010,91, 3481–3486. [CrossRef] [PubMed]
55. McCaw, W.L.; Gould, J.S.; Cheney, N.P.; Ellis, P.F.M.; Anderson, W.R. Changes in behaviour of fire in dry eucalypt forest as fuel increases with age.For. Ecol. Manag.2012,271, 170–181. [CrossRef]
56. Murphy, B.P.; Bradstock, R.A.; Boer, M.M.; Carter, J.; Cary, G.J.; Cochrane, M.A.; Fensham, R.J.; Russell-Smith, J.; Williamson, G.J.; Bowman, D.M.J.S. Fire regimes of Australia: A pyrogeographic model system.J. Biogeogr.2013,40, 1048–1058. [CrossRef]
57. Murphy, B.P.; Paron, P.; Prior, L.D.; Boggs, G.S.; Franklin, D.C.; Bowman, D.J.M.S. Using generalized autoregressive error models to understand fire-vegetation-soil feedbacks in a mulga-spinifex landscape mosaic.J. Biogeogr.2010,37, 2169–2182. [CrossRef]
58. Burnham, K.P.; Anderson, D.R.Model Selection and Multimodel Inference. A Practical Information-Theoretic Approach, 2nd ed.; Springer: New York, NY, USA, 2002; p. 488.
![Figure 6. (Australian examples. Values are for surface fires and are indicative, based on the results from this study(a) Ecosystem flammability plotted according to the Schwilk framework [22], using northand [48–52]](https://thumb-us.123doks.com/thumbv2/123dok_us/8397693.324950/13.595.102.495.90.286/australian-examples-indicative-ecosystem-ammability-according-framework-northand.webp)