DISTRIBUTED INTELLIGENT ROBOTICS:
RESEARCH &
DEVELOPMENT IN FAULT-TOLERANT CONTROL
AND SIZE/POSITION IDENTIFICATION
A thesis presented in partial
fulfilment of the requirements for the degree of
MASTER OF ENGINEERING
ID
COMPUTER SYSTEMS ENGINEERING
at Massey University, Turi tea Campus,
Palmerston North,
New Zealand
KARTHIKEYA KRISHNA SUBRAMANIAM
Abstract
This thesis presents research conducted
on aspects of intelligent robotic
systems.
In the past two decades, robotics has become one of the most rapidly expanding
and
developing fields of science.
Robotics can
be considered
as
the
science
of
using
artificial
intelligence in the physical
world.
Many
areas
of study exist
in
robotics. Among these, two fields that are of paramount importance in real world
applications are fault
tolerance, and sensory systems
.
Fault tolerance is necessary
since a robot in the real world could encounter internal faults, and may also have
to
continue
functioning under
adverse conditions
.
Sensory mechanisms are
essential since a robot will possess
littl
e intelligence if it does not have methods of
acquiring
information
about
its environment. Both the
se
fields
are
researched in
this thesi
s
.
In particular
,
emphasis i
s
placed on di
s
tributed intelligent autonomous
systems.
Experiments and simulations have been conducted to investigate design
for fault tolerance. A suitable platform was also chosen
for an implementation of
Acknowledgements
I would like to thank my supervisors Associate Professor Serge Dernidenko, and
Dr. Chris Messom for their help
,
patience
,
and guidance, and for the high standard
of achievement they encouraged. I have been very fortunate to have as my
supervisors two people who possess so great a knowledge of their subject areas,
and who were always willing to spend the time to impart that knowledge. I would
also like to thank them for their friendship.
I would like to thank my parents and my sister for always encouraging me to
further my studies. I would also like to thank Vani for the countless hours she
spent "keeping me company"
,
while I worked.
Finally, I would like to thank the ASIA 2000 foundation for their continuing
efforts in providing educational opportunities and experiences for students such as
myself.
ERRATA
Distributed Intelligent Robotics:
Research and Development in Fault-Tolerant
Control and Size/Position Identification
Chapter 2.1.3.5, pg.23 Errata
K.K. Subramaniam
On page 23, the notation Qnj is used to describe a vertex, but the notation is not explained until page 24. Qn,j denotes the jth vertex in the nth section of a flow graph that has been divided into sections, in order to reduce complexity.
Chapter 2.2.4, pg.38 Errata
The following section is to be inserted at the end of page 38, to further explain the flow graph example:
" ... erroneous transitions in dashed lines.
In considering the probabilities of erroneous transitions between states, it is important to recognize that the graph in figure 2-19 is an example of the erroneous transitions possible
[image:5.824.418.796.17.530.2]only in the specific error situation stated. Since the grey states represent unreachable states, the probabilities for erroneous transitions from the preceding states have rows that sum to one, since an erroneous transition must occur. This is coincidental in this case, and it is not necessary that the rows sum to one. The probabilities listed are the probabilities that an erroneous transition will occur in the specific example, and not the total probabilities for all possible erroneous transitions.
Figure 2-19 ... "
Chapter 2.3.2.2, pg.47 Errata
In Figure 2-23, a dashed arrow is used to show the erroneous transitions in the graph. Erroneous transitions are possible from vertices Q1 to Qi and Qi to Q3 (not Qi to Qi. as indicated).
Chapter 2.3.2.2, pg.48 Errata
The third element of the G matrix is element p1.3, and not
PH
Chapter 2.3.2.3, pg.49 Errata
The references
in
the first paragraph are to the matrix MQi• and thus the first paragraph reads:Here, Moi is the fault behaviour description of vertex Qi. M is a K x N matrix, where K is the total number of faults modelled, and N is the total number of vertices in the flow-graph. Thus, element (2,1) of the matrix denotes the probability of an erroneous transition from Qi to Qi. in the presence of fault type 2 - in a real implementation, this would be a particular type of fault.
Chapter 2.4.2, pg.54 Errata
Equation 2-23 written as:
is in fact:
Chapter 2.4.3, pg.56, 57 Errata
l/f(x/' )p(x)=q(x)rem s(x)
l/l('C))p(x)=q(x)rem s(x)
Two figures are labelled as 'Figure 2-35' on pages 56 and 57. To correct this, the figure on page 57 has to be labelled as Figure 2-35b, in which case the last sentence on page 56 reads:
'In other words, the situation in figure 2-35b is possible.'
Also, the fourth sentence in Chapter 2.4.4 on page 57 must then read:
'Figure 2-36 below illustrates the insertion of an erroneous bit between the first and second bits of an 8-bit key.'
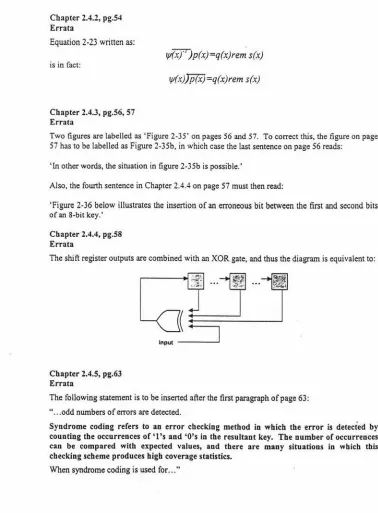
Chapter 2.4.4, pg.58 Errata
The shift register outputs are combined with an XOR gate, and thus the diagram is equivalent to:
Chapter 2.4.5, pg.63 Errata
The following statement is to be inserted after the first paragraph of page 63:
" ... odd numbers of errors are detected.
Syndrome coding refers to an error checking method in which the error is detected by counting the occurrences of 'l's and 'O's in the resultant key. The number of occurrences can be compared with expected values, and there are many situations in which this checking scheme produces high coverage statistics.
Contents
Abstract _ _ _ _ _ _ _ _ _ _ _ _ _ _ _ _ _ _ _ _ _ _ _ _ _ _ _ _ i
Acknowledgements _ _ _ _ _ _ _ _ _ _ _ _ _ _ _ _ _ _ _ _ _ _ _
iii
Contents _ _ _ _ _ _ _ _ _ _ _ _ _ _ _ _ _ _ _ _ _ _ _ _ _ _ _ _ v
Figures _ _ _ _ _ _ _ _ _ _ _ _ _ _ _ _ _ _ _ _ _ _ _ _ _ _ _ _ _
vii
I
2
Distributed Intelligent Robotics
I
1.1
1.2
1.3
1.4
1.5
Introduction _ _ _ _ _ _ _ _ _ _ _ _ _ _ _ _ _ _ _ _ _ _ _ 1
Scope of Research
______________________ 4
_ _ _ _ _ _ _ _ _ _ _ _ _ _ _ _ _ _ _ _ _ _ _ 6
_ _ _ _ _ _ _ _ _ _ _ _ _ _ _ _ _ _ _ _ _ 6
_ _ _ _ _ _ _ _ _ _ _ _ _ _ _ _ _ _ _ _ _ _ _ _ _ 9
Thesis Overview
Chapter Overview
References
Design of Fault-Tolerant Control Units _ _ _ _ _ _ _ _ _ _ _ _ 11
2.1 Control Units - - - 11
2.1.1
Introduction
11
2.1.1.1 Finite
St
ate
Machines
12
2.1.1.2
Microprogramming
15
2
.
1
.2
Design
for Fault
Tolerance
16
2.1.2.1
Monitoring Machine
s
17
2.1.2.2
Watchdog Proce
ssors
18
2.1.2.3 Monitoring Techniques Without
Reference Signatures
19
2.1.3
Proce
ss
Monitoring Using Signature Analysis
21
2.1.3.
I
Components
of a Flow
Graph
21
2.1.3.2 Vertex
Check
Keys
22
2.1.3.3 Generation
of
Vertex Check Keys
23
2.1.3.4 Using
Check Key
s
to Monitor Control
Flow
24
2.1.3.5
Probabilistic
Fault
Coverage
24
2.1.4
Section
Summary
28
2.2 Flow Graph and Hardware Reliability
- - - -
28
2.2.1
Introduction
28
2.2.2
System Parameters
29
2.2.3
General System Reliability
30
2.2.4
Vertex
Execution
Probability
33
2.2.5
Hardware Reliability
40
2.2.5.1
Hardware Component Usage
40
2.2.5.2
Total Probabilities
for
Component Usage
41
2
.
2.6
Section Summary
45
2.3 Representation of Fault Types - - - 46
2.3.1
Introduction
46
2.3
.2
Representing Different Fault Types
46
3
4
5
2.3
.
2
.
1 Fault
Types
_ _ _ _ _ _ _ _ _ _ _ _ _ _ _ _ _ _ _ _ _ _
46
2
.
3.2
.
2
Fault-Oriented Representation
47
2
.
3.2.3
Vertex-Oriented Representation
48
2.3
.
3
Section
Summary
51
2.4 Fault Coverage _ _ _ _ _ _ _ _ _ _ _ _ _ _ _ _ _ _ _ _ _ _ 52
2.4.1
Introduction
52
2.4
.
2
The Signature Compression
Process
53
2.4.3
Bit Errors
at
the Beginning
of the Key
55
2.4.4
Bit Errors -The General Case
57
2.4
.
5
Discussion of
Simulation Results
62
2.4.6
Fault
Coverage
-
Comparative Analysis
66
2.4.7
Section
Summary
70
2.5 References
_ _ _ _ _ _ _ _ _ _ _ _ _ _ _ _ _ _ _ _ _ _ _ _
72
Robotic Visual Systems - - - -
77
3.1 Introduction - - - 77
3.2 Robotic Visual System Concepts
78
3
.
2
.
1
Position
-
Based Vi
s
u
a
l
Servo
78
3
.
2
.
2
Image-Based Visual Servo
79
3
.
2
.
3
Cameras
79
3
.
2.4
F
e
ature Extraction
,
Obje
c
t Lo
ca
tion
,
and Tra
c
kin
g
80
3.3
Applications
of Robotic Visual
Systems _ _ _ _ _ _ _ _ _ _ _ _ _
81
3.3
.
1
Robot Development
81
3
.
3.2
Conventional Vi
s
ion
System Implementation
82
3
.
3
.
3
Improved Algorithm
83
3.3.4
Implementation
85
3
.
3.4
.
1 Data
Types
85
3
.
3.4
.
2
Run-Length
Encoding
88
3.3.4.3
Neighbour
T
e
sting
90
3
.
3.4.4
Object
Location
92
3.4 Chapter Summary
93
3.5 References
95
Conclusions - - - 97
Bibliography _ _ _ _ _ _ _ _ _ _ _ _ _ _ _ _ _ _ _ _ _ 99
Appendices _ _ _ _ _ _ _ _ _ _ _ _ _ _ _ _ _ _ _ _ _ _ _
107
MATLAB Programs
110
Simulation Results
136
Vision System Code
165
Publications
179
Figures
FIGURE 2-1: HIGH-LEVEL VIEW OF FINITE STATE MACHINE CONTROL. ... 12
FIGURE 2-2: INSTRUCTION FETCH AND DECODE CYCLE ... 13
FIGURE 2-3: MEMORY REFERENCE INSTRUCTION ... 13
FIGURE 2-4: ARITHMETIC AND LOGICAL INSTRUCTIONS ... 14
FIGURE 2-5: CONDITIONAL BRANCH ... 14
FIGURE 2-6: UNCONDITIONAL JUMP ... 14
FIGURE 2-7: MICROPROGRAMMED CONTROL UNIT STRUCTURE ... 16
FIGURE 2-8: INCORPORATION OF A MONITORING MACHINE INTO A SYSTEM (3) ... 17
FIGURE 2-9: USE OF A WATCHDOG PROCESSOR IN A SYSTEM [5] ... 17
FIGURE 2-10: KEYS ASSIGNED TO EACH VERTEX ARE CONCATENATED AND COMPRESSED TO FORM SIGNATURE ... 21
FIGURE 2-11: A FLOW GRAPH VERTEX ... 29
FIGURE 2-12: A HARDWARE ELEMENT ... 29
FIGURE 2-13: GENERAL MODEL OF A HARDWARE LMPLEMENTATION ... 30
FIGURE 2-14: EXAMPLE SYSTEM FLOW GRAPH ... 31
FIGURE 2-15: EXAMPLE SYSTEM HARDWARE IMPLEMENTATION ... 32
FIGURE 2-16: EXAMPLE SYSTEM HARDWARE IMPLEMENTATION ... 35
FIGURE 2-17: EXAMPLE SYSTEM FLOW GRAPH ... 36
FIGURE 2-18: SYSTEM DECOMPOSITION INTO TWO PARALLEL SUBSYSTEMS ... 36
FIGURE 2-19: FLOW GRAPH TRANSITIONS WITH FAULT ... 39
FIGURE 2-20: HARDWARE COMPONENT USAGE BY A VERTEX ... .41
FIGURE 2-21: EXAMPLE FLOW GRAPH ... ,. ... .43
FIGURE 2-22: EXAMPLE HARDWARE ARCHITECTURE ... .43
FIGURE 2-23: FAULT AT VERTEX
Q1
.
...
.
..
..
.
..
..
..
..
.
.
.
...
..
...
.
.
...
..
....
..
.
..
...
..
...
.
..
...
..
.
.
.47FIGURE 2-24: FAULT AT VERTEX
Q
1 .
..
.
.
...
.
..
.
...
.
..
..
...
....
...
....
...
....
...
.
.
..
.
.
...
.
..
...
.
.47FIGURE 2-25: FAULT AT VERTEX
Q
3···
·
·
..
...
.
..
..
...
..
.
..
.
..
...
....
..
..
....
.
..
..
...
.
.
..
.
..
.
..
..
..
..
...
.
.48FIGURE 2-26: FAULT AT VERTEX
Q4
...
.
..
.
.
.
....
..
.
.
..
.
...
....
...
.
....
.
.
..
...
.
.48FIGURE 2-27: LSB STUCK-ATZERO ... .49
FIGURE 2-28: LSB STUCK-AT ONE ... .49
FIGURE 2-29: MSB STUCK-AT ZERO ... 50
FIGURE 2-30: MSB STUCK-AT ONE ... 50
FIGURE 2-31: SIGNATURE GENERATION PROCESS ... 53
FIGURE 2-32: REPRESENTATION OF KEYS AS A SUPERPOSITION OF MULTIPLE BIT SEQUENCES -ERROR IS IN THE MSB POSITION OF THE ORIGINAL KEY ... 53
FIGURE 2-33: ADDING SIGNATURES OF TWO STREAMS TO PRODUCE THE SIGNATURE OF THE THIRD STREAM ... 54
FIGURE 2-34: SrNGLE-BITERROR ATTHE BEGINNING OF THE KEY ... 55
FIGURE 2-35: ERROR SIGNATURES COMBrNING TO GIVE CORRECT SIGNATURE ... 57
FIGURE 2-36: ERROR INSERTED BETWEEN BITS IN KEY ... 57
FIGURE 2-37: EXAMPLE SHIFT REGISTER WITH INPUT ... 58
FIGURE 2-38: SET OF STATES FOR THE SHIFT REGISTER rN FIGURE 2-37 ... 59
FIGURE 2-39: ERRONEOUS SEQUENCE REPRESENTED AS THE COMBrNED OUTPUTS OF SEPARATE REGISTERS ... 59
FIGURE 2-40: ERRONEOUS STATE TRANSITIONS DUE TO ERRORS ... 60
FIGURE 2-41: 3-BIT ERROR REPRESENTED AS THE SUM OF SEPARATE SEQUENCES ... 60
FIGURE 2-42: ERRORS ARE MASKED DUE TO REGISTER RETURNrNG TO ITS ORIGINAL STATE ... 61
FIGURE 2-43: FLOW GRAPH WITH ALTERNATING I-BIT KEYS ... 68
FIGURE 2-44: FLOW GRAPH WITH IDENTICAL 1-BIT KEYS ... 68
FIGURE 2-45:
A
MORE COMPLEX GRAPH - KEY ASSIGNMENT IS NOT TRIVIAL. ... 68FIGURE 3-1: Y-U-V COLOUR BOUNDARIES OF A RECOGNISED GAME COLOUR ... 82
FIGURE 3-2: FORMING OBJECTS FROM CONNECTED REGIONS ... 85
FIGURE 3-3: ALGORITHM DESCRIPTION FLOW CHART ... 86
FIGURE 3-4: 'NEIGHBOUR' LINKS BETWEEN ADJACENT ROWS ... 87
FIGURE AO- I: SIGNATURE ANALYSIS: 8-BIT KEY, 4-BIT COMPRESSION, I-BIT DELETION ... 138
FIGURE A0-2: SIGNATURE ANALYSIS: 8-BIT KEY, 4-BIT COMPRESSION, 2-BIT DELETION ... 138
FIGURE A0-3: SIGNATURE ANALYSIS: 8-BIT KEY, 4-BIT COMPRESSION, 3-BIT DELETION ... 138
FIGURE A0-4: SIGNATURE ANALYSIS: 12-BIT KEY, 7-BIT COMPRESSION, I-BIT DELETION ... 139
FIGURE A0-5: SIGNATURE ANALYSIS: 12-BIT KEY, 7-BIT COMPRESSION, 2-BIT DELETION ... 139
FIGURE A0-6: SIGNATURE ANALYSIS: 12-BIT KEY, 7-BIT COMPRESSION, 3-BIT DELETION ... 140
FIGURE A0-7: SIGNATURE ANALYSIS: 12-BIT KEY, 7-BIT COMPRESSION, 4-BIT DELETION ... 140 FIGURE A0-8 SIGNATURE ANALYSIS: 12-BIT KEY, 7-BIT COMPRESSION, 5-BIT DELETION ... 141
FIGURE A0-9: SIGNATURE ANALYSIS: 8-BIT KEY, 4-BIT COMPRESSION, I-BIT LENGTHENING BY
INSERTED ERROR ... 141
FIGURE AO-I 0: SIGNATURE ANALYSIS: 8-BIT KEY, 4-BIT COMPRESSION, I-BIT LENGTHENING.
A VER AGE COVERAGE= 86.11 % ... 142 FIGURE AO-I I: SIGNATURE ANALYSIS: 8-BIT KEY, 4-BIT COMPRESSION, 2-BIT LENGTHENING BY
INSERTED ERROR ... 142 FIGURE A0-12: SIGNATURE ANALYSIS: 8-BIT KEY, 4-BIT COMPRESSION, 2-BIT LENGTHENING.
AVERAGE COVERAGE= 90.97% ... 143
FIGURE A0-13: SIGNATURE ANALYSIS: 8-BIT KEY, 4-BIT COMPRESSION, 3-BIT LENGTHENING. AVERAGE COVERAGE= 93.06% ... 143
FIGURE A0-14: PARITY CHECKING: 8-BIT KEY, I-BIT DELETION, INDIVIDUAL BIT POSITION
COVERAGE ... 144
FIGURE A0-15: PARITY CHECKING: 8-BIT KEY, 2-BIT DELETION, INDIVIDUAL BIT POSITION
COVERAGE ... 145
FIGURE A0-16: PARITY CHECKING: 8-BIT KEY, 3-BIT DELETION, INDIVIDUAL BIT POSITION
COVERAGE ... 145
FIGURE A0-17: PARITY CHECKING: 8-BIT KEY, OVERALL COVERAGES FOR BOTH SHORTENING METHODS ... 146
FIGURE A0-18: PARITY CHECKING: 12-BIT KEY, I-BIT DELETION, INDIVIDUAL BIT POSITION
COVERAGE ... 146
FIGURE A0-19: PARITY CHECKING: 12-BIT KEY, 2-BIT DELETION, INDIVIDUAL BIT POSITION
COVERAGE ... 14 7
FIGURE A0-20: PARITY CHECKING: 12-BIT KEY, 3-BIT DELETION, INDIVIDUAL BIT POSITION
COVERAGE ... 147
FIGURE A0-21: PARITY CHECKING: 12-BIT KEY, 4-BIT DELETION, INDIVIDUAL BIT POSITION
COVERAGE ... 148
FIGURE A0-22: PARITY CHECKING: 12-BIT KEY, 5-BIT DELETION, INDIVIDUAL BIT POSITION
COVERAGE ... 148
FIGURE A0-23: PARITY CHECKING: 12-BIT KEY, OVERALL COVERAGES FOR BOTH SHORTENING
METHODS ... 149
FIGURE A0-24: PARITY CHECKING: 8-BIT KEY, I-BIT LENGTHENING, INDIVIDUAL BIT POSITION
COVERAGE ... 149
FIGURE A0-25: PARITY CHECKING: 8-BIT KEY, 2-BIT LENGTHENING, INDIVIDUAL BIT POSITION
COVERAGE ... 150
FIGURE A0-26: PARITY CHECKING: 8-BIT KEY, 3-BIT LENGTHENING, INDIVIDUAL BIT POSITION
COVERAGE ... 150
FIGURE A0-27: PARITY CHECKING: 8-BIT KEY, OVERALL COVERAGES FOR BOTH LENGTHENING
METHODS ... 151
FIGURE A0-28: SYNDROME CODING: 8-BIT KEY, I-BIT SHORTENING, INDIVIDUAL BIT POSITION
COVERAGE ... 152 FIGURE A0-29: SYNDROME CODING: 8-BIT KEY, 2-BIT SHORTENING, INDIVIDUAL BIT POSITION
COVERAGE ... 152 FIGURE A0-30: SYNDROME CODING: 8-BIT KEY, 3-BIT SHORTENING, INDIVIDUAL BIT POSITION
COVERAGE ... 153
FIGURE A0-31: SYNDROME CODING: 8-BIT KEY, OVERALL COVERAGES FOR BOTH SHORTENING
METHODS ... 153
FIGURE A0-32: SYNDROME CODING: 12-BIT KEY, I-BIT SHORTENING, INDIVIDUAL BIT POSITION COVERAGE ... 154 FIGURE A0-33: SYNDROME CODING: 12-BIT KEY, 2-BIT SHORTENING, INDIVIDUAL BIT POSITION
COVERAGE ... 154 FIGURE A0-34: SYNDROME CODING: 12-BIT KEY, 3-BIT SHORTENING, INDIVIDUAL BIT POSITION
COVERAGE ... 155 FIGURE A0-35: SYNDROME CODING: 12-BIT KEY, 4-BIT SHORTENING, INDIVIDUAL BIT POSITION
COVERAGE ... 155 FIGURE A0-36: SYNDROME CODING: 12-BIT KEY, 5-BIT SHORTENING, INDIVIDUAL BIT POSITION
COVERAGE ... 156 FIGURE A0-37: SYNDROME CODING: 12-BIT KEY, OVERALL COVERAGES FOR BOTH SHORTENING
METHODS ... 156 FIGURE A0-38: SYNDROME CODING: 8-BIT KEY, I-BIT LENGTHENING, INDIVIDUAL BIT POSITION
COVERAGE ... 157 FIGURE A0-39: SYNDROME CODING: 8-BIT KEY, 2-BIT LENGTHENING, INDIVIDUAL BIT POSITION
COVERAGE ... 157
FIGURE A0-40: SYNDROME CODING: 8-BIT KEY, 3-BIT LENGTHENING, INDIVIDUAL BIT POSITION COVERAGE ... 158 FIGURE A0-41: SYNDROME CODING: 8-BJT KEY, OVERALL COVERAGES FOR BOTH LENGTHENING
METHODS ... 158 FIGURE A0-42: TRANSITION COUNTING: 8-BJT KEY, I-BIT SHORTENING, INDIVIDUAL BIT POSITION
COVERAGE ... 159 FIGURE A0-43: TRANSITION COUNTING: 8-BIT KEY, 2-BIT SHORTENING, INDIVIDUAL BIT POSITION
COVERAGE ... 159 FIGURE A0-44: TRANSITION COUNTING: 8-BIT KEY, 3-BIT SHORTENING, INDIVIDUAL BIT POSITION
COVERAGE ... 160 FIGURE A0-45: TRANSITION COUNTING: 8-BIT KEY, OVERALL COVERAGES FOR BOTH SHORTENING
METHODS ... 160 FIGURE A0-46: TRANSITION COUNTING: 12-BIT KEY, I-BIT SHORTENING, INDIVIDUAL BIT POSITION
COVERAGE ... 161 FIGURE A0-47: TRANSITION COUNTING: 12-BIT KEY, 2-BIT SHORTENING, INDIVIDUAL BIT POSITION
COVERAGE ... 161 FIGURE A0-48: TRANSITION COUNTING: 12-BIT KEY, 3-BIT SHORTENING, INDIVIDUAL BIT POSITION
COVERAGE ... 162 FIGURE A0-49: TRANSITION COUNTING: 12-BIT KEY, 4-BIT SHORTENING, INDIVIDUAL BIT POSITION
COVERAGE ... 162 FIGURE A0-50: TRANSITION COUNTING: 12-BIT KEY, 5-BIT SHORTENING, INDIVIDUAL BIT POSITION
COVERAGE ... 163 FIGURE A0-51: TRANSITION COUNTING: 12-BIT KEY, OVERALL COVERAGES FOR BOTH SHORTENING
METHODS ... 163 FIGURE A0-52: TRANSITION COUNTING: 8-BIT KEY, I-BIT LENGTHENING, INDIVIDUAL BIT POSITION
COVERAGE ... 164 FIGURE A0-53: TRANSITION COUNTING: 8-BIT KEY, 2-BIT LENGTHENING, INDIVIDUAL BIT POSITION
COVERAGE ... 164 FIGURE A0-54: TRANSITION COUNTING: 8-BIT KEY, 3-BIT LENGTHENING, INDIVIDUAL BIT POSITION
COVERAGE ... 165 FIGURE A0-55: TRANSITION COUNTING: 8-BIT KEY, OVERALL COVERAGES FOR BOTH LENGTHENING
METHODS ... 165