City, University of London Institutional Repository
Citation:
Nadimi, S., Di Pasquale, L. and Fonseca, J. (2017). Influence of fine fraction on
breakage of binary granular materials. Paper presented at the 19th International Conference
on Soil Mechanics and Geotechnical Engineering, 17-22 Sep 2017, Seoul, Korea.
This is the accepted version of the paper.
This version of the publication may differ from the final published
version.
Permanent repository link:
http://openaccess.city.ac.uk/17734/
Link to published version:
Copyright and reuse: City Research Online aims to make research
outputs of City, University of London available to a wider audience.
Copyright and Moral Rights remain with the author(s) and/or copyright
holders. URLs from City Research Online may be freely distributed and
linked to.
City Research Online:
http://openaccess.city.ac.uk/
[email protected]
Influence of fine fraction on breakage of binary granular materials
Influence de la fraction fine sur la rupture des matériaux granulaires binaires
Sadegh Nadimi, Lorenzo Di Pasquale & Joana Fonseca
City, University of London, London, UK, [email protected]
ABSTRACT: Understanding the stress transmission mechanisms and breakage of soils composed of a fine and coarse fractions is critical for the design of many geotechnical structures such as pile driving and large embankment dams. A series of strain controlled one-dimensional compression laboratory experiments were carried out using glass beads to investigate the effect of the fine faction on the macroscopic response of the material. A wide range of stress varying from 10 to 250MPa was considered. Glass beads with diameters between 0.5 and 4mm were used to form granular mixtures with fines content ranging from 0 to 100%. This study shows the potential of strain controlled testing to provide further insights into the fabric evolution of granular materials undergoing grain breakage. When compared to conventional load controlled testing, the force:displacement curve obtained during strain controlled testes provides a better correlation between the macroscopic response and the grain-scale phenomena. The response of mono-sized samples is used as a reference to better understand the contribution of both the coarse and the fine factions to the behaviour of the mixture. Preliminary results have suggested that as breakage progresses, the grain size distribution evolves towards a fine fraction threshold value, beyond which the behaviour is governed by the fine component. Previously proposed relative breakage parameters are also used to demonstrate the influence of the fine faction in the final grading of the material. These finding, also supported by recent numerical studies, can provide valuable guidance for geotechnical practice.
RÉSUMÉ : Comprendre les mécanismes de transmission des tensions/contraintes et la rupture des sols composés d’éléments fin et épais est essentiel pour la conception de nombreux ouvrages géotechniques tels que le battage de pieux et la construction de barrages. Des séries d’expérimentation en laboratoire d’effort de compression unidimensionnelle contrôlée ont été réalisées en utilisant des billes de verre pour étudier l'effet d’un d’éléments fins sur la réaction macroscopique du matériau. Un grand écart d’effort, variant de 10 à 250 MPa, a été considéré. Les billes de verre, d’un diamètre compris entre 0,5 et 4 mm, ont été utilisées pour former des mélanges granuleux avec une teneur en granulats classée de 0 à 100%. Cette étude montre le potentiel des tests d’effort contrôlés pour fournir des connaissances plus approfondies dans le changement des structures des matériaux subissant les ruptures liés aux granulats. Quand on compare à des tests classiques de charge contrôlée, la courbe de déplacement obtenue durant le test d’effort contrôlé donne une meilleure corrélation entre la réaction macroscopique et le phénomènes grain échelle. La réaction des mono-taille échantillons sont utilisées comme une référence afin de mieux comprendre la contribution des mélanges granuleux fin ou épais. Les premiers résultats suggèrent que, comme la rupture progresse, la taille des grains évoluent vers une valeur limite, au-delà de laquelle le comportement est conduit par des grains fins. Comme propose auparavant, cette rupture paramètres sont aussi utilisée pour démontrer l’influence des granulats fins dans le classement final des matériaux. Cette trouvaille, aussi soutenu par de récentes études numériques, peut fournir une aide importante pour la pratique de la géotechnique.
KEYWORDS: fabric/structure of soils; sands; grain breakage; laboratory testing; binary granular material.
1 INTRODUCTION
The macroscopic response of soil under loading is driven by grain rearrangement up to the grain capacity (e.g. Fonseca et al., 2013). Beyond the tensile capacity, soil grains will be prone to cracking and breaking (Nadimi & Fonseca, 2017). Grain breakage plays an important role in the mechanical response of granular materials, in particular for geotechnical structures such as pile driving and embankment dams (Coop, 1990; McDowell & Bolton, 1998; Coop et al., 2004; Muir Wood, 2006; Mesri & Vardhanabhuti, 2009; Vilhar et al., 2013; Yan & Shi, 2014; Zhang et al., 2015).
To quantify breakage, different measures have been recommended in the literature. Marsal (1967) proposed the grain breakage index (Bm) as follows:
i
n n
pd m B
1
(1)
where pdn is the positive difference in percentage by weight of soil retained on the nth sieve, when the grading before and after
a crushing test are compared.
Hardin (1985) noted that the breakage potential of a grain increases with its size. He also suggested that grains with diameter larger than 0.074mm are more relevant to breakage investigation. He claimed that this is justified on the basis that smaller grains did not contribute to breakage. Einav (2007) proposed a new definition of relative breakage, and suggested to weight from zero to one the relative proximity of the current grain size cumulative distribution from an initial distribution to an ultimate distribution, instead of using the cut-off at d=0.074mm.
Mesri & Vardhanabhuti (2009) categorised grain breakage in a more qualitative way: level I (abrasion or grinding of grain surface asperities), level II (breaking or crushing of grain surface protrusions and sharp grain corners and edges), and level III (fracturing, splitting, or shattering of grains).
(e.g. abrasion of grain surface or breakage of outer part of the grain) the sample is labelled as damage level ‘D’. The third level
is called breakage level ‘B’ and refers to the samples in which
one or more grain experienced fracturing, splitting, or shattering. In numerical studies, the effect of fines content on force transmission and fabric development of gap-graded mixtures was investigated by de Frias Lopez et al. (2016) using the discrete element method. They suggested a threshold value for fines content which overall behaviour is changed from coarse to fine dominant. Shire et al. (2016) presents the effect of size ratio (diameter of coarse fraction over diameter of fine fraction) on contribution of fine fraction. Also Minh and Cheng (2016) concluded that for systems with a small percentage of fine grains, the fine grains do not actively participate in the strong force transmission. This is further investigated in this study by means of laboratory experiments.
2 MATERIAL & METHOD 2 .1 Sample preparation
[image:3.595.315.534.102.280.2]Samples have been prepared by using 0.50-0.75mm diameter glass beads as the fine fraction, and 3.40-4.00mm beads as the coarse fraction. Thus, the coarse to fine size ratio is approximately six. The glass beads are commercially supplied by Sigmund Lindner GmbH as type S beads with specific gravity of 2.57 and 95% roundness. The advantage of using glass beads instead of real sand is to have controlled shape while benefiting from mechanical properties similar to silica sand. Main mechanical properties are reported in Table 1.
Table 1. Glass bead properties
Parameter Units Value
Unit weight kN/m3 25.2
Young’s modulus GPa 63
Poisson’s ratio (-) 0.22
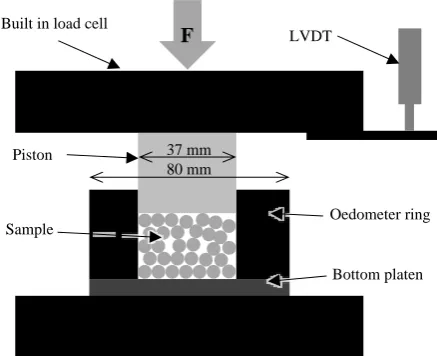
Before sample preparation, all the samples were weighed on a 0.01g precision scale. The samples were sieved to plot the initial Particle Size Distribution (PSD) curve. Fifteen sieves were used including 4, 3.35, 2.36, 2, 1.7, 1.4, 1.18, 0.850, 0.600, 0.425, 0.295, 0.250, 0.150, 0.106, 0.063mm aperture mesh. All samples have been prepared by means of the air pluviation method. The beads were allowed to fall through a funnel, while trying to maintain a zero height of fall in order to avoid segregation (Cavaretta, 2009). The coarse and fine fractions were separately weighted according to the desired Fines Content percentage (FC%) and subdivided into four mixed batches. It was then poured into the Oedometer ring with 37mm diameter layer by layer (Fig. 1). After placing internal piston shown in Fig.1 at the top of sample, the height of sample was measured for calculating the initial void ratio.
2 .2 Loading tests
The sample was carefully positioned in the device and the load was applied (Fig. 1). A strain controlled machine ‘Instron 5969’ was used over a range of force applications up to 50kN which corresponds to the vertical stress of 40MPa. During the test an LVDT was used to measure the displacements imposed by the machine. The standard Oedometer loading frame BS: 1377-5 enables applying pressure up to 10MPa for small Oedometer ring used in this study, which is lower than the capacity of the materials used. For higher stress, the compression device ‘Controls 50-C9032’ was used. The capacity of this machine is 300kN and, therefore, tests with pressures up
to 250MPa were carried out. However, tests performed with this device were not strain controlled.
Figure 1. Schematic of 1D compression experiment.
As a final step, the samples were sieved again in order to plot the final PSD curve and to detect the differences from the initial grading for calculating relative breakage index. Table 2 summarises the experiments reported in this paper in terms of initial void ratio ‘ei’, final void ratio ‘ef’, applied vertical stress
‘σv’, Damage Level ‘DL’, Marsal’s Breakage index ‘Bm’ and
Einav’s Breakage index ‘Br’. More details and evolving PSD for
each test can be found in Di Pasquale (2016). 3 RESULTS
The effect of fines content on initial void ratio of binary granular materials is shown in Fig. 2. This is compared with numerical and theoretical values reported in literature (Vallejo, 2001; de Frias Lopez et al. 2016). For high FC, there is a perfect match between different approaches. The minimum initial void ratio was achieved for FC=40%. For FC=0% and for the case of uniformly graded sample with 3.4<d<4.0mm, there are some small discrepancies, which can be related to boundary effects (Marketos & Bolton, 2010; Nadimi & Fonseca, 2016).
The decrease in void ratio ‘Δe=ei-ef’ for the different range of
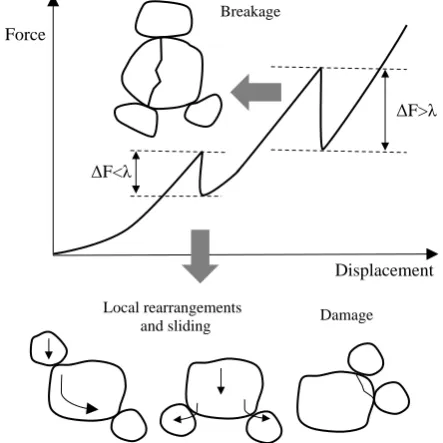
applied vertical stresses is reported in Fig. 3. Vertical stresses higher than 40MPa were only applied on samples with FC=0% and 100%. After initial increase in ‘Δe’, the experiments show very small changes for stresses between 40 to 250MPa. As mentioned in section 2.2, experiments with vertical stress lower than 40MPa were carried out using a strain controlled procedure. This means that the top platen was moved down in constant incremental displacements. Therefore, the force reaction in the top platen which comes from the force transmission between the individual grains can be recorded. When there are some rearrangement, damage or breakage, the reaction force suddenly drops. The amount of drop in load can be related to grain size and microstructural phenomena happening between the grains. Fig. 4 shows a schematic of drop in load. The first largest drop in load can be called the onset of breakage which is the start of yielding (Altuhafi & Coop, 2011).
Fig. 5 shows a typical load:displacement curve derived from a strain controlled 1D compression test. The drop in load before the onset of breakage can be related to asperity damage and local rearrangement. Later drops are related to the evolving grading and are not affected by initial fines content.
37 mm 80 mm
F
LVDTBuilt in load cell
Piston
Sample
Oedometer ring
[image:3.595.54.286.376.452.2]Table 2. Summary of experiments reported in this paper.
FC ei ef σv DL Bm Br
100% 0.623
0.615 0.618 0.610 0.618 0.619 0.617 0.610 0.563 0.493 0.503 0.400 0.303 0.287 0.278 0.249 10.11 20.46 30.40 40.62 100.2 150.2 200 250 0 D D D B B B B 0.000 0.001 0.002 0.002 0.402 0.498 0.526 0.558 0.000 0.000 0.002 0.002 0.519 0.605 0.640 0.663
80% 0.547
0.544 0.560 0.539 0.454 0.399 0.374 0.339 10.01 20.10 30.09 40.12 0 D D D 0.000 0.000 0.001 0.006 0.000 0.000 0.000 0.000
60% 0.477
0.460 0.447 0.459 0.384 0.343 0.281 0.236 9.97 20.04 30.05 40.08 0 D D B 0.000 0.004 0.004 0.014 0.000 0.004 0.006 0.017
40% 0.385
0.385 0.381 0.385 0.299 0.248 0.218 0.177 10.00 20.09 30.01 40.05 0 D D B 0.000 0.004 0.004 0.016 0.000 0.001 0.001 0.009
20% 0.456
0.437 0.457 0.460 0.383 0.323 0.195 0.126 10.08 20.11 30.14 40.06 D D B B 0.001 0.003 0.261 0.299 0.001 0.002 0.318 0.385
0% 0.790
[image:4.595.330.521.73.185.2]0.748 0.705 0.739 0.757 0.755 0.733 0.707 0.720 0.660 0.609 0.522 0.539 0.270 0.247 0.191 10.16 20.10 22.37 27.67 28.69 53.01 100 150 0 D B B B B B B 0.000 0.003 0.206 0.137 0.135 0.618 0.664 0.789 0.000 0.032 0.165 0.186 0.187 0.693 0.774 0.957
Figure 2. Effect of fines content (percentage by weight) on the void ratio for binary granular materials. Theoretical values and numerical values were converted from porosity reported by Vallejo (2001) and de Frias
[image:4.595.60.284.84.538.2]Lopez et al. (2016), respectively.
Figure 3. Change in void ratio versus applied vertical stress for different fines content.
Figure 4. Schematic of drop in load caused inside a granular material
under compression, λ is the threshold drop in load. (after Tsongui et
[image:4.595.314.536.224.446.2]al., 1999).
Figure 5. A typical load-displacement curve in the strain controlled test.
The drop in load corresponding to the onset of breakage for
σv=30MPa and σv=40MPa against fines content is shown in Fig.
6. It can be seen that the trend changes between FC=20 and 40%, where lowest void ratio is observed (relating again to Fig. 2). It can be therefore noted that for a fines content between 0% and <40% the overall behaviour seems to be ‘coarse-dominant’, while for a fines content of 40% and beyond, it is ‘fine-dominant’.
For very high stress level, where the fine fraction is higher than the threshold value is produced through breakage, the response of the assembly is also fine-dominant. Fig. 7 shows a sample with initial FC=0% after applying 150MPa vertical stress. It is 0.1 0.2 0.3 0.4 0.5 0.6 0.7 0.8
0 20 40 60 80 100
Initi al void rati o ( ei )
Fine content, %
Experimental Numerical Theoretical 0 0.1 0.2 0.3 0.4 0.5 0.6 0.7
0 50 100 150 200 250
Δ
e
(ei -ef
)
Verical stress, MPa
FC=100% FC=80% FC=60% FC=40% FC=20% FC=0% Force Displacement ΔF<λ ΔF>λ Local rearrangements
and sliding Damage
Breakage 0 10 20 30 40
0 1 2 3
Vertical
load, kN
Displacement, mm
Breakage Damage/rearrangement
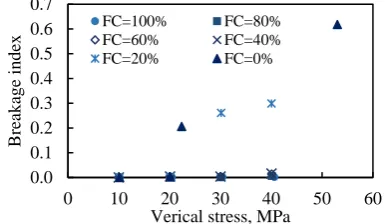
[image:4.595.321.509.489.604.2]interesting to see some intact grains at such high stress level. This is commonly called ‘cushioning effect’. By looking at conventional breakage index versus stress curve for reported strain controlled experiment shown in Fig. 8, the effect of FC on reducing Bm is clear.
[image:5.595.117.220.270.367.2]Figure 6. Drop in load versus fines content percentage.
Figure 7. Cushioning effect on a sample with FC=0% tested under 150 MPa vertical stress.
Figure 8. Marsal breakage index versus the stress level for all fines content percentage.
4 CONCLUSION
This study shows the potential of strain controlled testing to provide further insights into the fabric evolution of granular materials undergoing grain breakage. When compared to conventional load controlled testing, the force-displacement curve obtained during strain controlled tests provides a better correlation between the macroscopic response and the grain scale phenomena. The role of fines content on the overall behaviour of the sample has been examined. The main finding was that for a fines content between 0% and <40% the overall behaviour was “coarse-dominant”, while for a fines content of 40% and beyond, it was “fine-dominant”. Therefore, for a system with fines content smaller than threshold (<40%), the fine grains do not actively participate in the strong force transmission. When such a system evolves up to the threshold value through breakage and new fragmentation, the fine fraction governs the whole behaviour. This is important in particular for the design of
embankment dam. Recent numerical simulations by de Frias Lopez et al. (2016), Minh & Cheng (2016) and Shire et al. (2016) also support our findings.
5 ACKNOWLEDGEMENTS
The authors would like to thank Prof. Gioacchino Viggiani for giving the opportunity to the second author to conduct research at City, University of London. The first author also acknowledges City, University of London for his doctoral scholarship.
6 REFERENCES
Altuhafi, F. N. and Coop, M. R. 2011. Changes to particle characteristics
associated with the compression of sands. Géotechnique 61(6):
459-471.
BS 1377:1990, Methods of test for soils for civil engineering purposes. Cavarretta, I. 2009. The influence of particle characteristics on the
engineering behaviour of granular materials. PhD Thesis, Imperial
College London.
Coop, M.R. 1990. The mechanics of un-cemented carbonate sands.
Géotechnique 40(4): 607-626.
Coop, M. R., Sorensen, K. K., Freitas, T. B., and Georgoutsos, G., 2004.
Particle breakage during shearing of a carbonate sand. Géotechnique
54(3):157-163.
de Frias Lopez, R., Silfwerbrand, J., Jelagin, D. and Birgisson, B. 2016.
Géotechnique 66(7): 578-583.
Di Pasquale, L., 2016. Particle breakage of granular material in 1D
compression. MSc Thesis, Université Grenoble Alpes.
Einav, I., 2007. Breakage mechanics - Part I: Theory. Journal of the
Mechanics and Physics of Solids 55(6):1274-1297.
Fonseca, J., O'Sullivan, C., Coop, M. R., & Lee, P. D. 2013. Quantifying the evolution of soil fabric during shearing using scalar parameters.
Géotechnique 63 (10): 818-829.
Hardin, B. O., 1985. Crushing of soil particles. Journal of Geotechnical
Engineering 111(10):1177-1192.
Marketos, G. and Bolton, M.D. 2010. Flat boundaries and their effect on
sand testing. Int. J. Numer. Anal. Meth. Geomech. 34, 821–837.
Marsal, R. J. 1967. Large scale testing of rockfill materials. Journal of
Soils Mechanics and Foundation Division 93(2): 27-44.
McDowell, G. R. and Bolton, M. D. 1998. On the micro mechanics of
crushable aggregates. Géotechnique 48(5): 667-679.
Mesri, G. and Vardhanabhuti, B. 2009. Compression of granular
materials. Canadian Geotechnical Journal 46(4): 369-392.
Minh, N. H. and Cheng, Y. P. 2016. On the contact force distributions of
granular mixtures under 1d-compression. Granular Matter 18(18):
1-12.
Nadimi, S. and Fonseca. J. 2016. Enhancing soil sample preparation by
thermal cycling. Géotechnique. DOI: 10.1680/jgeot.15.T.033.
Nadimi, S. and Fonseca, J. 2017. On the tensile strength of soil grains in
Hertzian response. 8th International conference on micromechanics
of granular media, Powders & Grains, Montpellier, France.
Shire, T., O’Sullivan, C. and Hanley, K. J. 2016. The influence of fine content and size-ratio on the micro-scale properties of dense bimodal
materials. Granular Matter 18:52.
Tsongui, O., Vallet, D., and Charmet, J. 1999. Numerical model of
crushing of grains inside twodimensional granular materials. Powder
Technology 105: 190-198.
Vallejo, L.E., 2001. Interpretation of the limits in shear strength in binary
granular mixtures. Can. Geotech. J. 38(5): 1097-1104.
Vilhar, G., Jovicic, V., and Coop, M. R. 2013. The role of particle
breakage in the mechanics of a non-plastic silty sand. Soils and
Foundations 53(1): 91-104.
Wood, D.M., 2006. Geomaterials with changing grading: a route towards modelling. In: International Symposium on Geomechanics
Geotechnical Particulate Media. IS-Yamaguchi, 12–14 September
2006, Ube, Japan, pp. 313–316.
Yan, W. M. and Shi, Y., 2014. Evolution of grain grading and characteristics in repeatedly reconstituted assemblages subject to
one-dimensional compression. GéotechniqueLetters 4(3): 223-229.
Zhang, S., Tong, C., Li, X., and Sheng, D., 2015. A new method for
studying the evolution of particle breakage. Géotechnique 65(11):
911-922.
0.0 0.1 0.2 0.3 0.4 0.5 0.6 0.7
0 10 20 30 40 50 60
Breakage
index
Verical stress, MPa
FC=100% FC=80%
FC=60% FC=40%
FC=20% FC=0%
0 3 6 9 12 15
0 20 40 60 80 100
Drop i
n
load, kN
Fine content, %
40MPa
[image:5.595.68.261.412.524.2]