1
Comparative analysis of the toxicity of gold nanoparticles
1in zebrafish
2Srinath Patibandla1, Yinan Zhang2,3, Ali Mohammad Tohari1,4, Peng Gu2, James Reilly1, Yu 3
Chen2, Xinhua Shu1* 4
1 Department of Life Sciences, Glasgow Caledonian University, Glasgow G4 0BA 5
2 Department of Physics, University of Strathclyde, Glasgow G4 0NG 6
3. College of Physics, Jilin University, Changchun, 130012, China 7
4 King Fahad Hospital, Jazan, Saudi Arabia P.O BOX 204 8
* Corresponding author Xinhua Shu, Email: [email protected] 9
10
11
12
13
14
15
16
17
18
19
20
21
22
23
2
Abstract
25
The use of nanoparticles - particles that range in size from 1 to 100 nanometres - has become 26
increasingly prevalent in recent years, bringing with it a variety of potential toxic effects. 27
Zebrafish embryos were exposed during the 3-day post-fertilisation period to gold 28
nanospheres (GSSs), gold nanorods (GNRs), gold nanorods coated with polystyrene-sulfate 29
(PSS-GNRs), and gold nanorods coated with both polystyrene-sulfate and polyallamine 30
hydrochloride (PAH/PSS-GNRs). All nanorods were stabilised with 31
cetyltrimethylammonium bromide (CTAB). GNSs were the least toxic of the nanoparticles 32
studied, with exposure resulting in no significant changes in mortality, hatching or heart rate. 33
Exposure to GNRs and PSS-GNRs resulted in significant increases in mortality and 34
significant decreases in hatching and heart rate. Treatment with GNRs caused significant 35
changes in the expression of a variety of oxidative stress genes. The toxic effects of GNRs 36
were ameliorated by coating them with polystyrene-sulfate and, to a more marked extent, 37
with a double coating of polystyrene-sulfate and polyallamine hydrochloride. 38
Keywords Nanoparticles; nanospheres; nanorods; zebrafish; toxicity 39
40
Short abstract
41
Zebrafish embryos were exposed during the 3-day post-fertilisation period to gold 42
nanospheres (GSSs), gold nanorods (GNRs), and to gold nanorods coated with polystyrene-43
sulfate alone (PSS-GNRs) or in combination with polyallamine hydrochloride (PAH/PSS-44
GNRs). All nanorods were stabilised with cetyltrimethylammonium bromide. Exposure to 45
GNSs had no significant effects, whereas exposure to GNRs and PSS-GNRs significantly 46
affected hatching, heart rate and mortality. Exposure to GNRs caused significant changes in 47
the expression of various oxidative stress genes. Coated nanorods had markedly less toxic 48
3
1 INTRODUCTION
50
Particles ranging in size from 1 to 100 nanometres (nm) are known as nanoparticles; the use 51
of such particles is known as nanotechnology. In the field of biology, engineered 52
nanoparticles have been put to a variety of uses, including (to mention only a few examples): 53
as fluorescent biological labels, in the diagnosis, monitoring and destruction of tumours, in 54
detection of pathogens and proteins, in gene expression and phagokinetic studies, and in MRI 55
contrast enhancement (Salata, 2004; Zhang et al, 2010, 2011, 2015;). Carbon nanoparticles 56
are widely used in vehicles and sports equipment. Cerium oxide is used in electronics, fuel 57
additives and biomedical supplies, while titanium dioxide is widely employed in cosmetics, 58
paints and coatings. Silver nanoparticles are used in the food and textile industries for their 59
antimicrobial properties, while iron nanoparticles are used as smart fluids in the fields of 60
optics and food supplement industries Gold nanoparticles have been used in drug delivery, 61
tumour detection, gene therapy, and as photothermal agents (Asharani et al., 2008; Wei, 62
2015, 2016). 63
The bio-distribution and bioactivity of nanoparticles, and the resulting human and 64
environmental impact, are not well known, but their effects have been investigated in a 65
variety of in-vitro and in-vivo studies. There is evidence that nanoparticles such as carbon, 66
silver, iron, cerium and titanium oxides exhibit toxicological impacts on the environment 67
(Asharani et al., 2009). This potential toxicity has become a matter of concern. Some studies 68
have reported a significant increase in inflammation markers in the airways, leakage of the 69
blood-brain barrier, neuronal damage and cerebral oedema after exposure to nanoparticles 70
(Cattaneo et al., 2014). Zinc oxide nanoparticles show anti-microbial activity by damaging 71
cell membranes and organelles and might cause the same kind of damage to eukaryotic cells 72
(Marambio-Jones et al., 2010). Zinc oxide nanoparticles can cause cytotoxicity in immune 73
4
nanoparticles have a greater potential for damage compared to larger particles (Asharani et 75
al., 2008). Given the range of possible toxic effects, and the wide variety of nanoparticles 76
implicated in these effects, more research is needed to identify the ways by which they 77
disperse, their impact on organisms and on the environment, and how to minimise these 78
effects. 79
One approach is to use the zebrafish animal model to assess toxicity caused by 80
nanoparticles. The zebrafish is recognised as an alternative model by which to analyse human 81
physiology, development and disease. It has been used widely because of its many benefits 82
such as easy maintenance in labs, production of large number of optically transparent eggs, 83
homology to the human genome, and rapid development of the embryo to adult fish by the 84
end of week 1 post fertilisation. The zebrafish embryos are preferable because of their 85
sensitivity to test chemicals and their ability to absorb test substances through their skin and 86
gills from the surrounding water (Bar-Ilan et al., 2009). Transmission electron microscopy 87
(TEM) and acridine orange staining have been used to investigate the distribution of 88
nanoparticles (and the resulting cell death) in blood, brain and yolk sac in zebrafish embryos 89
(Asharani et al., 2008;). 90
91
2 MATERIALS AND METHODS
92
2.1 Nanoparticle syntheses and characterization
93
Gold nanospheres (GNSs) were prepared according to the Turkevich method (Kimling et al. 94
2006). Gold nanorods (GNRs) were synthesised by the seeded growth method (Murphy & 95
Jana (2002). Typically, 2.5ml HAuCl4x3H2O (0.001M) and 0.6ml ice-cold NaBH4 (0.01M) 96
were added to 7.5ml cetyltrimethylammonium bromide (CTAB) (0.12M) to prepare the seed 97
solution. The growth solution was synthesized by adding 0.15M 98
5
silver nitrate (AgNO3) (0.004M) and 700μl ascorbic acid (0.778M) to 50ml CTAB solution 100
(0.1M). 80μl seed solution (2 hours after preparation) was then injected into the growth 101
solution to grow gold nanorods. The nanorods could then be coated with a single layer of PSS 102
or a double layer of PAH-PSS using the method described by Omura et al. (2009). 103
GNSs, GNRs and polymer coated GNRs sample solutions (quantity 3ml) were placed in a 104
quartz cuvette and absorption spectroscopy studies carried out using a JASCO V-660 105
absorption spectrometer. The physical properties of the prepared gold nanoparticles were 106
characterized using transmission electron microscopy (TEM). 107
2.2 Nanoparticle treatment
108
The zebrafish (Danio rerio) used in this study were obtained from our fish breeding stocks 109
ZEBTEC zebrafish housing system (Tecniplast), Glasgow Caledonian University. Fish are 110
kept in 5L plastic tanks supplied with a constant flow of conditioned water at a temperature 111
of 28C with pH 7.5 on a 14:10h light/dark photoperiod. Eggs were collected from a group of 112
spawned zebrafish. 113
The embryos were exposed to GNSs, GNRs, PSS-GNRs or PAH/PSS-GNRs at 114
concentrations of 0.01, 0.025, 0.05 and 0.1nM in a 48–well plate. To prepare the dilutions, 115
each sample of nanoparticles was mixed with system water. For the negative control, system 116
water alone was used. The collected eggs were bleached with chlorine water at a 117
concentration of 5µl of 10-15% chlorine water in 17 ml of system water for 2 to 3 minutes to 118
avoid any contamination and infection, then washed three times with fresh system water to 119
remove any traces of chlorine. Within 2h post fertilisation (hpf), fertilised and normally 120
developing fish eggs were transferred into each well (8 embryos/well) using a plastic pipette, 121
then incubated at 28C. The eggs were exposed to the test samples during the 3-days post-122
fertilisation period and inspected at 24, 48 and 72 hpf for mortality, hatching, morphological 123
6
Mortality of the embryos was noted at 24, 48 and 72 hours of nanoparticle treatment. The 125
opaque and white embryos were transferred along with the medium to other empty wells and 126
inspected in order to differentiate dead embryos (which quickly degrade) from abnormal or 127
malformed embryos. The abnormal embryos were again transferred to their respective test 128
wells. Mortality rate is expressed as the percentage of dead embryos after 72 hpf (hours post 129
fertilisation). Hatching rate (expressed as the percentage of embryos that had hatched by 72 130
hpf) was recorded. Heart rate was monitored at 72 hpf using a stopwatch and direct 131
microscopic observation. Tail detachment, the formation of somites, presence of brown flakes 132
and any abnormalities were observed and noted. 133
2.3 Acridine orange staining
134
To investigate the cell death (apoptosis) caused by nanoparticles, acridine orange staining of 135
nanoparticle-treated embryos was performed. Acridine orange is a nucleic-acid-selective 136
metachromatic dye that emits green fluorescence upon intercalation with DNA and is widely 137
used for detecting the sites of apoptosis in zebrafish. Acridine orange can permeate apoptotic 138
cells and bind to DNA whereas normal healthy cells are non-permeable to acridine orange. 139
Acridine orange staining was performed according to previous description (Shu et al., 2010). 140
Briefly, the embryos were transferred to 1.5ml Eppendorf tubes and stained with acridine 141
orange (5 µg/ml) for 20 min at room temperature. Embryos were washed quickly in 1×PBS 142
and were observed using green fluorescence microscopy. The fluorescent signals from 143
apoptotic cells (heart and eye areas) were quantified using ImageJ software 144
(https://imagej.nih.gov/ij/). In brief, the heart and eye areas were selected using the selection 145
tool, and the integrated density and mean gray value were measured. In each case, a nearby 146
region with background fluorescence was selected for comparison, and the integrated density 147
7
using the formula: total fluorescent signals = integrated density - mean fluorescent signals of 149
background. 150
2.4 RNA extraction
151
Zebrafish eggs were collected in a Petri dish and bleached with chlorine to prevent infections. 152
At 6hpf embryos were treated with 4 nanoparticle samples (2.5 µM GNS, 0.01 nM GNR, 153
0.025 nM PSS-GNR and 0.05 nM PAH/PSS-GNR) till 72hpf with E3 medium as control. 154
The treated zebrafish embryos were homogenised in 1 ml of TRIzol® Reagent (Invitrogen 155
cat. no. 15596-026) per 50–100 mg of the tissue sample. Homogenised samples were 156
incubated for 5 minutes at room temperature to allow complete dissociation of the 157
nucleoprotein complex. 200 µl of 100% chloroform per 1 ml of TRIzol® Reagent used for 158
homogenization was added to each sample. All samples were manually and vigorously 159
shaken for 15 seconds and allowed to stand for 2-3 minutes at room temperature. All tubes 160
were centrifuged at 12,000 × g for 15 minutes at 4°C. The resulted supernatant contains three 161
aqueous layers in which RNA is found in the top layer. Each upper aqueous layer was 162
transferred to a fresh 1.5 ml Eppendorf tube and 500 µl of 100% isopropanol per 1 mL of 163
TRIzol® Reagent used for homogenization was added to the aqueous phase and allowed to 164
stand for 10 minutes at room temperature. All tubes were then centrifuged at 12,000 × g for 165
10 minutes at 4°C. Supernatants were discarded by inverting the tubes leaving only the RNA 166
pellet which was then washed by adding 75% ethanol. Following centrifugation the RNA 167
pellet was allowed to stand for 5-10 minutes at room temperature to permit the evaporation of 168
remaining traces of the ethanol wash. The RNA pellet was resuspended in 25 µl of RNase-169
free water and the purity was assessed using Nanodrop spectrophotometer (ND1000) in 170
which RNA purity is defined as A260/280 ratio. 171
2.5 cDNA synthesis
8
Complementary DNA (cDNA) synthesis was performed using Roche Transcriptor High 173
Fidelity cDNA Synthesis Kit (cat. no. 05091284001) according to the manufacturer's 174
instructions. The protocol was carried out in 20µl reaction volume in two steps. First step: 175
4µl of neat RNA was incubated with 2µl of 600µM random hexamer primer and 5.4µl 176
RNase-free water for 10 minutes at 65°C and the product was immediately chilled in ice. The 177
second step involved addition of 8.6 µl of a master mix containing 4 µl of 5X transcriptor 178
high fidelity reverse transcriptase reaction buffer, 0.5 µl of 40 U/µl Protector RNase inhibitor, 179
2 µl of 10 mM deoxynucleotide mix, 1 µl of 0.1M Dithiothreitol (DTT) and 1.1 µl of 100U/ 180
µl of transcriptor high fidelity reverse transcriptase followed by brief centrifugation at 4°C. 181
The cDNA reaction mixture was incubated in a thermal cycler for 10 minutes at 29°C 182
followed by a second incubation for 60 minutes at 48°C and then final incubation for 5 183
minutes at 85°C to inactivate the transcriptor high fidelity reverse transcriptase. The resultant 184
cDNA was then quantified using Nanodrop spectrophotometer (ND1000) and stored at -185
20°C. 186
2.6 Quantitative real-time PCR (qRT-PCR)
187
The expression of candidate oxidative stress genes following zebrafish microparticles 188
treatment was analysed using Platinum® SYBR® Green qPCR SuperMix-UDG master mix 189
(Invitrogen Cat 11733-046) according to the manufacturer's protocol in a final volume of 190
20µl containing 10 µl of Platinum® SYBR® Green qPCR mix, 7µl of PCR-grade water, 1µl 191
of forward primer (10µM), 1µl of reverse primer (10µM), and 1µl of 50ng/ µl of cDNA. The 192
primer sequences of target genes are listed in Table 1. The qRT-PCR reaction mixture was 193
then assayed using the Biorad CFX96TM Real-Time PCR detection system under the 194
following PCR conditions: UDG incubation at 50°C for 2 minutes followed by Taq 195
polymerase activation for at 95°C for 2 minutes and 40 cycles of 95°C for 15 seconds, 55°C 196
9
The amount of mRNA is determined by normalizing the threshold cycle CT of the candidate 198
gene to the CT of ZF18sRNA reference gene in the same sample based on the following 199
formula: the average CT of target gene - the average CT of reference gene in which this result 200
is recognized as ΔCT where it is specific for each gene and can be compared with ΔCT of 201
calibration samples. The difference between ΔCT of target and control genes is known as 202
ΔΔCT. The relative quantification of target gene expression is calculated in comparison with 203
control according to the following formula: 2- ΔΔCT and represented as a fold change. 204
2.6 Statistical analysis
205
All experiments were done at least in triplicate. Data were expressed as mean (±standard 206
error) and subjected to analysis of variance (ANOVA) followed by the Tukey’s test. ANOVA 207
assumptions (normality and homogeneity of variances) were previously checked. The 208
significance level adopted was 95% (C= 0.05). 209
3 RESULTS
210
3.1 Characteristics of nanoparticles
211
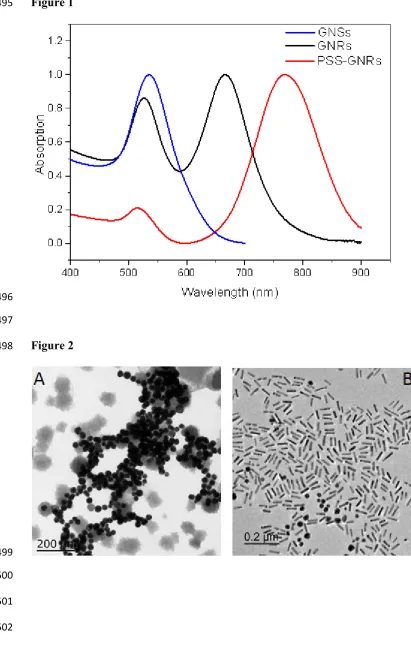
The absorption spectra for GNRs, PSS-GNRs and GNSs are shown in Figure 1. As can be 212
seen, the surface plasmon of GNSs peaks at 525nm, while there are two peaks both for GNSs 213
and PSS-coated GNRs: one located around 525nm (which is referred to as the transverse 214
mode) and one in the near infra-red band (known as the longitudinal mode). The surface 215
plasmon structure depends critically on the particle size, shape and surface conditions. Figure 216
2 shows typical TEM images of gold nanospheres and gold nanorods of longitudinal surface 217
plasmon resonance peak centred at around 800 nm. Diameter 38.1 ± 2.8 nm are derived from 218
TEM analysis for gold nanospheres. Diameter 12.7 ± 1.8 nm and length 51.6 ± 8.2 nm are 219
found for gold nanorods. The aspect ratio (long axis divided by diameter) of GNRs is around 220
4. Further PSS and PAH coating were applied to this GNR. 221
3.2 Effect of nanoparticles on mortality, hatching and heart rate
10
To assess the potential toxicity of the nanoparticles, testing was performed in zebrafish 223
embryos at 6hpf to 120hpf. Toxic endpoints such as mortality, hatching, heart rate and 224
abnormalities were observed and recorded. The doses (0.01nM, 0.025nM, 0.05nM and 225
0.1nM) of nanoparticles were prepared from 0.1nM stock. The toxic end points were 226
observed, recorded and analysed. 227
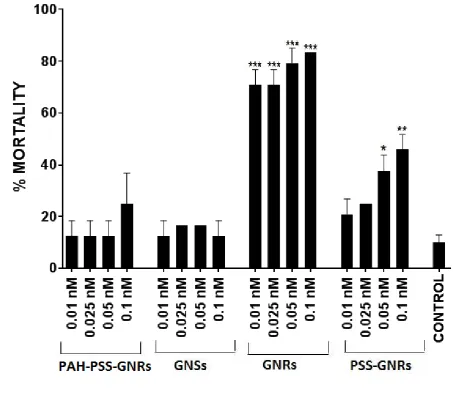
Mortality was defined as the percentage of dead zebrafish eggs from the total number of 228
eggs used for the particular test sample. In the control groups at 72 hpf mortality was below 229
10% in all experiments, therefore the requirement of OECD guidelines 230
(http://www.oecd.org/) for a valid test was always met and the observed effects can be 231
attributed to these nanoparticle samples. Most of the eggs showed coagulation at 24hpf and 232
by 48hpf many of the vital embryos had no heartbeat and were determined as mortal. A few 233
showed developmental retardation and were determined as mortal at 24hpf. Mortality rate is 234
shown in Figure 3. GNRs (CTAB capped) induced a statistically significant increase in 235
mortality at all doses. PSS-GNRs induced a statistically significant increase in mortality only 236
at the high doses. PAH/PSS-GNRs and GNSs caused no significant mortality at all doses 237
tested. 238
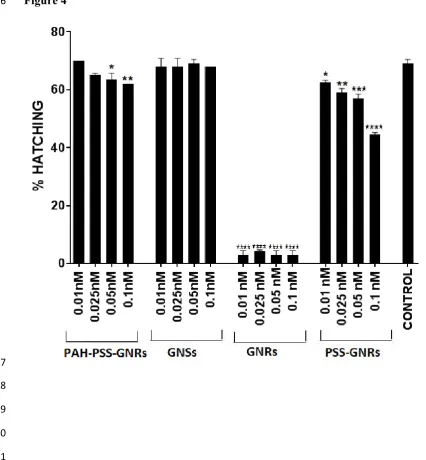
Hatching is defined as the percentage of embryos hatched by the end of the 3rd day from 239
the total number of embryos used for the particular test sample. In the control groups at 72 240
hpf, the hatching was above 70% in all experiments. Embryos out of their chorion were 241
determined as hatched and the others were termed as unhatched. Hatching rate is shown in 242
Figure 4. Exposure to GNRs and PSS-GNRs caused a statistically significant decrease in 243
hatching at all doses. PAH/PSS-GNRs induced a statistically significant decrease in hatching 244
only at high doses and GNSs had no effect on hatching at all the doses tested. 245
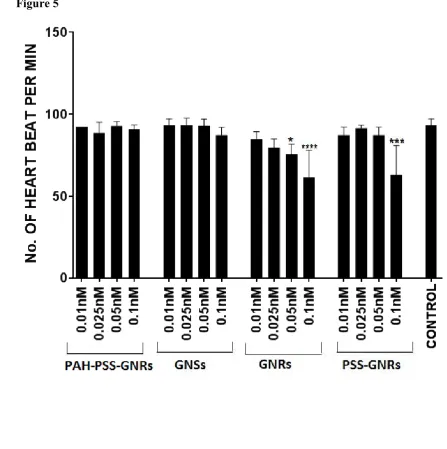
Heart rate (number of heart-beat per minute) at the end of treatment was observed with a 246
11
samples was compared with the heart rate of control embryos (E3 medium) at 120hpf. Heart 248
rates are shown in Fig. 5. GNRs and PSS-GNRs induced a statistically significant decrease in 249
the heart rate in zebrafish embryos at the high doses only. PAH/PSS-GNRs and GNSs 250
showed no significant impact on the heart rate at all doses tested. 251
3.3 Effect of nanoparticles on expression of oxidative stress genes
252
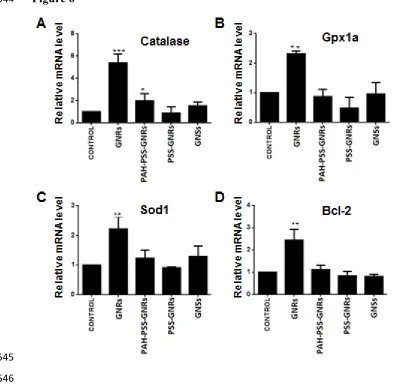
Oxidative stress represents an imbalance between the production of reactive oxygen species 253
(ROS) and the neutralization of excess ROS by cellular antioxidant defences. Nanoparticles 254
have been demonstrated to cause oxidative stress in different types of cells and animal 255
models including zebrafish (Abdal Dayem et al., 2017; Choi et al., 2010; Faria et al., 2014; 256
Zhao et al., 2016). Using qRT-PCR we examined expression of oxidative stress related genes 257
in nanoparticle treated and control zebrafish embryos and found that treatment with GNRs 258
induced significant changes in the expression of all the oxidative stress related genes studied 259
compared to the controls (Fig. 6). PAH-PSS-GNRs induced a significant change only in 260
catalase expression, while treatment with GNSs and PSS-GNRs caused no significant change 261
in the examined genes. The results clearly demonstrate that PSS coating on GNR 262
nanoparticles reduced toxicity, possibly by forming a protective layer around CTAB of 263
GNRs. 264
3.4 Effect of nanoparticles on apoptosis
265
Acridine orange staining was performed to detect any apoptosis caused by the nanoparticle 266
treatment (Fig. 7). It is important for a multicellular organism to maintain and regulate cell 267
numbers. One such response to injury or infection is apoptosis. Acridine orange staining 268
works on the principle that healthy cells are not permeable to acridine orange, which can pass 269
through only the damaged cell membrane. Each bright spot represents an area of cell death, 270
12
Apoptosis was seen in all the cases of nanoparticle treatment, although the intensity varied, 272
becoming greater with a rise in nanoparticle concentration (data not shown). 273
4 DISCUSSION
274
From the displayed results (Fig. 3, 4, and 5), it can be seen that GNRs (CTAB capped) 275
showed high toxicity when compared to the other types of gold nanoparticles tested. GNRs 276
induced a statistically significant increase in mortality and decrease in hatching percentage at 277
all doses. GNRs also showed a significant decrease in heart rate at high doses. PSS-GNRs 278
induced a statistically significant decrease in hatching rate at all doses and increased 279
mortality and decreased heart rate at high doses. PAH/PSS-GNRs showed a significant 280
decrease in hatching at high doses. GNSs showed no significant toxicity even at the highest 281
dose. This may be due to the shape of the nanoparticle or the surfactant used for the purpose 282
of capping. It is clearly seen that PSS and PAH/PSS-capped GNRs induced less toxic effects 283
when compared to GNRs. The toxic impact of GNRs may be due to CTAB (surfactant). The 284
toxicity of CTAB was investigated by Wang et al. (2008) and Alkilany et al. (2009). Similar 285
toxic effects of nanoparticles on HEP-2 and MDCK cells were reported by Zhang et al., 286
(2012). This difference in toxicity cannot be explained only by the size and shape of the 287
nanoparticle. To account for the difference, two interesting explanations have been proposed. 288
One of them involves the charge on the nanoparticle while the other pertains to the diffusion 289
pathway. In the case of the former, it has been shown that gold nanoparticles which are 290
cationic are more toxic as it is easier for them to be absorbed into the negatively charged cell 291
membrane; in the case of the latter, nanoparticles that are cationic can pass through the cell 292
membrane via the direct diffusion pathway while anionic nanoparticles have to pass through 293
the cell membrane by endocytosis. Given that both GNRs and PAH/PSS-GNRs are cationic 294
while GNSs and PSS-GNRs are anionic, these characteristics in combination with the toxic 295
13
Nanoparticles can induce oxidative stress in human fibroblasts, erythrocytes, vascular 297
endothelial cells, mesenchymal stem cells and a variety of tumour cells (Abdal Dyem et al., 298
2017). Nanoparticles have also been shown to cause oxidative stress in zebrafish embryos 299
and in the liver of adult zebrafish (Choi et al., 2010; Du et al., 2017; Faria et al., 2014; Zhao 300
et al., 2016). Catalase, GPX and SOD are detoxifying enzymes for ROS that regulate redox 301
homeostasis (Abdal Dyem et al., 2017). Bcl2 plays an important role in regulation of ROS 302
generation and maintenance of the redox status (Hockenbery et al., 1993). Du et al. (2017) 303
showed that zinc oxide nanoparticle treatment resulted in significant increases in SOD and 304
GPX activities in zebrafish embryos. Zhao et al. (2016) also demonstrated significantly 305
increased SOD activity in zebrafish embryos treated with zinc oxide nanoparticles. We found 306
that GNRs markedly upregulated expression of Catalase, GPX1a, Sod1 and Bcl-2 genes (Fig. 307
6), suggesting that GNR treatment caused oxidative stress and led to antioxidant responses. 308
Nanoparticles have been reported to cause apoptosis in zebrafish embryos and tissues of 309
adult zebrafish (Choi et al., 2010; Du et al., 2017; Zhao et al., 2016). We examined the 310
apoptotic effects of nanoparticle exposure (0.05nM) and found the most common feature 311
being the crowded bright spots in the heart and eye areas (Fig. 7), representing the 312
accumulation of toxic substances ultimately leading to apoptosis.Bcl-2 is considered to be an 313
anti-apoptotic protein that protects cells from apoptosis (Hockenbery et al., 1993). The high 314
level of apoptosis observed in GNR-treated embryos (Fig. 7) was accompanied by a 315
significant upregulation of Bcl-2 expression in GNR-treated embryos when compared to 316
untreated control embryos (Fig. 6D), indicating a defensive response to counteract the 317
damaging effects of GNR exposure. A previous study reported that myocyte apoptosis can 318
lead to dilated cardiomyopathy (Wencker et al., 2003). Similar results were reported when 319
zebrafish were treated with hexabromocyclododecane (HBCD) and microcystins (MCs). 320
14
treatment process, which may result in a reduction of heart rate and blood flow and ultimately 322
slowing growth and development (Zeng et al., 2014; Ulukaya et al., 2011; Deng et al., 2009). 323
Similar results were reported by Zhang et al., 2012, when nanoparticles were tested on HEP-324
2 and MDCK cells. Abnormalities were also observed in the higher concentration of each 325
sample. The abnormalities include slimy fluid with brown flakes, abnormal spine, heart 326
oedema, curved tail, and degraded body parts (data not shown). 327
5 CONCLUSION
328
GNRS and PSS-GNRS exhibited significant toxic action by increasing mortality and by 329
decreasing hatching and heart rate. The results clearly demonstrate that the GNRs are the 330
most toxic and GNSs the least toxic of all the compared nanoparticles. PSS coating on GNRs 331
nanoparticles reduced toxicity possibly by forming a protective layer around CTAB of GNRs. 332
The addition of an extra layer of PAH on PSS-GNRs further reduced the toxicity. This may 333
be a result of the coating which leads to the further isolation of toxic CTAB from cell 334
membrane and hence a change in toxicity. This might suggest a new way to combat toxicity 335
although further study is required. 336
ACKNOWLEDGEMENT
337
This work was supported by the Royal Society, the Rosetrees Trust (M160, M160-F1 and 338
M160-F2), the Glasgow Children’s Hospital Charity (YRSS/PSG/2014), and the Visual 339
Research Trust (VR2014). Maintenance of the zebrafish facility was funded by the European 340
Union INTERREG NEW noPILLS programme. 341
342
REFERENCES
343
Abdal Dayem, A., Hossain, M.K., Lee, S.B., Kim, K., Saha, S.K., Yang, G.M., … Cho, S.G. 344
(2017). The role of reactive oxygen species (ROS) in the biological activities of 345
15
Alkilany, A.M., Nagaria, P.K., Hexel, C.R., Shaw, T.J., Murphy, C.J., & Wyatt, M.D (2009). 347
Cellular uptake and cytotoxicity of gold nanorods: molecular origin of cytotoxicity and 348
surface effects. Small, 5(6), 701-708. 349
Asharani, P.V., Low Kah Mun, G., Hande, M.P., & Valiyaveettil, S. (2008). 350
Cytotoxicity and genotoxicity of silver nanoparticles in human cells. ACS Nano, 3(2), 279-351
290. 352
Asharani, P.V., Wu, Y.L., Gong, Z., & Valiyaveettil, S. (2008). Toxicity of silver 353
nanoparticles in zebrafish models. Nanotechnology, 19(25), 255102. 354
Bar-Ilan, O., Albrecht, R. M., Fako, V. E., & Furgeson, D. Y. (2009). 355
Toxicity assessments of multisized gold and silver nanoparticles in zebrafish embryos. 356
Small, 5(16), 1897-1910. 357
Cattaneo, A. G., Gornati, R., Bernardini, G., Sabbioni, E., Manzo, L., & Di Gioacchino, M. 358
(2014). Testing nanotoxicity: an update of new and traditional methods. Handbook of 359
Nanotoxicology, Nanomedicine and Stem Cell Use in Toxicology, 3-34. 360
Choi, J.E., Kim, S., Ahn, J.H., Youn, P., Kang, J.S., Park, K., … Ryu, D.Y. (2010). 361
Induction of oxidative stress and apoptosis by silver nanoparticles in the liver of adult 362
zebrafish. Aquatic Toxicology, 100, 151-159. 363
Deng, J., Yu, L., Liu, C., Yu, K., Shi, X., Yeung, L.W., … Zhou, B. (2009). 364
Hexabromocyclododecane-induced developmental toxicity and apoptosis in zebrafish 365
embryos. Aquatic Toxicology, 93(1), 29-36. 366
Du, J., Cai, J., Wang, S., & You, H. (2017). Oxidative stress and apotosis to zebrafish (Danio 367
rerio) embryos exposed to perfluorooctane sulfonate (PFOS) and ZnO nanoparticles. 368
16
Faria, M., Navas, J.M., Ráldua, D., Soares, A.M., & Barata, C. (2014). Oxidative stress 370
effects of titanium dioxide nanoparticle aggregates in zebrafish embryos. Science of the Total 371
Environment, 470-471, 379-389. 372
Gu, A.H., Shi, X.G., Yuan, C., Ji, G.C., Zhou, Y., Long, Y., … Wang, X.R. (2010). 373
Exposure to fenvalerate causes brain impairment during zebrafish development. 374
Toxicology Letters, 197, 188-192. 375
Hanley, C., Thurber, A., Hanna, C., Punnoose, A., Zhang, J., & Wingett, D.G. (2009). 376
The influences of cell type and ZnO nanoparticle size on immune cell cytotoxicity and 377
cytokine induction. Nanoscale research letters, 4(12), 1409. 378
Hockenbery, D.M., Oltvai, Z.N., Yin, X.M., Milliman, C.L., Korsmeyer, S.J. (1993). Bcl-2 379
functions in an antioxidant pathway to prevent apoptosis. Cell, 75(2), 241-251. 380
Jiang, J.Q., Zhou, Z., Patibandla, S., & Shu, X. (2013). Pharmaceutical removal from 381
wastewater by ferrate (VI) and preliminary effluent toxicity assessments by the zebrafish 382
embryo model. Microchemical Journal, 110, 239-245. 383
Kimling, J., Maier, M., Okenve, B., Kotaidis, V. Ballot, H., & Plech, A. (2006). Turkevich 384
method for gold nanoparticle synthesis revisited. Journal of Physical Chemistry B, 109, 385
15700-15707. 386
Marambio-Jones, C., & Hoek, E. M. V. (2010). A review of the antibacterial effects of silver 387
nanomaterials and potential implications for human health and the environment. Journal of 388
Nanoparticle Research, 12(5), 1531− 1551. 389
Murphy, C.J. & Jana, N.R. (2002). Controlling the aspect ratio of inorganic nanorods and 390
nanowires. Advanced Materials, 14(1), 80-82. 391
Omura, N., Uechi, I., & Yamada, S. (2009). Comparison of plasmonic sensing between 392
17
Raghupathy, R.K., Gautier, P., Soares, D.C., Wright, A.F., & Shu, X. (2015). Evolutionary 394
Characterization of the retinitis pigmentosa GTPase regulator gene. Investigative 395
Ophthalmology and Visual Science, 56(11):6255-6264. 396
Salata, O. V. (2004) Applications of nanoparticles in biology and medicine. Journal of 397
Nanobiotechnology, 2(1), 3. 398
Shu, X., Zeng, Z., Gautier, P., Lennon, A., Gakovic, M., Patton, E.E., & Wright, A.F. (2010). 399
Zebrafish Rpgr is required for normal retinal development and plays a role in dynein-based 400
retrograde transport processes. Human Molecular Genetics, 19(4), 657-670. 401
Si, J., Zhang, H., Wang, Z., Wu, Z., Lu, J., Di, C., … Wang X. (2013). Effects of 12C 6+ ion 402
radiation and ferulic acid on the zebrafish (Danio rerio) embryonic oxidative stress response 403
and gene expression. Mutation Research, 745-746, 26-33. 404
Ulukaya, E., Acilan, C., & Yilmaz, Y. (2011). Apoptosis: why and how does it occur in 405
biology? Cell Biochemistry and Function, 29(6), 468-480. 406
Wencker, D., Chandra, M., Nguyen, K., Miao, W., Garantziotis, S., Factor, S.M., & Kitsis, 407
R.N. (2003). A mechanistic role for cardiac myocyte apoptosis in heart failure. Journal of 408
Clinical Investigation, 111(10), 1497-1504. 409
Wang, S., Lu, W., Tovmachenko, O., Rai, U.S., Yu, H., & Ray, P.C. (2008). Challenge in 410
understanding size and shape dependent toxicity of gold nanomaterials in human skin 411
keratinocytes. Chemical Physics Letters, 463(1), 145-149. 412
Wei, G., Simionesie, D., Sefcik, J., Sutter, J. U., Xue, Q., Yu, J., … Chen, Y. (2015). 413
Revealing the photophysics of gold-Nanobeacons via time-resolved fluorescence 414
spectroscopy. Optics Letters, 40, 5738-5741. 415
Wei, G., Yu, J., Wang, J., Gu, P., Birch, D.J.S., & Chen, Y. (2016). Hairpin DNA-416
functionalized gold nanorods for mRNA detection in homogenours solution. Journal 417
18
Wolf, K., Stafoggia, M., Cesaroni, G., Andersen, Z.J., Beelen, R., Galassi, C., … Forastiere, 419
F. (2015). Long-term Exposure to Particulate Matter Constituents and the Incidence of 420
Coronary Events in 11 European Cohorts. Epidemiology, 26(4), 565-574. 421
Zhang, Y., Yu, j., Birch, D. J., & Chen, Y. (2010). Gold nanorods for fluorescence lifetime 422
imaging in biology. Journal of Biomedical Optics, 15, 20504. 423
Zhang, Y., Birch, D.J.S., & Chen, Y. (2011). Two-photon excited surface plasmon enhanced 424
energy transfer between DAPI and gold nanoparticles: Opportunities in intra-cellular imaging 425
and sensing. Applied Physics Letters, 99, 103701. 426
Zhang, Y., Xu, D., Li, W., Yu, J., & Chen, Y. (2012) Effect of size, shape, and surface 427
modification on cytotoxicity of gold nanoparticles to human HEp-2 and canine MDCK cells. 428
Journal of Nanomaterials, 2012, ID 375496. 429
Zhang, Y., Wei, G., Yu, J., Birch, D. J. S., & Chen Y. (2015). Surface plasmon enhanced 430
energy transfer between gold nanorods and fluorophores: application to endocytosis study 431
and RNA detection. Faraday Discuss, 178, 383-394 432
Zeng, C., Sun, H., Xie, P., Wang, J., Zhang, G., Chen, N., … Li, G. (2014). The role of 433
apoptosis in MCLR-induced developmental toxicity in zebrafish embryos. Aquatic
434
Toxicology, 149, 25-32. 435
Zhao, X., Ren, X., Zhu, R., Luo, Z., & Ren, B. (2016). Zinc oxide nanoparticles induce 436
oxidative DNA damage and ROS-triggered mitochondria-mediated apoptosis 437
in zebrafish embryos. Aquatic Toxicology, 180, 56-70. 438
19
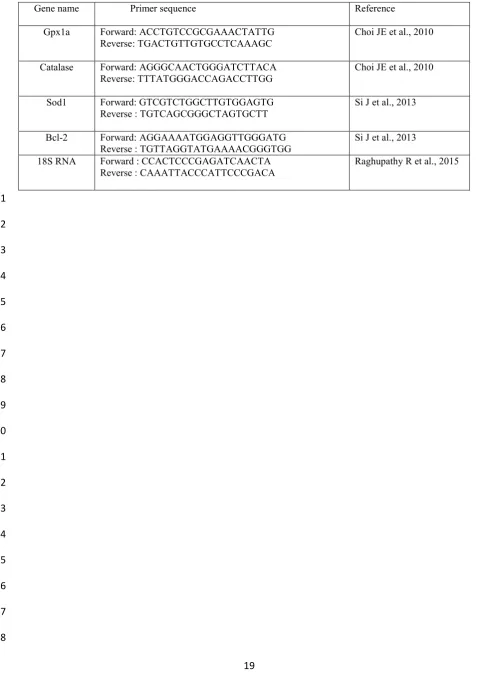
Table 1: Primers used in qRT-PCR.
440
Gene name Primer sequence Reference
Gpx1a Forward: ACCTGTCCGCGAAACTATTG
Reverse: TGACTGTTGTGCCTCAAAGC
Choi JE et al., 2010
Catalase Forward: AGGGCAACTGGGATCTTACA
Reverse: TTTATGGGACCAGACCTTGG
Choi JE et al., 2010
Sod1 Forward: GTCGTCTGGCTTGTGGAGTG
Reverse : TGTCAGCGGGCTAGTGCTT Si J et al., 2013
Bcl-2 Forward: AGGAAAATGGAGGTTGGGATG
Reverse : TGTTAGGTATGAAAACGGGTGG Si J et al., 2013
18S RNA Forward : CCACTCCCGAGATCAACTA
Reverse : CAAATTACCCATTCCCGACA
Raghupathy R et al., 2015
441
442
443
444
445
446
447
448
449
450
451
452
453
454
455
456
457
20
Figure legends:
459
Figure 1 Absorption spectra for GNRs, PSS-GNRs and GNSs 460
Figure 2 Transmission electric microscopy (TEM) images of gold nanospheres (A) and gold 461
nanorods (B).
462
Figure 3 Mortality of zebrafish embryos following 120 hpf treatments with different 463
concentrations of different nanoparticles. Eight embryos were used for each treatment. 464
Significant increases in mortality rate relative to that of control fish were observed following 465
exposure to all concentrations of GNRs and to 0.05 and 0.1nM PSS-GNRs. (***p<0.001; ** 466
p<0.01; *p<0.05). Values are expressed as mean ± standard deviation. 467
Figure 4 Hatching rate of zebrafish embryos following 72 hpf treatments with different 468
concentrations of different nanoparticles. Eight embryos were used for each treatment. 469
Significant decreases in hatching rate relative to that of control fish were observed following 470
exposure to all concentrations of GNRs and PSS-GNRs and to 0.05 and 0.1nM PSS/PSH-471
GNRs (****p<0.0001; *** p<0.001; **p<0.01; *p<0.05). Values are expressed as mean ± 472
standard deviation. 473
Figure 5 Heart rate (beats per minute) of zebrafish embryos following 120 hpf treatments 474
with different concentrations of different nanoparticles. Significant differences in heart rate 475
relative to that of control fish were observed following exposure to 0.05 and 0.1nM GNRs 476
and to 0.1nM PSS-GNRs (****p<0.0001; *** p<0.001; * p<0.05). Values are expressed as 477
mean ± standard deviation. 478
Figure 6 Expression of oxidative stress genes in zebrafish embryos treated with nanoparticles 479
(2.5 µM GNS, 0.01 nM GNR, 0.025 nM PSS-GNR and 0.05 nM PAH/PSS-GNR) from 6 hpf to 72
480
hpf. (A) Catalase, (B) Gpx1a, (C) Sod1, (D) Bcl-2. Significant differences in gene expression 481
relative to that in control fish are indicated by asterisks (***p<0.001 and ** p<0.01). Data 482
were presented as mean ± standard deviation. 483
Figure 7 Acridine orange staining of zebrafish embryos (48 hpf) treated with 0.05nM 484
concentration of nanoparticles. (A) GNRs, (B) GNSs, (C) PSS-GNRs, (D) PSS/PSH-GNRs, 485
(E) Control. (F)The bright green spots indicate the presence of apoptotic cells. The 486
fluorescent signals were quantified using ImageJ, the relative fluorescent signals in treated 487
zebrafish embryos were significantly higher than that of control embryos. GNRs-treated 488
21
Figure 1
495
496
497
Figure 2
498
499
500
501
502
[image:21.595.41.453.77.725.2]22
Figure 3
504
505
506
507
508
509
510
511
512
513
514
[image:22.595.64.518.100.507.2]23
Figure 4
516
517
518
519
520
521
522
523
524
525
526
527
528
[image:23.595.48.475.79.540.2]24
Figure 5
530
531
532
533
534
535
536
537
538
539
540
541
542
[image:24.595.56.504.76.526.2]25
Figure 6
544
545
546
547
548
549
550
551
552
553
554
555
556
557
[image:25.595.40.440.81.473.2]26
Figure 7
559
560