R E S E A R C H
Open Access
Value of variation index of inferior vena
cava diameter in predicting fluid
responsiveness in patients with circulatory
shock receiving mechanical ventilation: a
systematic review and meta-analysis
Haijun Huang
*, Qinkang Shen, Yafen Liu, Hua Xu and Yixin Fang
Abstract
Background:Respiratory variations in the inferior vena cava diameter (ΔIVCD) have been studied extensively with respect to their value in predicting fluid responsiveness, but the results are conflicting. The aim of this meta-analysis was to explore the value ofΔIVCD for predicting fluid responsiveness in patients with circulatory shock receiving mechanical ventilation.
Methods:PubMed, Embase, and the Cochrane Central Register of Controlled Trials were searched up to June 2017.
The diagnostic OR (DOR), sensitivity, and specificity were calculated. The summary ROC curve was estimated, and the area under the ROC curve (AUROC) was calculated.
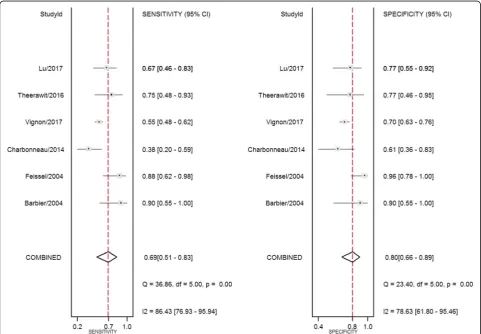
Results:Overall, 603 patients were included in this review, 324 (53.7%) of whom were fluid-responsive. The cutoff values ofΔIVCD varied across studies, ranging from 8% to 21%. Heterogeneity between studies was assessed with an overallQ= 0.069,I2= 0%, andP= 0.483. The pooled sensitivity and specificity for the overall population were 0. 69 (95% CI, 0.51–0.83) and 0.80 (95% CI, 0.66–0.89), respectively. The DOR was 9.28 (95% CI, 2.33–36.98). AUROCs were reported in five studies. Overall, the pooled AUROC was 0.82 (95% CI, 0.79–0.85).
Conclusions:The findings of this study suggest that theΔIVCD performed moderately well in predicting fluid responsiveness in patients with circulatory shock receiving mechanical ventilation.
Keywords:Fluid responsiveness, Inferior vena cava diameter, Mechanical ventilation, Meta-analysis
Background
Fluid resuscitation remains the cornerstone of treatment for patients with acute circulatory failure. Inappropriate administration of fluids has deleterious effects, including volume overload, systemic and pulmonary edema, and limitation of oxygen diffusion to tissues, thereby leading to increased tissue hypoxia [1–3]. Therefore, it is important to obtain reliable information about fluid responsiveness in patients with circulatory failure in the intensive care unit. However, clinicians often have in-accurate, nonspecific information to guide treatment.
Previous studies have shown that some parameters may be related to volume status. The traditional static parameters, such as intrathoracic blood volume index, pulmonary wedge pressure, pulse pressure variation, and central venous pressure, have been proved not to be re-lated to a patient’s volume status [1, 2]. Hemodynamic parameters, such as pleth variability index and stroke volume variation, may better predict fluid responsive-ness. However, the measurement of these parameters re-quires invasive procedures and special monitoring equipment, limiting their clinical application [3].
In recent years, ultrasound has been considered as a tool to help guide fluid resuscitation [4]. Respiratory variation in the inferior vena cava diameter (ΔIVCD)
* Correspondence:[email protected]
Emergency Department, The First Affiliated Hospital of Zhejiang Chinese Medical University, Zhejiang 310018, Hangzhou, China
measured by ultrasonography has been identified as a
predictor of dry weight in patients undergoing
hemodialysis [5,6].ΔIVCD has been identified as a pre-dictor of fluid responsiveness in spontaneously breathing patients in different clinical settings [7, 8]. The ΔIVCD under mechanical ventilation has also been proven as a reliable noninvasive indicator of fluid responsiveness in patients with sepsis [9,10].
The present systematic review and meta-analysis was conducted to assess the diagnostic accuracy of ΔIVCD for predicting fluid responsiveness in patients with circu-latory shock receiving mechanical ventilation. In this systematic review and meta-analysis, the test characteris-tics ofΔIVCD are summarized as a predictor of fluid re-sponsiveness in patients with circulatory shock receiving mechanical ventilation to elucidate further their diagnos-tic performance and to provide information for detecting fluid responders.
Methods
This meta-analysis was conducted according to the Pre-ferred Reporting Items for Systematic Reviews and Meta-Analyses guidelines [11].
Search strategy
Relevant studies up to June 2017 were searched in the PubMed, Embase, and Cochrane Library databases with the following terms and their combination:“fluid therapy,” AND“inferior vena cava,”AND“mechanical ventilation,” AND (“acute circulatory failure”OR“shock”). All scanned abstracts, studies, and citations were reviewed. Moreover, references of the retrieved manuscripts were also manu-ally cross-searched for further relevant publications.
Selection criteria
All the studies on the requirements forΔIVCD were eval-uated by two independent authors, and any disagreement was resolved by group discussion until a consensus was reached. The inclusion criteria were as follows: (1) studies on patients with shock receiving mechanical ventilation; (2) studies with a reference gold standard for diagnosing fluid responsiveness; (3) studies published in any language; and (4) studies providing sufficient data for constructing
two-by-two tables, including true-positive (TP),
false-positive (FP), true-negative (TN), and false-negative (FN). The exclusion criteria were as follows: (1) studies that used the same population or overlapping databases and (2) studies on animal models.
Data extraction and quality assessment
All the available data were extracted from each study by two investigators independently according to the afore-mentioned inclusion criteria, and any differences were resolved by discussion with a third investigator. The
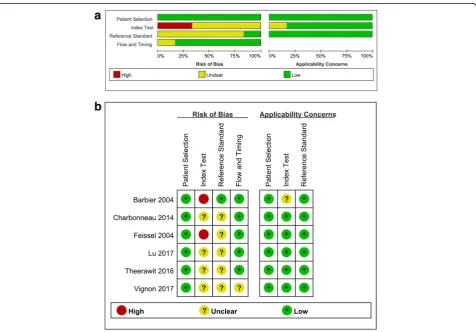
following data were collected from each study: (1) basic characteristics of studies, including name of the first author, publication year, country where the research was performed, sex, mean age, number of patients, tidal vol-ume, index test, reference standard measurement, refer-ence standard threshold, and referrefer-ence standard device; and (2) diagnostic performance, including cutoff value, sensitivity, specificity, area under the ROC curve (AUROC), TP, FP, FN, and TN. The quality of included studies was scored independently by two reviewers using the revised Quality Assessment of Diagnostic Accuracy Studies (QUADAS-2) criteria [12]. The quality of studies was assessed using RevMan (version 5.3, 2014; The Nor-dic Cochrane Centre, The Cochrane Collaboration, Copenhagen, Denmark), with four key domains: patient selection, index test, reference standard, and flow and timing. Seven questions were used to evaluate the qual-ity of included studies. Each question was answered with “yes,” “no,” or “unclear.” An answer of “yes” meant that the risk of bias could be judged as low, whereas an an-swer of “no” or “unclear” meant that the risk of bias could be judged as high. In the case of conflict, a third reviewer was consulted, and disagreement was settled through multilateral discussion.
Statistical analysis
All analyses were performed using Stata 14.0 software (StataCorp, College Station, TX, USA). The bivariate meta-analysis model was used to summarize sensitivity, specificity, positive likelihood ratio, negative likelihood ratio, and diagnostic OR (DOR) [13, 14]. The sensitivity and specificity of each included study were used to plot the summary ROC (SROC) curves and calculate the area under the SROC curve (AUC). The AUC could be statis-tically interpreted as the probability of distinguishing pa-tients from normal control subjects correctly. The between-study heterogeneity was evaluated using Qtest and I2statistics. A P value less than 0.10 for the Qtest or I2 value ≥50% indicated substantial heterogeneity, and then the random-effects model was applied. Con-firming the stability of the present study, the sensitivity analysis and outliner exclusion were also performed. Because publication bias is a concern for meta-analyses,
the Deeks’ funnel plot asymmetry test was used, with
P< 0.10 indicating statistical significance [15].
Results
Characteristics of the studies
duplicate records; 94 studies were excluded owing to the source not being related to the research topic or being a letter, review, or meta-analysis; and 9 studies were ex-cluded because they inex-cluded surgical, cardiac, or mixed patients or did not present usable data. Finally, six stud-ies [9, 10, 16–19] fulfilled all the inclusion criteria and were considered for analysis. The main characteristics of the eligible studies are shown in Table1. The quality of the included studies was assessed using QUADAS-2, as shown in Fig.2.
Quantitative synthesis
Study data and individual diagnostic estimates are sum-marized in Table2. Overall, 603 patients were included in this review, 324 (53.7%) of whom were fluid-responsive. The cutoff values ofΔIVCD varied across studies, ranging from 8% to 21%. The AUROC of individual studies ranged from 0.43 to 0.91. Heterogeneity between studies was assessed with an overallQ= 0.069,I2= 0%, andP= 0.483. The pooled sensitivity and specificity for the overall popu-lation were 0.69 (95% CI, 0.51–0.83) and 0.80 (95% CI, 0.66–0.89), respectively (Fig.3). The DOR was 9.28 (95% CI, 2.33–36.98) (Fig. 4). AUROCs were reported in five studies [9,16–19]. In four studies [9,17–19], the AUROC
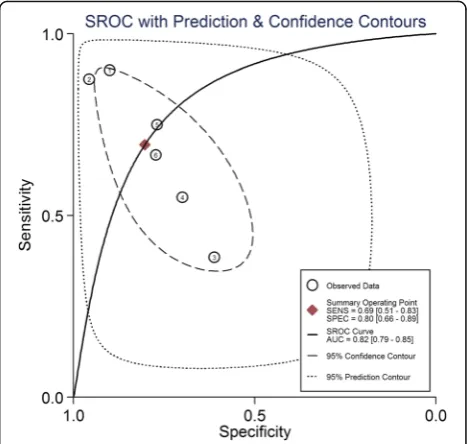
was > 0.5, and in the remaining study [16],ΔIVCD had no diagnostic value. Overall, the pooled AUROC was 0.82 (95% CI, 0.79–0.85) (Fig.5).
Sensitivity analyses
Goodness-of-fit and bivariate normality analyses
(Additional file 1: Figure S1a and b) showed that the bivariate model was robust for calculating the pooled estimates. Influence analysis and outlier detection (Additional file 1: Figure S1c and d) did not reveal outlier studies, suggesting the robustness of the present meta-analysis.
Publication bias
The publication bias of the studies was assessed using the Deeks’funnel plot asymmetry test. The slope coeffi-cient of the six studies was associated with a P value of 0.19 (Additional file 2: Figure S2). The aforementioned results indicated symmetrical data and no significant publication bias.
Discussion
[image:3.595.61.539.87.411.2]shock receiving mechanical ventilation was evaluated in a systematic review and meta-analysis. The results con-firmed that, overall, ΔIVCD performed moderately well in predicting fluid responsiveness in patients with circu-latory shock receiving mechanical ventilation, with a pooled AUROC of 0.82 (95% CI, 0.79–0.85). A positive
[image:4.595.56.544.99.268.2]IVC ultrasound was moderately predictive of fluid re-sponsiveness, with a pooled specificity of 0.80 (95% CI, 0.66–0.89). A negative IVC ultrasound, however, could not be used to rule out fluid responsiveness, with a pooled sensitivity of 0.69 (95% CI, 0.51–0.83). Some in-cluded studies showed that the measurement of IVCD
Table 1Characteristics of studies included in this meta-analysis
First author/year of publication
Country Sex (M/F)
Age in y (mean ± SD)
Cases Tidal volume (ml/kg)
Index test Reference standard measurement
Reference standard threshold
Reference standard device
Barbier 2004 [14] France 15/5 63 ± 15 20 8.5 (Dmax–Dmin)/Dmin CI > 15% TTE
Feissel 2004 [15] United States
22/17 65 ± 15 39 8–10 (Dmax–Dmin)/[(Dmax+Dmin)/
2]
CO > 15% TTE
Charbonneau 2014 [16]
France 26/18 58.5 44 8–10 (Dmax–Dmin)/Dmin CI > 15% TTE
Theerawit 2016 [17]
Thailand 11/18 62.6 ± 15.9 29 8 (Dmax–Dmin)/[(Dmax+Dmin)/
2]
CO > 15% PCA
Lu 2017 [18] China 33/16 R: 55.7 ± 12.6 N: 55 ± 12.8
49 8–10 (Dmax–Dmin)/Dmin CI ≥10% TTE
Vignon 2017 [19] France 379/ 161
65 ± 13 540 8 (Dmax–Dmin)/Dmin SV > 10% TTE
Abbreviations: CICardiac index,COCardiac output,DmaxandDminMaximum (inspiration phase) and minimum (expiration phase) diameter of inferior vena cava
over a complete respiratory cycle, respectively,NNonresponder,PCAPulse contour analysis,RResponder,SVStroke volume,TTETransthoracic echocardiogram
[image:4.595.61.538.383.715.2]variation was judged by eye, without overlaying the ven-tilator waveform, and therefore the sensitivity was low [17]. However,ΔIVCD could be assessed by eye, overlay-ing the ventilator waveform, and the cutoff of ΔIVCD was unclear. Further diagnostic studies are warranted to obtain the appropriate cutoff value and validate the pooled results. IVCD is a noninvasive, easily obtained measure that may be used to predict fluid responsive-ness in multiple patient settings. These findings are clin-ically relevant because point-of-care ultrasonography is
becoming increasingly popular, and ΔIVCD values can
be obtained immediately in the emergency or critical care setting.
Authors of two systematic reviews and meta-analyses [20,21] have investigated the diagnostic performance of
ΔIVCD in predicting fluid responsiveness. Recently,
[image:5.595.57.543.99.210.2]Long et al. [20] conducted a comprehensive systematic review and meta-analysis on the value ofΔIVCD in pre-dicting fluid responsiveness. Compared with their study, the present study was focused only on patients with
Table 2Outcomes of studies included in this meta-analysis
First author/year of publication
Sample size
Cutoff (%)
Subject numbers could be calculated Sensitivity (%)
Specificity (%)
AUROC (95% CI)
TP FP FN TN
Barbier 2004 [9] 20 18 9 1 1 9 90 90 0.91 (0.84–0.98)
Feissel 2004 [10] 39 12 14 1 2 22 88 96 NA
Charbonneau 2014 [16] 44 21 10 7 16 11 38 61 0.43 (0.25–0.61)
Theerawit 2016 [17] 29 10 12 3 4 10 75 77 0.67 (0.48–0.89)
Lu 2017 [18] 49 20.5 18 5 9 17 67 77 0.81 (0.67–0.94)
Vignon 2017 [19] 422 8 126 58 103 135 55 70 0.635
Abbreviations: AUROCArea under the ROC curve,FNFalse-negative,FPFalse-positive,NANot available,TNTrue-negative,TPTrue-positive
Fig. 3Forest plots of the pooled sensitivity and specificity analysis. Eachsolid squarerepresents an individual study. Error bars represent 95% CI.
[image:5.595.57.539.369.703.2]shock receiving mechanical ventilation, whereas Long et al. analyzed a variety of patients with sepsis, including neurosurgery, cardiac, and subarachnoid hemorrhage pa-tients. Additionally, several published studies [18, 19] were not included in that meta-analysis. More eligible studies [16–19] were identified, and in contrast with a recent meta-analysis on the value of ΔIVCD in predict-ing fluid responsiveness reported by Zhang et al. [21], we performed a detailed analysis in the present study. Zhang et al. analyzed only two of six studies [9,10] in-cluded in our meta-analysis. Moreover, the results of the present meta-analysis were not exactly the same as those of a previous study in terms of the main outcomes assessed, such as sensitivity, DOR, and so forth.
The present systematic review and meta-analysis had some limitations. First, this analysis included only six studies with a relatively small sample size, among which the study performed by Vignon et al. [19] was the largest study with more than 60% of the total sample size. Therefore, the power and precision of the results were limited. Second, the quality assessment showed a high
risk of bias in the index test. Two studies were at high risk owing to insufficient information to judge whether their test results were interpreted blind. This bias might have restricted the interpretation of the true diagnostic efficacy of ΔIVCD in predicting fluid responsiveness. Third, because more detailed individual patient data were not available, a more comprehensive analysis of diagnostic effect could not be conducted. Fourth, the relatively small sample size in the included studies led to strong diagnostic factors that might not be significant. Finally, the limitations of the huge variation in IVCD for
predicting fluid responsiveness may be explained
through closer examination of different formulas, differ-ent cutoffs, and the included study characteristics.
Conclusions
This was the first meta-analysis to evaluate the diagnos-tic accuracy ofΔIVCD in predicting fluid responsiveness in patients with circulatory shock receiving mechanical ventilation. The results suggestΔIVCD performed mod-erately well in predicting fluid responsiveness. Further studies with a larger dataset and well-designed models are required to confirm the diagnostic accuracy and util-ity of IVCD in predicting fluid responsiveness in patients with circulatory shock receiving mechanical ventilation. Fig. 4Forest plots of the pooled diagnostic odds ratio. Eachsolid
squarerepresents an individual study. Error bars represent 95% CI.
Diamondindicates the pooled diagnostic OR for all of the studies
Fig. 5Summary ROC (SROC) curve of respiratory variations of inferior vena cava diameter for predicting fluid responsiveness. Each
circlerepresents individual study estimates. Thediamondis the
[image:6.595.57.293.87.427.2] [image:6.595.305.539.88.310.2]Additional files
Additional file 1:Figure S1.Graphs for sensitivity analyses.aGoodness of fit.bBivariate normality.cInfluence analysis.dOutlier detection. (TIF 610 kb)
Additional file 2:Figure S2.Deeks’funnel plot with regression line. (TIF 252 kb)
Abbreviations
AUC:Area under the summary ROC curve; AUROC: Area under the ROC curve; DOR: Diagnostic OR; FN: False-negative; FP: False-positive;
IVCD: Inferior vena cava diameter;ΔIVCD: Respiratory variations in the inferior vena cava diameter; QUADAS-2: Quality Assessment of Diagnostic Accuracy Studies; SROC: Summary ROC; TN: True-negative; TP: True-positive
Availability of data and materials
The datasets used and/or analyzed in the present study are available from the corresponding author on reasonable request.
Authors’contributions
HHJ and QSQ performed the studies, participated in collecting data, and drafted the manuscript. HHJ and LYF performed the statistical analysis and participated in its design. XH and FYX helped in drafting the manuscript. All authors read and approved the final manuscript.
Ethics approval and consent to participate
Not applicable.
Competing interests
The authors declare that they have no competing interests.
Publisher’s Note
Springer Nature remains neutral with regard to jurisdictional claims in published maps and institutional affiliations.
Received: 19 September 2017 Accepted: 14 May 2018
References
1. Bindels AJ, van der Hoeven JG, Graafland AD, de Koning J, Meinders AE. Relationships between volume and pressure measurements and stroke volume in critically ill patients. Crit Care. 2000;4:193–9.https://doi.org/10. 1186/cc693.
2. Hu B, Xiang H, Liang H, Yu L, Xu T, Yang JH, et al. Assessment effect of central venous pressure in fluid resuscitation in the patients with shock: a multi-center retrospective research. Chin Med J. 2013;126:1844–9. 3. Pinsky MR. Functional haemodynamic monitoring. Curr Opin Crit Care. 2014;
20:288–93.https://doi.org/10.1097/mcc.0000000000000090.
4. Lee CW, Kory PD, Arntfield RT. Development of a fluid resuscitation protocol using inferior vena cava and lung ultrasound. J Crit Care. 2016;31:96–100. https://doi.org/10.1016/j.jcrc.2015.09.016.
5. Cheriex EC, Leunissen KM, Janssen JH, Mooy JM, van Hooff JP. Echography of the inferior vena cava is a simple and reliable tool for estimation of‘dry weight’in haemodialysis patients. Nephrol Dial Transplant. 1989;4:563–8. 6. Ando Y, Yanagiba S, Asano Y. The inferior vena cava diameter as a
marker of dry weight in chronic hemodialyzed patients. Artif Organs. 1995;19:1237–42.
7. Lyon M, Blaivas M, Brannam L. Sonographic measurement of the inferior vena cava as a marker of blood loss. Am J Emerg Med. 2005;23:45–50. 8. Sefidbakht S, Assadsangabi R, Abbasi HR, Nabavizadeh A. Sonographic
measurement of the inferior vena cava as a predictor of shock in trauma patients. Emerg Radiol. 2007;14:181–5.https://doi.org/10.1007/s10140-007-0602-4. 9. Barbier C, Loubieres Y, Schmit C, Hayon J, Ricome JL, Jardin F, et al.
Respiratory changes in inferior vena cava diameter are helpful in predicting fluid responsiveness in ventilated septic patients. Intensive Care Med. 2004; 30:1740–6.https://doi.org/10.1007/s00134-004-2259-8.
10. Feissel M, Michard F, Faller JP, Teboul JL. The respiratory variation in inferior vena cava diameter as a guide to fluid therapy. Intensive Care Med. 2004;30: 1834–7.https://doi.org/10.1007/s00134-004-2233-5.
11. Moher D, Liberati A, Tetzlaff J, Altman DG. Preferred reporting items for systematic reviews and meta-analyses: the PRISMA statement. Int J Surg. 2010;8:336–41.https://doi.org/10.1016/j.ijsu.2010.02.007.
12. Whiting PF, Rutjes AW, Westwood ME, Mallett S, Deeks JJ, Reitsma JB, et al. QUADAS-2: a revised tool for the quality assessment of diagnostic accuracy studies. Ann Intern Med. 2011;155:529–36. https://doi.org/10.7326/0003-4819-155-8-201110180-00009.
13. Deeks JJ. Systematic reviews in health care: systematic reviews of evaluations of diagnostic and screening tests. BMJ. 2001;323:157–62. 14. Glas AS, Lijmer JG, Prins MH, Bonsel GJ, Bossuyt PM. The diagnostic odds
ratio: a single indicator of test performance. J Clin Epidemiol. 2003;56:1129–35. 15. Deeks JJ, Macaskill P, Irwig L. The performance of tests of publication bias
and other sample size effects in systematic reviews of diagnostic test accuracy was assessed. J Clin Epidemiol. 2005;58:882–93.https://doi.org/10. 1016/j.jclinepi.2005.01.016.
16. Charbonneau H, Riu B, Faron M, Mari A, Kurrek MM, Ruiz J, et al. Predicting preload responsiveness using simultaneous recordings of inferior and superior vena cavae diameters. Crit Care. 2014;18:473.https://doi.org/10. 1186/s13054-014-0473-5.
17. Theerawit P, Morasert T, Sutherasan Y. Inferior vena cava diameter variation compared with pulse pressure variation as predictors of fluid responsiveness in patients with sepsis. J Crit Care. 2016;36:246–51.https://doi.org/10.1016/j. jcrc.2016.07.023.
18. Lu N, Xi X, Jiang L, Yang D, Yin K. Exploring the best predictors of fluid responsiveness in patients with septic shock. Am J Emerg Med. 2017;35: 1258–61.https://doi.org/10.1016/j.ajem.2017.03.052.
19. Vignon P, Repesse X, Begot E, Leger J, Jacob C, Bouferrache K, et al. Comparison of echocardiographic indices used to predict fluid
responsiveness in ventilated patients. Am J Respir Crit Care Med. 2017;195: 1022–32.https://doi.org/10.1164/rccm.201604-0844OC.
20. Long E, Oakley E, Duke T, Babl FE. Does respiratory variation in inferior vena cava diameter predict fluid responsiveness: a systematic review and meta-analysis. Shock 2017;47:550-559. https://doi.org/https://doi.org/10.1097/shk. 0000000000000801
21. Zhang Z, Xu X, Ye S, Xu L. Ultrasonographic measurement of the respiratory variation in the inferior vena cava diameter is predictive of fluid