Rochester Institute of Technology
RIT Scholar Works
Theses
Thesis/Dissertation Collections
10-2005
Expert Object Recognition in video
Matthew S. McEuen
Follow this and additional works at:
http://scholarworks.rit.edu/theses
This Thesis is brought to you for free and open access by the Thesis/Dissertation Collections at RIT Scholar Works. It has been accepted for inclusion in Theses by an authorized administrator of RIT Scholar Works. For more information, please [email protected].
Recommended Citation
Expert Object Recognition in Video
Matt McEuen
In
partial fulfillment of the requirements
for
the Degree
of Master of Science
Department of Computer Science
Rochester Institute of Technology
Rochester, New York
October,
2005
Roger Gaborski
~~~~~~~~~-Professor Roger S.
Gaborski, Chairperson
Carl Reynolds
Professor
Carl Reynolds, Reader
Edith Hemaspaandra
Professor Edith Hemaspaandra, Observer
H. Bischof
Thesis/Dissertation Author Permission Statement
Title of thesis or dissertation:
L.x
p(' 1+u~/
e
c
'f
R
f ( OQ.. Y11
·
i '
0
0"i IV)
v
,
·
J.
e
o
J (/
Nameofauthor:
----:~'--+-'...,--"+-'-'-:<--~S~
-~
-
~
;l-
-l..
1
~c=--=~:....::::
'-"
::...J>..<~
~
~
1
---
Degree:Program: College:
I understand that I must submit a print copy of my thesis or dissertation to the RIT Archives, per current RIT guidelines for the completion of my degree. I hereby grant to the Rochester Institute of Technology and its agents the non-exclusive license to archive and make accessible my thesis or dissertation in whole or in part in all forms of media in perpetuity. I retain all other ownership rights to the copyright of the thesis or dissertation. I also retain the right to use in future works (such as articles or books) all or part of this thesis or dissertation.
Print Reproduction Permission Granted:
I, .
.ft
c-..
it
4
e
L-'s
i-1
c
F
IAel-'\
'hereby grant permission to the Rochester InstituteTechnology to reproduce my print thesis or dissertation in whole or in part. Any reproduction will not be for commercial use or profit.
Signature of Author:
Matthew S. McEuen
Date:t
o
l2/o7
I I
Print Reproduction Permission Denied:
I, , hereby deny permission to the RIT Library of the Rochester Institute of Technology to reproduce my print thesis or dissertation in whole or in part.
Signature of Author: _ _ _ _ _ _ _ _ _ _ _ _ _ _ _ _ _ Date: _ _ _ _ _
Inclusion in the RIT Digital Media Library Electronic Thesis
&Dissertation (ETD) Archive
I,
fo
b
l/}1e
v$.
A1
cCl
....
Pvz , additionally grant to the Rochester Institute of Technology Digital Media Library (RIT DML) the non-exclusive license to archive and provide electronic access to my thesis or dissertation in whole or in part in all forms of media in perpetuity.I understand that my work, in addition to its bibliographic record and abstract, will be available to the world-wide community of scholars and researchers through the RIT DML. I retain all other ownership rights to the copyright of the thesis or dissertation. I also retain the right to use in future works (such as articles or books) all or part of this thesis or dissertation. I am aware that the Rochester Institute of Technology does not require registration of copyright for ETDs.
I hereby certify that, if appropriate, I have obtained and attached written permission statements from the owners of each third party copyrighted matter to be included in my thesis or dissertation. I certify that the version I submitted is the same as that approved by my committee.
oc;-Abstract
Arecent computer vision techniqueforobject classificationinstillimages
is the biologically-inspired Expert Object Recognition (EOR). This thesis
adapts and extends the EOR approach for use with segmented video data.
Properties ofthis data, such as segmentation masks and the visibility ofan
object over multipleframes, are exploitedto decrease humansupervision and
increase accuracy. Several types of runtime
learning
are facilitated: class-levellearning
in which object types that are not included in thetraining setare given artificial classes; viewpoint-level
learning
in which novel views oftrainingobjects are associated with existing classes; andinstance-level learn ing of images that are somewhat similar to training images. The architec
ture ofEOR, consisting offeature extraction, clustering, and cluster-specific
principal component analysis, is retained. However, the K-means clustering
algorithm used inEORis replacedinthissystemby an augmentedversion of
Fuzzy K-means. This algorithm is incrementally run overthe lifetime ofthe system, and automatically determines an appropriate number of partitions
based on the data in memory and on a system parameter. In addition, the
edge and line-based feature extraction of EORis replaced with a global ap
plication ofthe principalcomponentanalysis, which increases accuracywhen
usedwithsegmented videodata. Classificationoutputforthesystem consists
of a multi-class hypothesis foreach tracked object, fromwhich a single-class
"hard"
hypothesis may be determined. The system, named VEOR (video
expert object recognition), is designed for and tested with noisy, automati
callysegmentedreal-world
Acknowledgements
This thesis would not have been possible without the vast amounts of
guidance, insight, and support that were freely offered by my chairperson,
Dr. Roger Gaborski. I would also like to thank the other members of my
committee, Dr. Carl Reynolds and Dr. EdithHemaspaandra, for theirfeed back and support. I am grateful to Dr. Bruce Draper and Dr. Kyungim
Baekfor their helpfulcorrespondence and assistance.
Contents
1 Introduction g
2 The Expert Object Recognition approach 11
2.1 Edge Detection 13
2.2 Line Detection 16
2.3 Categorization 17
2.4 Exemplar matching 20
2.5
Summary
243 Considerations for video 26
4 The VEOR system 29
4.1 VEOR System Architecture 30
4.2 Foreground segmentation 34
4.3 Object tracking 36
4.4 Feature extraction 39
4.5.1 Requirements
4.5.2 Promotingstability of cluster membership 47
4.5.3 Determiningan appropriate number of clusters .... 48
4.5.4 Architectural considerations 53
4.5.5 Fuzzy K-means 54
4.5.6 Summary 58
4.6 Exemplar matching 58
4.7 Membership 60
4.7.1 Matchingto atraining image 61
4.7.2 Matchingto adifferent object 63
4.7.3 Matching to the same object 64
4.7.4 Implementation notes 66
4.8 Learning 67
4.8.1 Types oflearning 67
4.8.2 Learning-related parameters 70
5 Experiments 74
5.1 The cat and dogdatabase 74
5.2 The segmented vehicle profile database 78
5.3 Experiments with video data 84
5.3.1 Vehicleprofile videos 84
5.3.2 Learning-related experiments 85
List
of
Figures
2.1 EOR system architecture 13
2.2 Gabor energies of cat faces. The top row is the unfiltered in
put. The second, third, and fourth rows are the faces filtered
with even and odd Gabor filters of sizes 7, 15, and 31, respec
tively, in false color. Theinput images werefirst scaledto the
range
[-1,1]
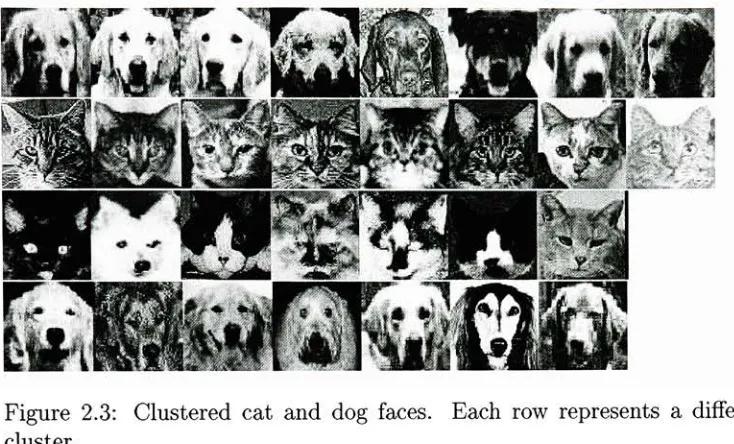
and smoothed 152.3 Clustered cat and dog faces. Each row represents a different
cluster 20
2.4 Two-dimensional illustrationofthemajorsteps ofPCA, cour
tesy of
[16]
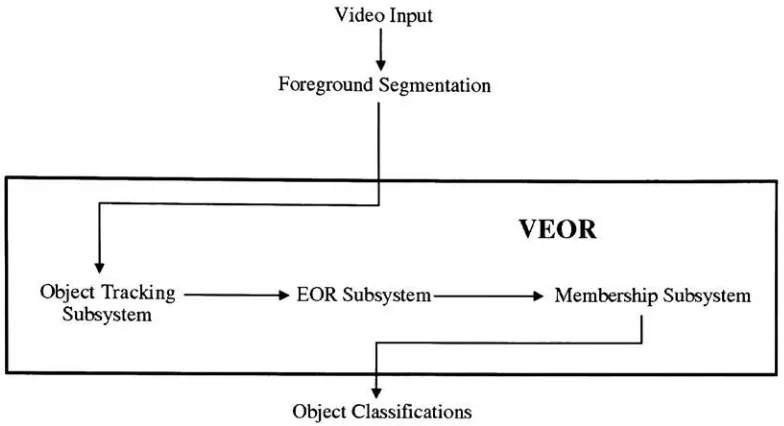
234.1 Architecture of the VEOR system. Arrows indicate the flow
4.2 Example of VEOR training sample. The first two pieces of
data associated with this sample are a video frame and its
corresponding mask, shown above. The third and fourth are
theclass name
"car"
andthe
(row,column)
coordinate(87,79),
which specifies the location of the object of interest. The
upper-left corner of the images are considered to be the co
ordinate origins,
(1,1)
324.3 Stages ofinitial input processingon asample,
(a)
and(b)
arethe sample's input video and mask frames, respectively,
(c)
and
(d)
aretheextracted and resized video and maskpatches.(e)
is the masked object if Gaborfiltering
is not used, while(f),
shown in false color, is the masked object ifa 7 x 7 filteris applied 42
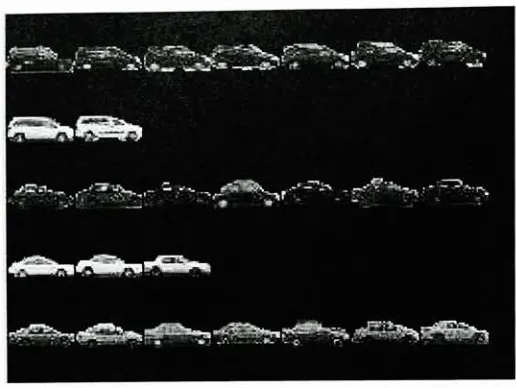
4.4 Some cars and vans clustered using global PCA for feature
extraction. Rows represent clusters. Note that vehicles tend
to beclustered bothby theirclass and by theirgrayscale color. 45
5.2 Cat and
dog
database classification performanceusing global
PCAfeature extraction. Thenumberoflocaland global PCA
subspace dimensionsare varied
(top
left andtopright, respectively), as well as Fuzzy K-means' fuzziness coefficient (bot tom). The default values for the number of global and local
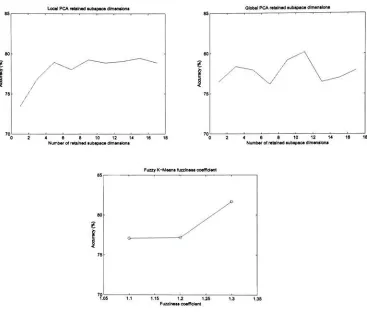
subspaces is 5, and the default fuzziness is 1.3 77 5.3 Examples of videoframesfromthevehicledatabase, and their
corresponding masks 80
5.4 Vehicle database classification performance using global PCA
feature extraction. The number oflocal and global PCA
sub-spacedimensions arevaried (thetopleftand topright graphs,
respectively), as well as Fuzzy K-means' fuzziness coefficient
(bottom)
825.5 Frames from the classified output video. Each row shows a
different car approaching the camera (column one), turning (column two), andcontinuing in profile (column three). Ared
bounding box indicates a"car" classification, green indicates
Chapter
1
Introduction
Object recognition is a difficult and important problem in computer vision,
and is integral to the understanding ofvideo events by a computer. An en
couraging fact, however, is that humans can perform this task with great
speed, accuracy, and ease. The biologically inspired system proposed by
Bruce Draper, Kyungim Baek, and JeffBoody, called expert object recog
nition
(EOR)
[1,
2, 3], yields results that surpass those ofthe system's constituent algorithms. However, their approach is engineered for use with still
images, and while potentially ofgreat use to video analysis, has limitations
which prevent it from being applied to that domain. An EOR-based ap
proach called VEOR (video expert object recognition), which attempts to
address these limitations, is proposed in this thesis. VEOR is specializedfor
the needs of video understanding and tuned for use with segmented video
ap-plies to real world data, and is tested with a database of segmented cars,
trucks, and vans.
The outline of this thesis is as follows. Chapter 2 gives background in
formation on the EOR system and its incorporated algorithms. Chapter 3
presents problemsthat prevent theexistingEORimplementationfrombeing
applied to video data, and describes some features that would be desirable in an object recognition system for video. The architecture of VEOR and
the detailsofits subsystems and algorithms arefound inchapter 4. Chapter 5describes experiments withdifferent data sets and theirresults. Chapter 6
presents conclusions.
Becausecontinuedresearchinthisareaisplanned,implementation-specific
notesthat describefunctions, their arguments and returnvalues, systempa
rameters, etc., are included. These notes are by no means an exhaustive guide to the VEOR implementation; they are merely meant as a starting
point, so that code and comments may be put into context. The implemen tation consists of MATLAB code, and all system parameters are settable
Chapter
2
The Expert Object
Recognition
approach
Expert object recognition is aspecifickind ofhuman object recognition that
is concerned with fast recognition and discernment offamiliar types of ob
jects. Objects are recognized on both instance and category levels. For
example, while a familiar face may be associated with a specific individual,
an unfamiliar facewould still be recognized as human.
In a series oftwo papers [3, 1] and one doctoral dissertation
[2],
Draper,Baek, andBoody proposed a biologicallyinspired approach to object recog
nition based on the human expert object recognition pathway, dubbed the
expert object recognition
(EOR)
system. EOR has been actively developed,and the algorithmic choices and parameterization differ somewhat from pa
of the system to be quite good, outperforming all of the constituent algo
rithms used [1]. Furtherresearch is
being
donein allofthe modulesofEOR,particularly in the areas offeature extraction and exemplar matching.
The expert object recognition pathway in the human brain, modeled by
the EOR system, consists of three main stages which sequentially extract
features from, categorize, and match viewed imagesto visual memories.
The EOR lifecycle isdivided intotrainingand runtimephases, thelatter
of which can beused as a testingphase. The same general stages are found
in both the trainingand testingphases: feature extraction, which computes
feature vectors for image data; categorization, which partitions images into
groupsbased on thesimilarity oftheirfeature vectors; and exemplar match
ing, which is responsible fordetermining thebest matchforaruntimeimage
from within its assigned partition. The flow ofdata among these stages can
beseen at ahigh level infigure2.1. The stages are described in detail inthe
followingsections.
An implementationofEORwas developed as astartingpointforVEOR,
and so that the two approaches may be quantitatively compared. In this implementation, feature extraction is applied to eachtrainingimage serially,
generatingaset offeaturevectors. The categorizationstageis applied to the
featurevectors in asingle step, and calculations necessary to allow exemplar
matching are performed sequentially on each generated partition oftraining data. During testing, images are fully processed sequentially. Where the
Hand-cropped
Images
EOR
Feature Extraction
Categorization System
Exemplar matching System
Non- symbolic
[image:15.528.86.444.112.233.2]S Classification
Figure 2.1: EORsystem architecture.
specialnote willbe made.
2.1
Edge Detection
The VI area of the brain consists primarily of edge detecting simple cells,
andofcomplex cellswhich sumthesimple cell outputs [2]. Gaborfunctions,
the products of Gaussian and sinusoidal functions, are the accepted model
of simple cell receptive fields. Two types of Gabor filters, even and odd,
are particularly sensitive to bars and to edges, respectively. The sinusoid
used in the creation of even filters is a cosine function, while that used for
odd filters is a sine function. Basic even and odd filters are generated in
this implementation with a script from theVENUS
[5]
system. Those filtersare then rotated to 0, 45, 90, and 135 degrees to detect edges and bars
sensitive toedges and bars of various sizes. However, the performanceofthe
implementation as a whole was slightly better when only thesmallest filters
(seven by seven pixels) were used, than when the three sizes
(7,
15, and 31square pixels
[2])
found in the literature were used. Usingonly the smallestfiltersize alsodecreasedprocessingtimesignificantly. Recentcorrespondence
with Dr. Draper confirms that the working version ofthe EORsystem uses
only the smallest filter size aswell.
ComplexVI cells are modeled bysummingthesquared output fromsim
plecells. Thisservestocreate a rectifiedenergy map denoting edgestrength
acrossthe filteredimage [2]. Some differenceexists amongthedifferent EOR
proposals as to whether the rectified energies of the individual orientations
are tobe summed into an average
[1],
or kept separate asinput for the nextstage of processing [2]. The approach used in this implementation was to
sum the outputs and normalize the result to the range [0,1].
Twosmallalgorithmic additionsthatincreasedperformanceasmall amount
were to smooth images usingan averagingfilterprior to Gaborfiltering, and
to normalize theirvalues to [-1,1]. The latter step serves toremedy a short
comingofapplying Gabor filterstoimagedataratherthantoa contrastmap
(as in [5]). This problem is evidenced by the fact that a white object on a
black background will generate a very different edge response than a black
object on a white background. Normalizing the input to
[-1,1],
combinedwith the rectification step, produces identical edge responses for both. In
apply-'" *
J xSt
Figure 2.2: Gabor energies of cat faces. The top row is the unfiltered input.
The second, third, and fourth rows are the faces filtered with even and odd
Gabor filters of sizes 7, 15, and 31, respectively, in false color. The input
[image:17.528.73.457.235.459.2]ing Gabor filters to a contrast map. A contrast map is generated using a
filter with a shape similar to that of a Gabor filter, such as a difference of
Gaussians filter [5]. This similarity of results, however, calls into question
the necessity ofthe extrafiltering. The effects ofGabor filtering at different
resolutions, after smoothingand normalizing, may be seen in figure 2.2.
Inthis implementation, the sizes offilters, and the number offiltersizes,
are determined by the system parameter gabor (a vector of in
tegers); the number oforientations by gabor_orientCt; and the number of
phases (1 for oddfilters, 2 for both even and odd
filters)
by gabor2.2
Line
Detection
In the human brain, further feature extraction is performed by the lateral
occipital cortex
(LOC),
the cells of which respond to structural, oredge-based, properties. Specifically, non-accidentalproperties, such ascollinearity,
parallelism, symmetry, and antisymmetry are detected. The EOR system
performs a subset ofthefunctionsofthe LOCby usingtheHough transform
to discover collinearity [1]. This algorithm finds, for every non-zero pixel in
an image, along what lines that pixel may lie. Response valuesare collected
in bins in "Hough space", a discrete two-dimensional space whose axes are
the orientation and perpendicular distance from the origin ofpossible lines.
Thus, binsrepresentindividual linesacrossthe inputimage, and thevalue of
standard image processing, Hough space responses arethresholded to detect
lines. However, the goal of this stage of the EOR system is to produce a
signaturethat identifiesan imagebyits non-accidentalfeatures, so allofthe
response dataare kept.
Unfortunately, all attempts to gain performance in this implementation
using the Hough transform were futile. Under any parameterization with
Hough, performancewas very significantlylowerthanwithout. This may be
because ofsomeincorrect assumption that is not specifically detailed in the
literature, because, in the literature, Hough added greatly to performance
[1]. Thus, under the default parameterization, this implementation follows
the earliest specification of EOR
[3],
in which Hough was not used. Thesystem flag useHough determines whether or not the transform is included infeatureextraction. Theimplementation oftheHough transformused here
is from [19].
2.3
Categorization
Whilethenexttwostagesinthebiologicalexpert object recognitionpathway
are not as well understood as those previously discussed, there is evidence
that thefusiformgyrus and rightinferior frontalgyrus perform categorization
centers, centroids, or prototypes, are calculated as part of categorization.
Runtime images are then assigned to clusters whose centroids are closest to
their feature vectors. Exemplar matching for an image is performed using
the subset oftrainingdata associated with its cluster.
Categorization in EORis modeled by the K-means clustering algorithm.
K-means is a simple iterative algorithm that can quickly categorize multi
dimensional input into clusters, while simultaneously calculating the mean
value for each cluster [7].
Clustering
does not improve the performance ofthesystem muchin terms ofaccuracy
[1];
however, itallows visual memoriesto be stored at ahigh level ofcompression, as described in the next section.
The number ofclusters is determined beforeruntime by the parameter k.
K-means belongs toacategory ofclusteringalgorithms that seekto min
imize a distance (or error) metric between data and their assigned cluster
centroids. The objective function that the algorithm seeksto minimize is
jKM{x,
c)
=__.
N
(2-i)
j=li=l
Xisavectorofdatatobepartitioned; eachdatumx G X is itselfafeature
vector, xfis read "the ft1 datum in the
f1
cluster", and
n3-is the number of
datain clusterj. Cis amatrix of cluster centroids, and each centroid ceC
has the same dimensionality
(length)
as the vectors in X||
*||2
denotes
a particular distance metric [7]. Squared Euclidean distance is the most
Algorithm 1 The K-means algorithm
[8]
1. Initialize k (a parameter) cluster centroids in C to the values of k
randomdata in X.
2. Assign membership of each datum to the cluster centroid to which it
is closest.
3. Recompute the values ofthe centroids to be the mean values oftheir
memberdata.
4. Ifa convergence criterion is not met, go to step 2.
"city block" and Mahalanobis distances. K-means is implemented
using the
technique of alternating optimization, in which optimal values for C and
cluster membership are calculated in turn until some convergence criterion
(or criteria) is met [8]. Common convergence strategies are to stop when
no change in cluster membership occurs, or when total change of centroid
locations is less than a threshold. The steps ofK-means are as follows.
Sometypicalclusters generated whenK-meansisapplied
(following
Gabor-based feature extraction) to the cat and dog database (see section
5.1)
areshown in figure 2.3.
Draperandhiscolleagues foundthat performance was increasedby over
estimatingthe value for k,
possibly because the actual classes in the datado
not reflect a Gaussian distribution [1]. The results of
this implementation
support this.
Although a new implementation ofK-means was created for this imple
Figure 2.3: Clustered cat and dog faces. Each row represents a different
cluster.
implementation found in the MATLAB statistical toolbox. The reason for
this is unknown. The differing results may be due to the fact that the per
formance ofK-means varies greatly with thechoice ofinitial cluster centers.
However, use of the statistical toolbox version did not improve exemplar
matchingperformance ofthesystemsignificantlywhencompared tothenew K-means implementation. The statistical toolbox implementation may be
enabled by settingthe systemflag clustering_matlab_hkm,and thenew im
plementation by clustering
2.4
Exemplar
matchingOnce an imagehasbeen assignedto acluster atruntime, exemplarmatching
[image:22.528.72.439.92.314.2]have hypothesized that visual memories are retained in the brain as "com
pressed images", and some experimental data support this idea [1]. Com
pressioninthe EORsystem is facilitatedby theuse of asubspace projection
algorithm, theprincipal componentanalysis (PCA).PCA isastatisticaltech
nique that exploits similarities in data. It has proved useful in the field of
computer vision, and has been used for years as a face matching algorithm
[!]
PCA finds orthogonal vectors along which the maximum variance in a
dataset lies, and captures that variance in new variables bymaking the vec
tors axes in a subspace. In this way, most of the variance ofa dataset can
be represented by a relatively small number ofdimensions. Details of PCA
are found in the following section. By
forcing
similar images into clusters, andgenerating adifferent subspace foreach cluster, the EORsystem allowsPCA to very effectively compress a dataset consisting of dissimilar objects
[2]. Another advantage to clustering and subspace matching is that, instead
of
finding
the nearest match to an image fromthe entire trainingdataset in high-dimensionalimage space, EOR finds the nearest match to the image inalow-dimensionalsubspace from a clustered subset ofthe data.
In
[3],
PCA isappliedtoimagedata, whilein[1],
it isappliedtothe same feature vectors upon which K-means operates. Both strategies were tested in thisimplementation,
with the former achieving better performance. TheThe Principal Component Analysis
As mentioned previously, PCA projects datainto an artificial subspace, and
can function as a variable reduction procedure. PCA differs from
subspace
projection algorithms such asthe Fouriertransform in that the basisvectors
forthe subspace arederived fromthedatatobetransformed. Theprojection
matrix consists ofbasis vectors (subspace axes) that are orthonormal toone
another [16]. Thus, the vectors are mutually uncorrected [17].
When PCA is performed on adataset,the mean value issubtractedfrom
the data, and a covariance matrix is calculated from the result [18]. Infor
mation in data is usually encoded as variance, and the ability to capture
most of that variance in a small number of variables is how PCA accom
plishes variable reduction. PCA works best when there exists a high level of redundancy
(covariance)
among input variables [17]. When performed onraw image data, the redundancy exploited by PCA is that of pixels whose
values vary together. A simplified example: if a particular region ofpixels
sharethe same graylevelvalue withineach image inadataset,but that value varies among the different images, then a single subspace variable may rep
resent the intensityof all ofthose pixels. Likewise, a subspace variable may
encode thepresence and degree ofafeature common to some, but not all, of the dataset. However, because PCA applied in this fashion is pixel-based, a
spatialtranslationofaparticular featurecould not besocleanly represented. When calculating the projection matrix, a basis vector is found that ac
Transformation Reduce dim.
^: n o
T>o
o_o_________-_.v. 00 00o O000
Yj
^xl X]
Figure 2.4: Two-dimensional illustrationofthemajor stepsofPCA, courtesy of[16].
principal component. Another vector isfound, orthogonalto the first, which
capturesthe maximum remainingvariance in the data, and so on; each sub
sequent component accounts for the maximal amount of"residual" variance
not captured bythe previous components. The method by which these ba
sis vectors are found is to calculate the eigenvectors and eigenvalues ofthe
covariance matrix ofthe data [16]. The order of principal components is the
same as the descending order oftheir correspondingeigenvalues; that is, the
eigenvector withthe largest eigenvalue is the first principal component [18]. As many principal componentsmay be found fora dataset as exist vari
ables in its input vectors. Each principal component represents an axis in
the PCAsubspace; therefore, whendataaretransformed bytheir"full" PCA
projection matrix, the dimensionality (and
size) ofthe output is identical to that of the input. However, because most of the information in the data is
captured in the initial principal components, the lattercomponents may be
ignored, and only a small amount ofinformation is lost. There are many
[image:25.528.94.458.97.208.2]com-ponents to retain, such as the eigenvalue-one criterion, the scree test, and
setting athreshold on the proportion of variancefor which retained compo
nents must account [17]. These methods make their determination based on
the dataset at hand. However, EOR takes a simpler approach, and retains
a number of eigenvectors specified by a system parameter. This value was a
variable in the experiments ofDraper et al. [1].
Once the transformation matrix for adataset is calculated, data may be
projected through it [18]. The size of the projected data is proportional to the number of retained basis vectors. In addition, a reconstruction of the
original dataset may be produced by projecting subspace data through the transpose of the transformation matrix. If as many principal components
exist as variables in the input, then no information is lost, and a perfect
reconstruction may be created. However, only an approximation can be recovered ifsome ofthe eigenvectors are ignored [18].
2.5
Summary
Now that the building blocks of EOR have been described, the end to end
procedure will be shown for the sake of comprehension. The steps followed
Algorithm 2 EOR, trainingphase
1. Extract features from trainingimages using Gabor filters.
2. Cluster the feature vectors into k partitions using K-means.
3. For each cluster, create a transformation matrix by performing PCA
on the images associated with that cluster. Project each datum into
its cluster's subspace.
Algorithm 3 EOR, testing phase
1. Extract features from the testing image using Gaborfilters.
2. Findthecluster centroid (ascomputedintraining) closestto thefeature
vector.
3. Project the image into the PCA subspacefor that cluster, and find its
closest matchfromthe projected clustermembers. Thisistheexemplar
Chapter
3
Considerations
for
video
Gaborskiet al. fromtheRIT departmentofcomputer sciencehave developed
anovel videoeventrecognition system, calledVENUS
[5],
whichiscapableofdetectingnovelty in avideoscene basedon habituation tocolor and motion.
However, the long-term goal for the system is to be able to describe what
happens in a scene, and object recognition plays a key role in that regard.
The prospect ofapplying the EORapproach in this way is appealing. EOR
may be trained on any number of arbitrary classes; that is, it is a generic
approach that can be specialized for various applications by choosing differ
ent trainingsets. In the areaof video understanding, trainingdata could be
selected basedonwhat objectsareexpectedtoappearinascene, and also on
those objects whose presence should be cause for alarm. In addition, EOR
lends itself to use with video data. The attention window, a part of visual
back-ground detection-based object segmentation (see section 4.2). Also, while EOR associates images with previously seen images, an associative memory
that would label those images
(along
with other reasoning-related tasks) is deemed to be outside the scope of EOR [2]. Plans to introduce a robustassociativememory into VENUScouldfillthisroleand achievemorereliable
classification results.
However, significant issues stand in the way of providing an EOR im
plementation suitable for use in a video system, especially with regards to
runtime learning. Learning would be a highly advantageous feature for a
video-based system, especially one engineered for the detection of novelty.
In a realistic setting, an object may look differently from one frame to the
next, because of rotation, shadow, partial occlusion, or noise. Knowledge,
gained through learning, that a class may appear in views different from
those trainedupon would aidfurther identificationofinstancesofthat class.
Objects whose classes were not included in the training set may also be en
countered, and should be classified as unknown objects. However, if two
such objects appearin avideo sequence, an intelligent response wouldbe to
classify the objects as the same type, even though the system does know a
symbolic label for that type.
The current EOR system makes a strong distinction between training
and testingphases, which precludes onlinelearning. This distinction is com
plicated by the fact that two of the algorithms, K-means and PCA, would
memory. This highamount ofprocessing mayberedundant andunnecessary.
Likewise, the number and selection of retainedimages is animportant issue,
as this determines how often
learning
must occur and in what way visualmemory is increased. The K-means clustering algorithm is too inflexible of
an approach topartitioning forthis environment, because it requires a spec
ification of k, the number of clusters. In a realistic setting, an appropriate
number of clusters may not be determinable before runtime and may need
Chapter 4
The
VEOR
system
The VEOR (Video Expert Object Recognition) system seeks to apply the
EOR approach to video input, and addresses the concerns found in chap
ter 3 through algorithmic additions, substitutions, and modifications. Its
responsibilities are a superset of those of EOR, because it performs object
tracking and symbolic labeling in addition to visual matching. Runtime vi
suallearningisfacilitatedin multiple ways. Instances ofknown classes,from
both known
(trained)
and unknown(novel)
perspectives, can be introducedintomemory. Artificialclasses are created forunclassifiable input. Thetime
requiredto add an image to memory iskept to a minimum by reusingexist
ing clusterinformationwhen repartitioning. This keeps clustermembership
fairly stable, in addition toreducing clustering time. Thus, local PCA needs
tobe appliedonly toclusters whose membershiphas changed, and thenonly
Video Input
1
Foreground Segmentation
VEOR
ObjectTracking ? EOR Subsystem ? MembershipSubsystem
Subsystem I
ObjectClassifications
Figure 4.1: Architecture of the VEOR system. Arrows indicate the flow of
information.
4.1
VEOR System Architecture
VEOR is divided into logicalsubsystems. Functionality modeled after EOR
is found in the EOR subsystem. A separate Membership subsystem cal
culates class membership hypotheses for objects, while the Object Tracking
subsystemisresponsibleforfollowingobjectsthroughsuccessiveframes.
Seg
mentation ofvideo data is a necessary pre-processing step for VEOR input.
The relationships between these modules are shown in figure 4.1.
The EORsubsystemin VEORconsistsofthesame stages asEOR: feature
extraction, clustering, and exemplar matching, but substitutions and modifi
[image:32.528.71.463.99.312.2]has been replaced with a global application of PCA, and the K-means clus
tering algorithm has been replacedwith alearning-enabled algorithm based
on Fuzzy K-means [8]. Exemplar matching in VEOR happens in much the
same wayas in EOR.
The distinction between trainingand runtime
(testing)
phases has beencarried over from EOR; however, this division may be somewhat mislead
ing, becauselearningcontinues to occur duringthe runtime phase. Training
data are extracted from segmented video footage, and consist offour parts:
a video frame containing the trainingobject, a corresponding segmentation
frame that masks the object, the class ofthe object, and a coordinate pair
specifying a point which lies within the object's segmentation mask. Be
cause the training data are taken from real-world video footage, which is
segmented based solely on motion, a segmentation mask used in training
mayfind multipleobjects within its correspondingvideo frame. This iswhy
thecoordinatepairisnecessary: itspecifieswhichmasked region corresponds
to the trainingobject. Runtime input consists of avideo and a correspond
ingsegmentationvideo, each frameofwhichis a segmentationmask. Classes
for runtime objects are unknown, and coordinate pairs are unnecessary be
cause every segmented object (that meets certain constraints) is classified.
Multiple objects within a single frame are classified simultaneously.
The major steps of the VEOR system
during
training and testing aredescribed by algorithms 4 and 5.
simi-Figure 4.2: Example of VEOR training sample. The first two pieces of
data associated with this sample are a video frame and its corresponding
mask, shown above. The third and fourth are the class name "car" and the
(row,column)
coordinate(87,79),
which specifies the location of the object of interest. The upper-left corner of the images are considered to be thecoordinate origins, (1,1).
Algorithm 4 VEOR, training phase
1. Extract segmented image patches from trainingdata.
2. Assign membership of all training images to their respective classes.
3. Extract coarse features from training images by performing PCA and
projecting the datainto the global PCA subspace. This generates fea ture vectors.
4. Initializeasmall number of clustercentroids to thelocationsofrandom
feature vectors.
5. Perform Fuzzy K-means. If any cluster does not meet certain "good
ness"
criteria, add a new centroid that is themean ofa random subset
Algorithm 5 VEOR, testing phase
For each tracked object in each frame:
1. Extract a segmented image patch from theframe.
2. Extract coarse features from the image patch by projecting it into the
global PCA space.
3. Find the cluster centroid closest to the generated feature vector.
4. Ifthe local PCA transformation matrix for that cluster is not up to
date, compute it by performing PCA on the cluster's corresponding image data.
5. Project the image patch into the local PCA subspace for its cluster,
and find theclosest match fromthe projected cluster members.
6. If the distance (in global PCA space) from the testing image to its
exemplar match is below a threshold, contribute the membership of the exemplar match to the membership of the test image, and skip
steps 7-10.
7. Otherwise, introduce the testing image into the training set and per
form steps 2-4 of the training sequence, with the exception that the
initial cluster centroids in step 3 are set to the current cluster cen
troids.
8. Findtheexemplar matchforthetestingimagefromwithinitsnew clus
ter by performingsteps 4-5 of the testing sequence, while disallowing
the exemplar match from being the testingimage itself.
9. If the image is partitioned into a cluster by itself, then a new class is
created forit, and membership is assigned to that class.
10.
Otherwise,
contribute the membership of the exemplar match to thelar to themirror image (horizontal
reflection) ofanother. For example, acar
facing
totheright probablylooks likethemirrorimageofthesame carfacingto theleft.
Adding
mirrorimagesoftheentiretrainingdatabaseintomemorywould be redundant, so a different method is used. If mirroring is enabled,
both an object's image and its reflection are exemplar matched (see section
4.6), and whichever match is "better", or closer, is used forclassification (or is learned see section 4.8.1).
Implementation notes
All persistent data are stored in a "VEOR data structure", which is a sim
ple MATLAB structure. Examples ofsuch data are cluster centroids, PCA
transformation matrices, and membership information. This is done so that
multiple
"instances"
ofVEOR, trained separately and with different states,
maybe run side-by-sidein an application. Several VEOR functions take one
ofthe data structures as an argument.
The parameter flag EOR_mirrorlmages determines whether image mir
roring is used at runtime.
4.2
Foreground
segmentationBeforean object canbeclassified, it mustfirstbe located; that is, pixels cor
responding toobjects must be distinguishedfrom thosecorresponding toun
mixtureofGaussians background subtraction technique
[6],
implemented byJason Roberts. The input for this stage ofprocessing is simple video data, and theoutput is a maskvideo. Eachframe in theoutput video corresponds
to aframe inthe input, and the presence ofan object in the input frame is noted by a connected group of white pixels in its mask. All other pixels in
the mask video are black. Objects in a scene may then be separated from background byperforming alogical"AND" operation between avideo frame and its mask.
Segmentation isachievedthroughdetection andmodelingofbackground. When an object moves through ascene, it does not fit into the background model and isthus detected as foreground. The particular method described in
[6]
is noteworthy inthatit adapts to ascene, is robustto lightingchanges and multimodalbackgrounds, and can assimilate new objects intothe back ground if they become stationary for a period of time. Pixel color values are clustered into any number ofGaussian distributions (a parameter), andthese distributions are ranked according to their likelihood ofbelonging to
background. The heuristics used for this ranking are based on a Gaussian's variance (amovingobject tends tocause more variationina given pixel than
does
background)
and persistence(thecolors associatedwith amovingobjectwithin those distributions
(by
default, within 2.5 standard deviations) areexclusivelylabeled as background.
The default number of
Gaussians,
three, allows for the segmentation offoreground from abimodal background (the third Gaussian is used for fore
ground) under noisy conditions. When segmentation was performed for the
testing data described in sections 5.2 and 5.3, however, only two Gaussians
were used, because the short lengths of the involved video clips rendered
multimodal background detection unneccesary. Multimodal background de
tection should be used when providingVEOR with longer input videos.
Afterdetecting background, morphologicalprocessing isperformed tore
movefrom maskssmall patches ofwhitepixelsthat represent noise orincon
sequentiallysmall movingobjects. Inaddition, the morphologicalprocessing
serves to smooth the outlines of objects, fill holes in masks, and connect
foreground components that are close to one another. Components in such
close proximity often belong to the same object. The results offoreground
detection are shown in figure 4.2.
4.3
Object
tracking
After foreground pixels have been identified, they may be interpreted as
belonging to objects. Regions of connected foreground pixels are found, and
region properties (centroid, area, and bounding
box)
are calculated. RegionsIn thecurrent VEORimplementation, regions must meet two criteria to
betracked. First, anyregionthattouches an edge of aframe is ignored. This
is because EOR is an appearance-based technique, and the similaritythat it
would find between an object and aportion ofthat object decreases as less
ofthe object is visible. For example, it is unlikely that an image of a car
wouldbe the exemplar match ifone halfofthe same car image wasused as
input. Thus, anobject is nottracked until it isfully within the fieldofview,
and is no longer tracked when it begins to leave. Unfortunately, this same
situation may occur if an object becomes occluded while fully within the
frame, bybackground oranotherobject, forinstance, andthisis alimitation
of the current implementation. The second region acceptance criterion is
thatatrackedregion mustoccupyat least a minimumnumberofpixels. One
reasonforthisisthat, althoughthemajorityof segmentation noiseisremoved
through morphological processing, some is not. Any foreground region of
substantial size cannot be considered noise, so only objects are tracked. A
second reason is to eliminate the problem that far-away (low resolution)
objects aredifficulttodistinguish fromoneanother,and arethereforedifficult
to classify.
All regions meetingthe acceptance criteria are tracked among frames as
objects. The actual tracking mechanism currently used in VEOR is very
limited, and is a stand-in for some more state-of-the-art object tracking al
gorithm. Implementation of a robust
trackingscheme is beyond thescope of
this thesis, and work on such a system
inthe RITDepartmentofComputerScience. Theobject trackingsubsystem
in VEOR considers foreground regions in two consecutive frames to be the
same object if there is any overlap intheir
bounding
boxes. Trackingbehavioris undefined if there is a greaterthanone-to-one correspondence between
such regions.
Resulting
limitationsincludetheinabilityto track objectsthatdisappear and reappear, objects that overlap one another, and objects that
movefast enough relativeto the frame rate of video input such that thereis
no overlap in regions between consecutive frames. In addition, if an object
occupies more than one region, each constituent region will be tracked sep
arately. For example, ifa car drives behind a street sign, it will be tracked
as two separate objects while visually divided. However, this form of object
tracking serves as a proof ofconcept, and works well with real-world input
that avoids these admittedlyrealistic situations.
Implementation notes
The object tracking subsystem is split into two separate functions:
findOb-jects, which identifies foreground regions that meet the acceptance criteria,
and trackObjects,whichtracksobjectsamongframes. FindObjectstakesonly
a mask frame as a parameter, and returns allfound objects as a MATLAB
struct array. ThefindObjects_minSize system parameter sets the minimum
number of pixels of which a region must consist for it to be considered an
object; ifunspecified, the parameter defaults to 40. TrackObjects takes two
current frame and one for the previous frame. The function uses these to
determine which ofthe foundregionsare new objects and which are objects
thathavepersistedfromtheprevious frame,and relaysthisinformationwith
threereturn arrays: oneforobjectsthatfirstappearinthenewframe,onefor
objects that have been trackedfromthe previous frame, and one forobjects
that werein the previous frame but have disappeared. The structures used
asinputand output forthesefunctions areidenticaltothosereturned by the
regionprops MATLAB function, with the exception that they are assigned
an additional id field which specifies a unique numerical identifier for each
tracked object.
4.4
Feature
extractionFeature extraction in the EOR system consists of edge and line detection,
implemented as Gabor
filtering
and the Hough transform, respectively. Although thesealgorithms are incorporated intoVEOR, adifferent featureex
tractionpathway isusedbydefault. Gabor
filtering
andtheHoughtransformmay be enabled by setting system flags. In addition, processing is required
to transform input data into masked image patches. This processing is not
Initial processing
Each tracked object within a frame ofvideo must undergo several transfor
mations before featuresmaybeextractedfromit. Dataprovidedto thisstage
ofprocessing consist ofthe video frame and mask frame in which an object
appears, as well as thecoordinates ofa point that lieswithin the object. At
runtime, these coordinates are retrievedfrom the region propertiesfound by
the object tracking subsystem. During training, they are provided as input
data, in partbecause it is impossibleto trackanobject across asingle frame.
An object in a video occupies occupies a region whose size in pixels de
pends on the resolution ofthe video and on the distance ofthe object from
the camera. To compare pixel-based features among objects from different
frames, however, these regions must be rescaled to a common image patch
size, whichin VEORis square. Usingthe coordinatepairas alocatorforthe
appropriate region, thecenterand boundingboxoftheobject are calculated
from the mask frame. All other foreground regions of the mask are zeroed
out to ensure that masks corresponding to other objects do not affect the
masking ofthe object at hand. Next, the major axis ofthe object's region,
verticalor horizontal, is determined. Thereasonforthisisthat some objects
(such as pedestrians) are taller than they are wide, and other objects (such
as vehicles) are wider than tall. To most effectively scale the object, tall
objects should occupy the full height of the final image patch, while wide
objects should occupy the full width. The minor axis ofthe objects should
be to scale the axes separately, allowing all objects to occupy both the full
widthand heightofthefinal image patch; however, in doingthis, important
implicit information regarding the aspect ratio ofthe object would be lost.
Ifanobject liesnear the borderofthe framein such awaythat thepatch to
be extracted extends beyond the frame's borders, then the frame is padded
symmetrically. Resizing, using bilinear interpolation, is then performed on
therelevant part ofthe video frame. Nearest-neighbor interpolation is used
whenresizing the maskframe, because bilinear interpolation could cause in
appropriategraypixels toappearbetweentheblack and white regionsin the
mask.
Ifedgedetection isenabled, thenconvolutionwithGabor filtersisapplied.
Whenresizing is performed, extra pixels in all directions are also resized to
provide padding for the convolution, so that edge effects are avoided. The
object itself is extracted from the padding after convolution occurs, if it
occurs.
Finally, masking occurs through a logical "OR" operation between the
image and mask patches. If enabled, the Hough transform is applied to the
resulting image patch. The resulting data, be they grayscale image, edge
map, or hough space, are vectorized so that each pixel (or hough
bin)
is(a)
(b)
(c)
(d)
(e)
(f)
Figure 4.3: Stages of initial input processing on a sample,
(a)
and(b)
arethe sample's input video and mask frames, respectively,
(c)
and(d)
are theextracted and resized video and mask patches,
(e)
is the masked object ifGabor filtering is not used, while
(f),
shown in false color, is the masked [image:44.528.86.440.142.510.2]Principal Component Analysis
PCA has long been used as a feature extraction tool in face recognition, in
which the variations among many different faces may be well-represented
within a PCA subspace [2]. In the EOR system, PCA is used in the exem
plar matching phase to discriminate among what the clustering algorithm
determines tobe similar images. Thecreators ofEOR note that PCAworks
bestwhenappliedtoimages drawnfroma normal distribution
[3],
and whileimages ofa certain type ofobject (such asthe human
face)
maydrawfromanormaldistribution, adataset consistingofdifferent objects does not. Thus,
clusteringallows localsubspaces tobe generatedforthemultiple normaldis
tributions that are mixed in such a dataset. In
[2],
PCA is tested as single(global)
classificationstep, and is found to be inferior to EORwhen appliedto the cat and dog database (see section 5.1). However, Draper et al. show
that when EOR feature extraction is applied to aerial images of Fort Hood
before PCA is applied, performance is as good as the entire EOR system,
given a high enough number of retained dimensions [1]. Experiments with
VEORusingsegmentedvehicle data, however,show that performanceis sig
nificantly worse when clustering is left out, no matter how many subspaces
are retained.
InthedefaultVEORconfiguration,acombinationofthese twoapproaches
to PCAis used, andthe algorithmisapplied at botha global and local level.
Theglobal application ofPCAfunctionsas coarsefeature extraction, results
from which are used forclustering. The
thesamefunctionasit doesinEOR, which canbeconsideredfine featureex
traction. Thus PCA extractsthe largest features that it can from a dataset:
inter-class features from a multi-class mixture, and inter-instance features
from a cluster. PCA is commonly usedtoreduce the dimensionality ofdata
before clustering is performed. Ding and He
[15]
show that PCA itself performs data clustering according to K-means' objective function, improving
the performance ofclustering when the two techniquesare used insequence.
ExperimentswithVEORalso showthat theincrease inexecutiontimecaused
by the global PCA application is more than made up for by the decrease in
clusteringtime, and overall executiontime is significantly decreased.
Replacingedge-basedfeatureextraction withPCA isnot withoutcaveats,
however. Asnotedin
[3],
anadvantagetousing both GaborfilteringandPCAis that different properties ofthe data are exploited by the two techniques:
boundary and intensity information, respectively. The negative effects of
applying PCA to grayscale images at all levels is evidenced by the clusters
shown in figure 4.4. Dark cars tend to be clustered together, as do grayish
cars and whitish cars, whereas under edge-based feature extraction all such
cars would tend to be clustered together. In fact, when using the cat and
dog database (see section 5.1) as input, VEOR performs worse with PCA
feature extraction than with Gabor filtering. Despite these issues,
PCA-basedfeature extraction yields greater performanceintermsofaccuracyand
Figure 4.4: Some cars and vans clustered using global PCA for feature ex
traction. Rows represent clusters. Note that vehicles tend to be clustered both bytheir class and by their grayscale color.
Implementation notes
Image scalingandmasking, aswell asoptionalGabor
filtering
andtheHoughtransform, ishandledbythe MATLAB function EORPreProcessing. Thear guments to thisfunctionare avideoframe, a mask frame, and atwo-element
location vector. An argument providing Gabor filters may be used iffilter ingis enabled, and is ignoredotherwise. Two values are returned: an image patch ofthemaskedobject,and afeaturevector. IfneitherHoughnorGabor
filtering
are enabled, then that vector is simply the vectorized form of thereturned masked object. Theparameters imgSizeCand imgSizeR specifythe
filtering
is implemented in the functions genGabor and applyGabor, and theHough transform in hough.
The global application ofPCA is in the EORClassify function, which is
also responsible for calling categorization and exemplar matching routines.
TheparameterEOR_globalC specifiesthenumber of subspacedimensionsto
retain (aseparate parameter specifiesthe number oflocalretained subspace
dimensions). The principal component analysis itself is implemented in the
pea function. AglobalPCAtransformationmatrix isrecalculatedeverytime
that an image is introduced into memory through learning.
4.5
Clustering
4.5.1 Requirements
The major requirements for VEORclustering, other than the need for
high-quality partitioning, are firstly the ability to automatically determine, from
input data, an appropriate number ofclusters for those data; and secondly,
to efficientlyfacilitate learning. Theneedfortheformerinageneral-purpose,
dynamic environment is immediately apparent. However, the latter require
mentbears explanation. Everytime thesystemlearns, thatis, whenthesys
tem introduces new image data into memory, several time-consuming steps
occur. If PCA is used for feature extraction, then a new transformation
matrix must be calculated from the expanded data set.
Clustering
is thenclusterofthelearnedimage, acluster-specific transformationmatrix is com puted. These three steps are unavoidable. What we would like to avoid,
however, are unnecessary changes in the membership of other clusters, be causeachangeinanycluster requiresthatanewPCAtransformationmatrix
becalculatedfor it when animage is matchedto the cluster. So, the needto efficiently facilitate learning may be rephrased as an issue ofthe stability of
clusters'
membershipbetween partitionings. Another way in which learning
is facilitated isthat, whenalearnedobjectis partitionedinto itsown cluster, an artificial classis createdforit. Thisis described in detail in section 4.8.1.
4.5.2
Promoting
stability of cluster membershipAsstatedpreviously, significantprocessingtimemaybesavedifcluster mem
berships change as little as possible when adding new image data to VEOR memory. Unfortunately, the locally optimum partitioning reached by K-means is highly dependent upon the initial centroid values
(seeds)
chosen, and the most common methods for choosing seeds are by assigning them to the locations ofrandom data members, or to random locations [7]. This meansthat in practice, clusters are rarely identical from one partitioningto the next when the natural groupings ofthedata are not well separated.The K-Harmonic Means
(KHM)
algorithm[13]
has been found to belargely insensitive to seed locations when compared to K-means
[11],
and wasimplementedinthehopeofpreventing unnecessaryapplications ofPCA.
conver-gence of multiple centroids to the same locations, in effect preventing the
data from
being
partitionedinto morethan a small number ofclusters. Thisoccurred when clustering both high-dimensional raw image data and
lower-dimensional PCA subspace data, and under any parameterization ofKHM.
A different approach to cluster membership stability is taken from Un
supervised Fuzzy
Clustering
Optimal Number of Partitions(UFC-ONP)
algorithm
[10],
which is described in further detail in section 4.5.4. Everyclusteringof UFC-ONP is seeded with the centroids from theprevious clus
tering,whichencouragesthealgorithmtoconvergetoalocaloptimumsimilar
to that ofthe previous clustering. In addition, because this approach uses
the results ofwork that has already been done, it significantly reduces the
amount of time necessary to converge to a local optimum. This method is
used in VEOR, andthe introductionofa new image into memory generally
changes the membership of a small number ofclusters, and often only of a
single cluster.
4.5.3
Determining
an appropriate number of clustersFor aclustering schemeto be useful in areal-world system, where the input
data could vary significantly from one invocation to the next, and from one
particularapplicationofthesystemto another, itmust notrelyonan apriori
specification ofthe number of clustersto be found. Users ofclusteringsoft
ware often pickthevalue ofaparameter, k, using knowledgeoftheinput data
newimagesextractedfromavideostream, thenitshouldbeabletocopewith
the fact that the number of natural groups within the data might actually
increase as time progresses. In addition, Draper et al. find that the number
of actual classes in an image dataset does not necessarily correspond to the
best value ofk for the data, and get better results when overestimating the
parameter [1]. They attribute this to the possibility that within each class,
more cohesive logical groupingsmay exist. Thus, domain-specific knowledge
regarding thenumberofclassesamongwhichdiscriminationmustoccur does
not translate into knowledge ofhow many clusters should be found.
One method that may be used to estimate the relative goodness ofdif
ferent partitions is to apply a cluster validity index [8]. When applied to
partitionings of the same data into different numbers of clusters, these in
dices may, in theory, show which numb

![Figure 2.2:The Gabor energies of cat faces. The top row is the unfiltered input. second, third, and fourth rows are the faces filtered with even and oddGabor filters of sizes 7, 15, and 31, respectively, in false color.The inputimages were first scaled to the range [-1,1] and smoothed.](https://thumb-us.123doks.com/thumbv2/123dok_us/122524.11878/17.528.73.457.235.459/energies-unfiltered-filtered-oddgabor-filters-respectively-inputimages-smoothed.webp)
![Figure PCA,of 2.4: Two-dimensional illustration of the major steps of courtesy [16].](https://thumb-us.123doks.com/thumbv2/123dok_us/122524.11878/25.528.94.458.97.208/figure-pca-dimensional-illustration-major-steps-courtesy.webp)

![Figure 5.1: Some examples from the cat and dog database, courtesy of [3].](https://thumb-us.123doks.com/thumbv2/123dok_us/122524.11878/77.528.75.461.96.198/figure-examples-cat-dog-database-courtesy.webp)