T h e D iffuse In terstella r F ea tu res
and In terstella r R ela tio n sh ip s
by
Stephen John Fossey
A Thesis su b m itte d to th e U niversity of London
for th e degree of
D octor of P hilosophy
U niversity of L ondon O b serv ato ry
Mill Hill P a rk
London N W 7 2QS
ProQuest Number: 10797732
All rights reserved
INFORMATION TO ALL USERS
The qu ality of this repro d u ctio n is d e p e n d e n t upon the q u ality of the copy subm itted.
In the unlikely e v e n t that the a u th o r did not send a c o m p le te m anuscript and there are missing pages, these will be note d . Also, if m aterial had to be rem oved,
a n o te will in d ica te the deletion.
uest
ProQuest 10797732
Published by ProQuest LLC(2018). C op yrig ht of the Dissertation is held by the Author.
All rights reserved.
This work is protected against unauthorized copying under Title 17, United States C o d e M icroform Edition © ProQuest LLC.
ProQuest LLC.
789 East Eisenhower Parkway P.O. Box 1346
A b stra ct
This thesis describes the results of a survey of the diffuse interstellar features towards about 120 stars. The observations, the d ata reduction and the measurement of the strengths of the diffuse features are described. The equivalent widths of nine diffuse features are then used in a comprehensive statistical analysis of the relationship between the carriers of the diffuse features and other components of the interstellar dust and gas.
We re-examine some aspects of the well-known correlation of diffuse feature equiv
alent width with colour excess, E (B — V), and the extent of contamination of the
diffuse feature measurements by stellar photospheric lines is assessed. The inter relationships of the diffuse features are examined with the technique of Principal Com ponent Analysis and it is found th at there are real variations in the relative strengths of some features from one line of sight to another.
We perform a multivariate correlation analysis of the diffuse feature strengths using measurements of interstellar extinction in the ultraviolet and infrared, measure ments of interstellar polarization, indicators of cloud density and tem perature, and the abundances of a number of atomic and molecular species.
Evidence is found th a t in general the diffuse features are weak with respect to reddening where the characteristic size of the dust grains is large. The strengths of a number of diffuse features per unit hydrogen column density (‘abundances’) are found to be diminished along lines of sight characterized by denser clouds. The carriers of several diffuse features appear to be distributed like the refractory atomic species in the diffuse medium, their abundances being well correlated with the gas-phase abundances of species such as Mg and Fe. The anticorrelation of the abundances of a number of diffuse features with the abundances of several diatomic molecular species suggests that they are not a product of the network of gas-phase chemical reactions in quiescent clouds. Several pieces of evidence are presented to suggest th a t the diffuse feature carriers are produced in interstellar shocks.
F o r m y wife, Gina;
“M a n y w om en do noble things, but you surpass them a ll.”
P ro v erbs 31:29
A ck n o w led g em en ts
I am indebted to many who have contributed in various ways to the completion
of the work presented in this thesis. I thank first of all Dr. Derek McNally, who
has supervised my efforts with an enthusiasm born out of a long-standing interest in
the diffuse feature problem. In a field of study littered with the wreckage of broken
hypotheses, he has given me the freedom to steer my own wavering course, and I have
gained much from the experience. I am glad to have had the opportunity to work
with Derek. I thank also Professor Sir Robert Wilson and the Departm ent of Physics
and Astronomy at University College London for providing supplementary financial
support from the Perren fund, and for awaiting patiently the fruit of their investment.
I am particularly grateful to two colleagues who have walked with me through
this work: Dr. Paul Rees, with whom I have worked closely on the diffuse feature
problem, and Dr. Ian Crawford. I thank them for their direct contributions through
many stim ulating discussions on interstellar m atters. If just a small fraction of the
care and rigour with which Paul approaches his work has rubbed off on me, or if I
have become infected with only half Ia n ’s enthusiasm for his subject, then I will have
benefited richly from our m utual sojourn.
I am indebted to Dr. Mike Barlow and Dr. Ian Howarth, who between them have
read the whole manuscript. I have received much from their expert advice and their
generous encouragement. Dr. Paul O ’Brien has been a constant source of assistance,
and I particularly thank him for all the Tj^Xnical advice he has offered to me in the
course of preparing the manuscript. There are also a number of students and friends
who have assisted at various times with the preparation of tables of d ata and figures,
and so lifted some of the burden of those time-consuming tasks: I thank Ian Griffin,
Rosie Rush, Andrew Taylor, Mike Holloway, David Jones and Kyri Yiallouris.
A more friendly environment in which to work I could not imagine than th a t
created by the staff and postgraduate students at the University of London Observatory
and Annexe. I thank each of them for their unique contribution to the life of the
Observatory, particularly Wyn Hughes, who has been a great source of cheer during
the last hectic weeks of preparation; and Mrs. Maureen Evans, part-tim e cleaner and
thesis/careers advisor, who is always a tonic to us all. I am grateful too for the
My parents have patiently stood with me throughout this whole undertaking,
bringing much support, often gently inquiring of progress but never asking too many
awkward questions; I hope they feel as rewarded as I do with the completion of this
work. Only my wife and I know the full value of their unflagging support and th a t given
by our family and friends in Bedford and in Muswell Hill. In addition to such moral
encouragement, we have been overwhelmed by the generosity of those around us, having
received substantial and often anonymous gifts which have eased the financial burden
of studentship. I am grateful to my grandad, Chris Moloney, who has generously
underw ritten the copying and binding costs of the thesis; and I apologise to him for
having failed to include a reference in the thesis to his favourite astronomer, Sir Fred
Hoyle.
Plain words cannot express my gratitude to my wife, Gina, for her selfless com
m itm ent to stand with me through difficult circumstances in order to see this work
completed. She has sacrificed much for little gain. This work is hers also, for without
her it would not have been completed. I hope now to begin to repay the debt of love
which I owe to her. And finally, we thank Jonathan, for constantly reminding us of
the im portant things in life. For probably the first time in his life he now has my
Roads go ever ever on, Over rock and under tree,
By caves where never sun has shone, By streams that never find the sea: Over snow by winter sown,
A nd through the merry flowers o f June, Over grass and over stone,
A n d under mountains in the moon. Roads go ever ever on,
Under cloud and under star, Yet feet that wandering have gone
Turn at last to home afar. Eyes that fire and sword have seen
A nd horror in the halls of stone Look at last on meadows green
A nd trees and hills they long have known.
T able o f C o n te n ts
A bstract ... 3
A c k n o w led g e m e n ts... 4
Table of Contents ... 7
List of Tables ... 14
List of F i g u r e s ... 20
C h a p te r 1. In tr o d u c tio n : D iffu se C lo u d s, D iffu se F eatu res . . . 28
1.1 Interstellar clouds and p h a s e s ... 29
1.1.1 Cold neutral clouds ... 29
1.1.2 The warm intercloud medium ...31
1.1.3 The hot component ... 31
1.2 Dust and gas in the diffuse interstellar m e d i u m ... 32
1.2.1 Gas in the diffuse medium ... 32
1.2.2 Dust in the diffuse medium ... 34
1.3 Early interstellar spectroscopy and the discovery of the diffuse features . . 41
1.4 A review of studies of the diffuse interstellar features ... 43
1.4.1 The diffuse feature spectrum ...43
1.4.2 Correlation analyses of the diffuse feature strengths ...44
1.4.3 High resolution profile s t u d i e s ...49
1.4.4 The diffuse features in special e n v ir o n m e n ts ... 52
1.5 Models of diffuse feature p r o d u c t i o n ...57
1.5.1 Gas-phase origins ... 58
1.5.2 Dust grain origins ... 59
Contents
C h a p ter 2. O b serv a tio n s and D a ta C a l i b r a t i o n ...65
2.1 Lick Observatory observations ...65
2.1.1 The coude spectrograph and observing procedures ... 68
2.1.2 The M k ll Varo image in te n s if ie r ...71
2.1.3 Photographic p r o c e d u r e ...76
2.1.4 Microphotometry of the photographic p l a t e s ... 78
2.2 Photom etric and wavelength calibration ...79
2.2.1 The photometric c a lib r a t io n ...79
2.2.2 The wavelength calibration ...82
2.3 The accuracy of the calibrations ...84
2.3.1 The accuracy of the photometric c a l i b r a t i o n ... 84
2.3.2 The accuracy of the wavelength calibration ... 93
2.4 Discussion ... 94
C h a p ter 3 . S p e c tr o sc o p ic M ea su rem en ts o f th e D iffu se F ea tu res 96 3.1 The features m e a s u r e d ... 96
3.2 The measuring procedures ... 99
3.2.1 The rectification of the c o n t i n u u m ... 99
3.2.2 The spectroscopic m e a s u re m e n ts ... 103
3.2.3 Stellar photospheric lines and telluric lines ... 105
3.2.4 Additional c o n s id e ra tio n s ... 108
3.2.5 The rectification of the diffuse feature at 6284A 114
3.3 The errors on the diffuse feature m e a s u r e m e n ts ... 115
3.3.1 The error on the equivalent width ... 116
3.3.2 The error on the absorption d e p t h ... 122
3.3.3 The error on the central wavelength ... 124
3.3.4 The error on the FWHD ... 126
Contents
3.5 The averaged measurements and their errors ... 130
3.5.1 The averaged m e a s u re m e n ts ... 131
3.5.2 Non-detection criteria ... 131
3.5.3 The calculation of upper limits ... 133
3.6 Comparison with other w o r k ... 135
3.6.1 The observations of Herbig (1975) 135 3.6.2 High signal-to-noise o b s e rv a tio n s ... 140
3 .7 Summary ... 148
C h a p t e r 4 . T h e D iffu s e I n t e r s t e l l a r F e a t u r e s : B a s ic R e l a t i o n s h i p s a n d I n t e r - r e l a t i o n s h i p s ... 150
4.1 Some notes on the statistical m e t h o d s ... 151
4.2 The programme stars: general d ata and the database of equivalent widths 154 4.3 Statistical description of fundamental d a t a ... 167
4.3.1 The treatm ent of missing d a t a ... 167
4.3.2 Univariate description of fundamental d ata ... 168
4.3.3 The relative accuracies of the equivalent width measurements . . 172
4 .4 The relationship of the diffuse features to E (B — V) ... 174
4.4.1 The regression of W \ on E (B — V ) ... 175
4.4.2 The correlation between W \ and E (B — V ) ... 182
4.4.3 Regional variations in the diffuse feature s t r e n g t h s ... 185
4 .5 The dependence of the diffuse feature strengths on spectral type . . . 188
4.5.1 Spectroscopic pollution by telluric and photospheric lines . . . . 188
4.5.2 The correlation between residual diffuse feature strength and spectral type ... 190
4.5.3 Multiple regression of equivalent width on reddening and spectral type ... 196
Contents
4 .6 The inter-relationships between the diffuse features ... 204
4.6.1 Correlations between the equivalent widths of the diffuse features 205
4.6.2 Principal Component A n a l y s i s ... 217
4.6.3 Discussion ... 229
4 .7 Summary ... 235
C h a p t e r 5 . T h e D iffu s e I n t e r s t e l l a r F e a t u r e s , I n t e r s t e l l a r
E x t i n c t i o n a n d P o l a r i z a t i o n ... 2 3 8
5.1 Interstellar extinction and p o la r iz a tio n ... 239
5.1.1 Interstellar e x t i n c t i o n ... 239
5.1.2 Interstellar linear polarization ... 245
5.2 The relationship between the diffuse features and the interstellar
extinction curve ... 246
5.2.1 The photometry and colour excesses ... 248
5.2.2 Ordinary correlation of diffuse features with interstellar extinction 250
5.2.3 Partial correlation coefficients at constant E (B — V ) ... 258
5.2.4 Partial correlation coefficients at constant A v ... 265
5.3 A multivariate study of colour excess and the diffuse feature strengths . 276
5.3.1 The multivariate statistical model ... 277
5.3.2 The multiple r e g r e s s i o n ... 278
5.4 The relationship between the diffuse features and interstellar polarization 288
5.4.1 The correlation of the diffuse feature strengths with Amax . . . . 289
5.4.2 The correlation of the diffuse feature strengths with Pmax . . . . 294
5.5 Discussion ... 302
5.5.1 Interstellar grains and the extinction curve ... 302
5.5.2 Summary and interpretation of the correlations with extinction and
with 305
5.5.3 Discussion of the im purity absorber h y p o th e s is ... 309
Contents
C h a p t e r 6 . T h e D iffu se I n t e r s t e l l a r F e a t u r e s a n d A to m ic a n d
M o le c u la r A b u n d a n c e s ...3 1 3
6.1 Diffuse feature ‘abundances’ with respect to h y d r o g e n ... 313
6.2 The dependence of the diffuse feature abundances on interstellar space
d e n s i t y ... 320
6.2.1 The correlation of A(A) with the mean line-of-sight hydrogen density 320
6.2.2 The correlation of A(A) w ith cloud tem perature and indicators of
the local space density of h y d r o g e n ...326
6.2.3 The correlation of £2 and the diffuse feature abundance ratios with
indicators of cloud d e n s i t y ... 329
6.2.4 Other studies of the dependence of the diffuse features on cloud
density ... 331
6 .3 The relationship of the diffuse features to the abundances of interstellar
a t o m s ... 336
6.3.1 The atomic abundance d a t a ... 337
6.3.2 The correlation of A(A) w ith atomic a b u n d a n c e s ... 340
6.3.3 The correlation of £2 and the diffuse feature abundance ratios with
atomic a b u n d a n c e s ... 352
6 .4 Discussion of the correlations w ith density and the atomic abundances . 358
6.4.1 The correlations with (nn) and A ( X )... 358
6.4.2 The diffuse features, depletion variations and i o n i z a t i o n ... 365
6.5 The relationship of the diffuse features to interstellar molecules . . . . 372
6.5.1 The molecular abundance study of Rees ( 1 9 9 0 ) ... 373
6.5.2 The correlation of the diffuse feature strengths with molecular
column d e n s i t i e s ... 375
6.5.3 The correlation of the diffuse feature abundances with molecular
abundances ... 376
6.5.4 The correlation of the diffuse feature abundances and abundance
Contents
6.6 Discussion of the correlations with molecular a b u n d a n c e s ... 388
6.6.1 The correlations with neutral m o le c u le s ... 388
6.6.2 O ther studies of the relationship between the diffuse features and H2 392 6.6.3 The correlations with CH+ ... 400
6.7 Summary ... 407
C h a p t e r 7 . C o n c lu s io n s : M o d e ls o f D iff u s e F e a t u r e P r o d u c t i o n 4 0 9 7.1 Observational constraints on models of diffuse feature production . . . 409
7.1.1 Overview of the observational constraints ... 409
7.1.2 The diffuse features and their interstellar environment ...412
7.2 Discussion of models of diffuse feature p r o d u c t i o n ...414
7.2.1 Dust grain models ... 414
7.2.2 Gas phase models ... 421
7.3 Conclusions and future d i r e c t i o n s ... 438
A p p e n d i x 1 . S u p p l e m e n t a r y D a t a T a b le s ... 4 4 2 A 1.1 Supplementary measurements of the diffuse f e a t u r e s ...442
A 1.2 High S/N observations of the diffuse f e a t u r e s ... 450
A 1 .3 Infrared colour excesses ... 452
A 1 .4 Ultraviolet colour excesses ... 455
A 1.5 The total visual extinction A y ... 460
A 1 .6 Measurements of interstellar p o la r iz a tio n ... 462
A 1 .7 Observations of atomic and molecular h y d r o g e n ... 463
A 1 .8 Column densities of interstellar atomic species ... 467
A 1.9 Column densities of interstellar diatomic molecules ...475
Contents
A p p e n d ix 2. S u p p le m e n ta r y F ig u res ... 480
A 2.1 Univariate distributions ... 480
A 2 .2 The dependence of equivalent width on E (B — V) ... 480
A 2.3 The dependence of residual equivalent width on spectral type . . . . 481
A 2.4 The intercorrelations between the diffuse feature s t r e n g t h s ...481
A 2.5 The correlation between equivalent width and Pmax ... 482
A 2 .6 The correlation between equivalent width and N (H ) ... 482
A 2 .7 The correlations with interstellar atomic abundances ...482
A 2 .8 The correlations with interstellar molecular abundances ... 483
List o f T ables
C h a p te r 2
T a b le 2.1. The Lick diffuse feature programme: observing seasons and observers 66
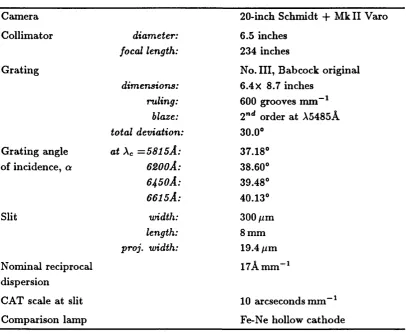
T a b le 2.2 . Summary of coude spectrograph co n fig u ra tio n ...69
T a b le 2.3. Relative intensities of spectrograph S-decker calibration strips . . . 70
T a b le 2.4. Wavelengths of Fe-Ne comparison l i n e s ...83
T a b le 2.5. The accuracy of the photometric calibration t e s t s ...90
C h a p te r 3
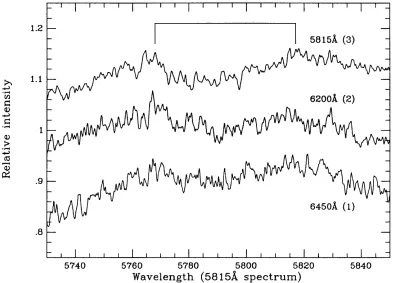
T a b le 3.1. The diffuse interstellar features in the wavelength ranges of the
5815A and 6615A s p e c t r a ... 97
T a b le 3 .2 . Telluric lines in the region of the AA5780, 5797, 6614 and 6661
diffuse f e a tu r e s ... 106
T a b le 3.3 . Stellar photospheric lines in the region of the AA5780, 5797, 6614
and 6661 diffuse features ... 107
T a b le 3.4 . An example calculation of the error on the equivalent w idth . . . 121
T a b le 3 .5 . The internal consistency of the central wavelength measurements
of A6614 and A6661 ... 126
T a b le 3.6. The internal consistency of the equivalent width measurements
of A5780, A5797, A6614 and A6661 129
T a b le 3 .7 . The average differences between the estimated equivalent widths
and the upper limits of non-detected features ... 134
T a b le 3 .8 . The results of the correlations between the equivalent widths of
this work and those of Herbig ( 1 9 7 5 ) ... 136
T a b le 3 .9 . A comparison of the equivalent widths of A5780 and A5797 obtained
in this work with those obtained by other authors using high S/N d ata . . 142
T a b le 3 .1 0 . A comparison of the equivalent w idth measurements of A6614 obtained in this work with those obtained by other authors using high S /N
d a t a ... 143
T a b le 3 .1 1 . The results of the correlations between the equivalent widths of
Tables
C h a p te r 4
T a b le 4 .1 . The diffuse feature programme stars: basic d a t a ... 156
T a b le 4 .2 . The diffuse feature equivalent w i d t h s ... 162
T a b le 4 .3 . Moments of the univariate distributions of the diffuse feature equivalent widths and the reddenings and intrinsic colours of the programme s t a r s ... 169
T a b le 4 .4 . The accuracy of the equivalent widths of the diffuse features . . 173
T a b le 4 .5 . The key to the symbols used to distinguish between stars in different OB associations and field s t a r s ... 175
T a b le 4 .6 . The regression of W \ on E (B — V) ... 181
T a b le 4 .7 . The correlation between W \ and E (B — V) ... 183
T a b le 4 .8 . Stellar absorption lines in the region of each of the diffuse features 189 T a b le 4 .9 . The correlation between R \ and I , ... 194
T a b le 4 .1 0 . The correlation between R \ and I s for restricted samples of d a ta 195 T a b le 4 .1 1 . The multiple regression of W \ on E (B — V) and I B ... 197
T a b le 4 .1 2 . The multiple regression of W \ on E ( B — V), / , and log (n u )E - 199 T a b le 4 .1 3 . The regression of W \ on E (B — V) ... 200
T a b le 4 .1 4 a . The intercorrelations between the diffuse features: W \ vs. W \ . 207 T a b le 4.146. The intercorrelations between the diffuse features: vs. W \ and W l... 208
T a b le 4 .1 5 . The partial correlations between the diffuse features with respect to constant E (B — V): W ° vs. W \ and W ° ... 211
T a b le 4 .1 6 . The correlations between the diffuse feature strengths per unit A v 215 T a b le 4 .1 7 . The results of PC A 1 using only the Pearson correlation coefficients, r p ... 220
T a b le 4 .1 8 . The results of PC A 1 ... 222
T a b le 4 .1 9 . The results of PCA 2 ... 225
T a b le 4 .2 0 . The results of PCA 3 ... 226
T a b le 4 .2 1 . The regression of £i on E (B — V) and on A y ... 232
Tables
C h a p ter 5
T a b le 5 .1 a. The correlation between W \ and the UV colour excesses
E (X u v - V) ... 251
T a b le 5.16. The correlation between W \ and the UV colour excesses
E ( X u v - V )... 252
T a b le 5 .2 a. The correlation between W \ and th e IR colour excesses
E ( V - XIR ) ... . 255
T a b le 5.26. The correlation between W% and the IR colour excesses
E ( V - X i r ) ... 256
T a b le 5 .3 a. The correlation between W \ and the UV colour excesses
E(Ai - A2) 259
T a b le 5.36. The correlation between W% and the UV colour excesses
E(Xi — A2) 259
T a b le 5 .4 a. The partial correlations between W \ and the UV colour excesses
E{X\ — A2) at constant E (B — V) ... 262
T a b le 5.46. The partial correlations between and the UV colour excesses
E(X\ — A2) at constant E (B — V) ... 262
T a b le 5 .5 . The partial correlations of W \ and with E ( V — K) and
E (V — L) at constant E (B — V ) ... 266
T a b le 5 .6 a. The partial correlations between W \ and the UV colour excesses
at constant A v ... 268
T a b le 5.66. The partial correlations between and the UV colour excesses
at constant A v ... 269
T a b le 5 .7 a. The partial correlations between W \ and E (B — V ) at constant
E (V — K )\ at constant E (V — L) and at constant A v ... 274
T a b le 5.76. The partial correlations between W® and E (B — V ) at constant
E ( V — K ); at constant E (V — L) and at constant A v ... 274
T a b le 5 .8 a. The results of the multiple regression of E(X — V ) on W \ . . . . 281
T a b le 5.86. The results of the multiple regression of E(X — V ) on W® . . . . 282
T a b le 5.9 . The results of the multiple regression of E (Ai — A2) on W \ and W® 287
T a b le 5 .1 0 . The correlation of diffuse feature strength per unit A v with 1/Amax 290
T a b le 5 .1 1 a. The correlation between W \ and Pmax, and the partial correlation
at constant E (B — V) and at constant A v ... 297
T a b le 5.116. The correlation between and P max, and the partial correlation
Tables
C h a p ter 6
T a b le 6.1. The correlation of the diffuse feature abundances, A(A), with the
mean line-of-sight hydrogen density, (t i h) or ( n n j g ... 321
T a b le 6 .2 . The correlation of the diffuse feature abundances, A(A), with the rotational tem perature of molecular hydrogen, Toi, and the hydrogen space
density, n n... 327
T a b le 6.3. Some estimates of the local space density of hydrogen, n n , in
diffuse clouds ... 330
T a b le 6.4 . The correlation of the diffuse feature abundance ratios and £2 with
the mean line-of-sight hydrogen density, (nn) or (t i h) ^ the rotational
temperature of molecular hydrogen, Toi, and the space density of
hydrogen, t i h ... 331
T a b le 6.5. The principal sources of the atomic abundance d ata used in the
correlation a n a ly s e s ... 337
T a b le 6.6 . The correlation of the diffuse feature abundances, A{ \ ) , with
interstellar atomic abundances—Mg, Si, P, S, Ti, Mn, Fe and Z n ... 341
T a b le 6.7. The correlation of the diffuse feature abundances, A (A), with
interstellar ionic abundances—C l, N aI, K I and C a l l ... 348
T a b le 6.8. The correlation of the atomic and ionic abundances A { X ) with
the mean line-of-sight hydrogen density, {nn) and {n n )E ... 350
T a b le 6.9. The most significant partial correlations at constant log {nn)E
between the diffuse feature abundances, A{A), and the atomic
abundances, A ( X)... 351
T a b le 6.1 0 . The correlations of the diffuse feature abundance ratios with
interstellar atomic a b u n d a n c e s ... 353
T a b le 6.1 1 . The correlations of the diffuse feature abundance ratios with
interstellar ionic a b u n d a n c e s ... 356
T a b le 6.12. The most significant partial correlations at constant log(nH)£ between the diffuse feature abundance ratios and the atomic
abundances A { X )... 356
T a b le 6 .1 3 a. The slopes of the regressions of the diffuse feature abundances,
A(A), and of the atomic abundances, A (X ), on log ( n n ) ... 360
T a b le 6.135. The slopes of the regressions of the diffuse feature abundances,
A(A), and of the atomic abundances, A ( X ) , on log {nn)E ... 360
T a b le 6.1 4 . The correlation of the diffuse feature abundances and abundance
ratios with the column density ratio loglV(NaI)/iV’( C a I I ) ... 367
T a b le 6.1 5 . A summary of the results of Rees (1990): the significant correlations between the diffuse feature residuals and the logarithmic
Tables
T a b le 6 .1 6 . The correlation between the logarithmic column densities of the
diffuse features, N ( X ) f, and the logarithmic column densities of diatomic
m o le c u le s ... 376
T a b le 6 .1 7 . The correlation between the diffuse feature abundances and the
abundances of the neutral diatomic molecules H2, CH, CO and CN . . . . 378
T a b le 6 .1 8 . The correlation of the molecular abundances and column density ratios with the logarithmic mean line-of-sight hydrogen density, lo g (n n )
or log {t i h ) e ... 382
T a b le 6 .1 9 . The correlation of the diffuse feature abundance ratios and £2
with the abundances of the neutral diatomic molecules H2, CH, CO and CN 382
T a b le 6 .2 0 . The correlation of the diffuse feature abundances and abundance
ratios with the abundance of CH+ ... 384
T a b le 6 .2 1 a. The correlation of the diffuse feature abundances, A (A), w ith the
column density ratios log iNT(CH+ )/iV’(CH) and log l\T(CH+ )/lV(H2) . . . . 385
T a b le 6.216. The correlation of the diffuse feature abundance ratios and £ 2
with the column density ratios log iV(CH+ )/iV(CH) and log iV(CH+ )/N(1B.2) 385
T a b le 6 .2 2 . The correlations between the diffuse feature column densities,
N ( X ) f, and N (H2) for a sample of relatively unreddened stars; and the
correlation between the diffuse feature column densities per unit N(E.2) and
the proportion of rotationally excited H2 for J = 2,3 ,4 and 5 ... 394
T a b le 6 .2 3 . The correlation between the diffuse feature column densities per
unit iV(H2) and the proportion of rotationally excited H2 in the rotational
levels J = 2 and 3, for iV(H2) < 1017 cm-2 only ... 398
A p p e n d i x 1
T a b le A 1.1a. The central depths of the diffuse features measured in this work:
A5780, A5797, A6614 and A6661 443
T a b le A 1.16. The central wavelengths, Ac, and the full widths at half-depth, T,
of the diffuse features A6614 and A6661 ... 447
T a b le A 1 .2 . A database of equivalent widths constructed from published
high S/N observations of the diffuse features towards stars of low reddening 451
T a b le A 1 .3 . A sample of infrared colour excesses observed towards the stars
in the diffuse feature p r o g r a m m e ... 453
T a b le A 1 .4 a . A sample of A N S ultraviolet colour excesses observed towards
the stars in the diffuse feature p ro g ra m m e ... 456
T a b le A 1.46. A sample of Copernicus far-ultraviolet colour excesses observed
towards the stars in the diffuse feature p r o g r a m m e ... 459
T a b le A 1 .5 . The total visual extinction, A v , and the total-to-selective
Tables
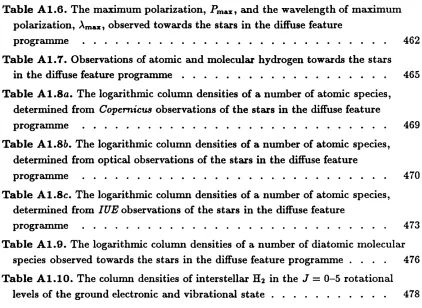
T a b le A 1 .6 . The maximum polarization, Pmax, and the wavelength of maximum
polarization, Amax, observed towards the stars in the diffuse feature
p r o g r a m m e ... 462
T a b le A 1 .7 . Observations of atomic and molecular hydrogen towards the stars
in the diffuse feature p ro g ra m m e ... 465
T a b le A 1 .8 a . The logarithmic column densities of a number of atomic species,
determined from Copernicus observations of the stars in the diffuse feature
p r o g r a m m e ... 469
T a b le A 1.86. The logarithmic column densities of a number of atomic species, determined from optical observations of the stars in the diffuse feature
p r o g r a m m e ... 470
T a b le A 1.8c. The logarithmic column densities of a number of atomic species,
determined from IUE observations of the stars in the diffuse feature
p r o g r a m m e ... 473
T a b le A 1 .9 . The logarithmic column densities of a number of diatomic molecular
species observed towards the stars in the diffuse feature programme . . . . 476
T a b le A 1 .1 0 . The column densities of interstellar H2 in the J = 0-5 rotational
List o f F igu res
C h a p te r 1
F ig u re 1.1. The logarithmic depletions D{ X i ) versus the condensation
tem peratures Tc of different elements X, for a mean line-of-sight hydrogen
density (nn) = 3 cm-3 ...36
F ig u re 1.2. The distribution of the diffuse feature programme stars: (a), in
projection on the Galactic plane; (6), in Galactic longitude and latitude (/,&);
and (c), in the (l,z) p l a n e ...62
C h a p te r 2
F ig u re 2.1 . Negative print of a typical plate obtained during the diffuse feature p r o g r a m m e ... 67
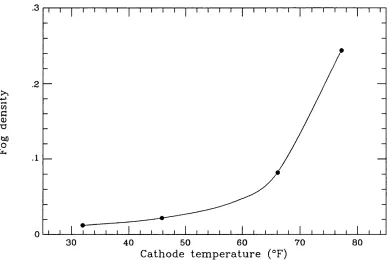
F ig u re 2.2 . The background fog of the Varo image intensifier as a function
of the tem perature of the p h o to c a th o d e ...72
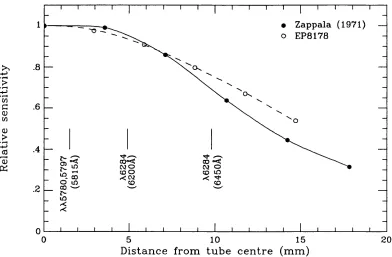
F ig u re 2.3 . The radial response of the Varo image tube ... 73
F ig u re 2.4 . The artificial absorption trough, illustrated in several spectra of
HD 149757 75
F ig u re 2 .5 . The PDS scan across one of the diffuse feature p l a t e s ...80
F ig u re 2.6 . The photometric calibration curve ... 81
F ig u re 2.7 . The mean residuals from the calibration curve fit, averaged over
(a) all the 5815A plates, and (6) all the 6615A p l a t e s ...88
F ig u re 2.8 . The mean residuals obtained from the test calibrations using the
corrected S-decker intensities ... 91
F ig u re 2.9 . The mean residuals obtained from the test calibrations using the
corrected L-decker intensities ... 91
F ig u re 2 .1 0 . The deviations about the fitted characteristic curve, averaged over
Figures
C h a p ter 3
F ig u re 3.1 . An example of the continuum rectification procedure in the region
of the A6614 diffuse f e a t u r e ... 100
F ig u re 3.2 . An example of the continuum rectification procedure in a spectral
region affected by the artificial absorption trough ... 102
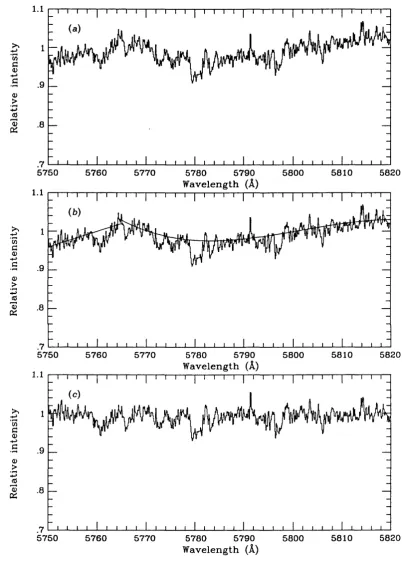
F ig u re 3 .3 . The spectrum of HD 183143 in the region of the A5780 and A5797
diffuse f e a tu r e s ... 109
F ig u re 3.4. The spectrum of HD 209481 in the region of the A5780 and A5797 diffuse features, illustrating the variable contamination of A5797 by the
Doppler-shifted C IV line at A5801.5A... I l l
F ig u re 3.5 . The spectrum of HD 210839 in the region of the A5780 and A5797 diffuse features, illustrating the contamination of A5797 by the rotationally
broadened C IV line at A 5801.5A ... 112
F ig u re 3 .6 . A comparison of the scatter in the measurements of the equivalent
widths of A5780 and A5797, a(Wj), with their mean propagated errors, A W j 128
F ig u re 3 .7a. A comparison of the equivalent widths of A5780 obtained in
this work with those of Herbig ( 1 9 7 5 ) ... 137
F ig u re 3.76. A comparison of the equivalent widths of A5797 obtained in
this work with those of Herbig ( 1 9 7 5 ) ... 138
F ig u re 3.7c. A comparison of the equivalent widths of A6614 obtained in
this work with those of Herbig ( 1 9 7 5 ) ... 139
F ig u re 3 .8a. A comparison of the equivalent widths of A5780 obtained in
this work w ith those taken from the high S/N observations of other authors 145
F ig u re 3.86. A comparison of the equivalent widths of A5797 obtained in
this work with those taken from the high S/N observations of other authors 146
F ig u re 3.8c. A comparison of the equivalent widths of A6614 obtained in
this work w ith those taken from the high S/N observations of other authors 147
C h a p ter 4
F ig u re 4 .1 . Frequency bar charts illustrating the univariate distributions of the equivalent w idth measurements of AA5780, 5797, 6203, 6284 and 6614, and
of the colour excess E ( B — V ) ... 170
F ig u re 4 .2 . Frequency bar charts illustrating the univariate distributions of (a) the spectral types and (6) the luminosity classes of the diffuse feature
programme s t a r s ... 171
F ig u re 4 .3 . The dependence of equivalent width, W \ , on E ( B — V ) . . . . 176
F ig u re 4 .4 . A comparison of the diffuse features towards several stars in the
Figures
F ig u re 4 .5 . The dependence of the residual equivalent widths of the diffuse
features on the spectral type of the target stars ... 192
F ig u re 4 .6 . The dependence of corrected equivalent width, W° , on E ( B — V) 201
F ig u re 4 .7 . The intercorrelations of the equivalent widths of AA5780, 5797,
6284 and 6614 ... 209
F ig u re 4 .8 . The intercorrelations of the equivalent widths of AA5780, 5797,
6284 and 6614, following normalization to unit E ( B — V) ... 212
F ig u re 4 .9 . The intercorrelations of the equivalent widths of AA5780, 5797,
6284 and 6614, following normalization to unit A v ... 216
F ig u re 4 .1 0 . The results of PCA 1 for the Pearson correlation coefficients only 221
F ig u re 4 .1 1 . The results of PCA 1 for all four sets of correlation coefficients 223
F ig u re 4 .1 2 . The results of PCA 2 227
F ig u re 4 .1 3 . The results of PCA 3 227
F ig u re 4 .1 4 . The results of PCA 4 227
F ig u re 4 .1 5 . The dependence of the first principal component £i on
(a) E ( B — V) and (6) A v ... 233
C h a p t e r 5
F ig u re 5.1. A mean interstellar extinction c u r v e ... 240
F ig u re 5.2. The correlation of the equivalent widths of several diffuse features
with E ( 15 - V) ... 253
F ig u re 5.3 . The correlation of the equivalent widths of several diffuse features
with E (V - K ) 257
F ig u re 5.4. The correlation of the equivalent widths of several diffuse features
with F ( B u m p ) ... 260
F ig u re 5.5. The correlations of W5797 and W&2sa with the UV colour excesses
F ( 1 0 - 13) and F(15 - 18) 261
F ig u re s 5 .6 a ,b. The correlation of the diffuse feature strengths per unit E ( B — V)
with UV colour excesses per unit E ( B — V): (a) [W5780/E ( B — V)]
vs. A(Bump); (6) [Weei^f E (B — V)] vs. E(25 — 33) / E ( B — V ) ... 263
F ig u re s 5.6c, d. The correlation of the diffuse feature strengths per unit E ( B — V)
with UV colour excesses per unit E ( B — V): (c) [Ween/EI^B — V)] and
(d) ^ vs. E (10 - 13) / E ( B - V ) ... 264
F ig u re 5.7 . The correlation of the equivalent width of A5797 per unit A v w ith
E ( X - V ) / A v ... 270
F ig u re 5.8. The correlations of the strengths of A5780 and A5797 per unit A v
Figures
F ig u re 5.9. The correlation of the strengths of AA5780, 5797, 6203, 6270, 6284
and 6614 per unit E ( V — K) with E ( B — V ) / E ( V — K ) ... 275
F ig u re 5 .1 0 . The wavelength dependence of the fractional contribution to R2
of A5797 and A6284 in the regression of E(A — V) on (ai W5797 + 02^6284) • 284
F ig u re 5 .1 1 . The wavelength dependence of the regression coefficients ay from
the regression of E(X — V) on (ai 1^5797 + 02^6284) ... 284
F ig u re 5.1 2 . The combined strength of A5797 and A6284, E ( w\ ), plotted
against E ( 15 - V), E ( B - V) and E ( V - K) ... 285
F ig u re 5 .1 3 . The correlation of the strengths of A5797 and A6284 per unit A v
with 1/A ... 291
F ig u re 5.1 4 . The correlation of the combined strength of A5797 and A6284
per unit A v with 1/Amax; and the correlation of £1j A v with 1/Amax . . . . 292
F ig u re 5 .1 5 . The correlation of equivalent width with Pmax for AA5780, 5797,
6203 and 6284 ... 295
F ig u re 5.1 6 . The correlation of \W \/A v \ vs. Pmax/ A v for A5780, A5797 and
A6284 ... 299
F ig u re 5.1 7 . The inverse dependence of Pmax/ A v on ( nn) E ... 300
C h a p t e r 6
F ig u re 6 .1 . The correlations between the equivalent widths of several diffuse
features and the total column density of hydrogen, N (H ) ... 316
F ig u re 6 .2 . The correlations between the diffuse feature abundances, A(A),
and the logarithm of the mean line-of-sight hydrogen density, (nn) . . . . 322
F ig u re 6 .3 . The correlations between the diffuse feature abundances, A(A),
and the logarithm of the rotational tem perature of molecular hydrogen, Toi 328
F ig u re 6 .4 . The inverse dependence of log Toi on log(nn) and lognn . . . 329
F ig u re 6 .5 . The correlations which were found to be significant between the
diffuse feature abundances, A (A), and the logarithm of the space density
of hydrogen, log n n ... 330
F ig u re 6 .6 . The correlations which were found to be significant between the diffuse feature abundance ratios and the mean line-of-sight hydrogen density,
(nH> or (nH)E ... 332
F ig u re 6 .7 . The correlations which were found to be significant between the diffuse feature abundance ratios, the rotational tem perature of molecular
hydrogen, Toi, and the space density of hydrogen, n n ... 333
F ig u re 6 .8 . A comparison of the strengths of A5780 and A5797 towards several
Figures
F ig u re 6 .9 . Some examples of the positive correlations between the diffuse feature abundances, A(A), and the abundances of refractory atomic
species—Mg, Fe and S i ... 344
F ig u re 6 .1 0 . The correlation of A(6284) and A (fi) with the abundance of Fe,
and the correlation of A(6284) with the abundance of M n ... 345
F ig u re 6 .1 1 a . The correlations which were found to be significant between the diffuse feature abundances, A(A), and the abundances of the volatile atomic
species Zn and S ... 346
F ig u re 6.116. An illustration of the absence of significant correlation between
the diffuse feature abundances A(5780) and A (6284) and the abundance
of the refractory atomic species T i ... 347
F ig u re 6 .1 2 . The correlations which were found to be significant between the
diffuse feature abundances, A (A), and the abundances of the ions N a l
and K I ... 349
F ig u re 6 .1 3 . The significant correlations found between the component
scores of £2 and the abundances of the refractory atomic species Fe,
Si and M n ... 352
F ig u re 6 .1 4 . The significant correlations found between the abundance ratio A5780/A5797 and the abundances of the refractory atomic species Mg,
Fe and Mn ... 354
F ig u re 6 .1 5 . The correlations which were found to be significant between the diffuse feature abundance ratios A6284/A5797 and A6284/A6614 and the abundances of the refractory atomic species Mn and S i ...
F ig u re 6 .1 6 . The significant anticorrelations found between the abundance ratio A5780/A5797 and the abundances of the ions C l, N a l and K I . . . .
F ig u re 6 .1 7 . The inverse dependence of the abundance of A5780 and the abun dance ratio A5780/A5797 on the column density ratio log iV (N aI)/iV(CaII)
F ig u re 6 .1 8 . The inverse dependence of the abundance ratio A5780/A5797 on
Av , £ (3 3 - V), £(22 - V) and £(10 - 13) ...
F ig u re 6 .1 9 . The correlations which were found to be significant between the diffuse feature column densities, iV(A)/, and the column densities of
interstellar m o le c u le s ...
F ig u re 6 .2 0 . The anticorrelations which were found to be significant between the diffuse feature abundances, A(A), and lo g /, the logarithmic abundance
of molecular hydrogen ... 379
F ig u re 6 .2 1 . The anticorrelations which were found to be significant between the diffuse feature abundances, A(A), and the abundances of CH,
CO and C N ... 380
355
357
368
371
Figures
F ig u re 6 .2 2 . The anticorrelations which were found to be significant between
the abundance ratios of the diffuse features and the abundances of H2,
CH and C O ... 383
F ig u re 6 .2 3 . The correlations which were found to be significant between
the diffuse feature abundances, A (A), and the column density ratios
logiST(CH+ )/iV(CH) andlogi\r(C H + )/JSr(H2) ... 386
F ig u re 6 .2 4 . The correlations which were found to be significant between the diffuse feature abundance ratios and the column density ratios
logiV(CH+ )/iV(CH) andlogJV(CH+)/JV(H2) ... 387
F ig u re 6 .2 5 . The correlations between the column densities, N ( X ) f, of the
diffuse features AA5780, 5797, 6284 and 6614 and the column density of H2,
from observations of the diffuse features towards stars of low reddening . . 395
F ig u re 6 .2 6 . The correlations between the column densities, N ( X ) f, of the
diffuse features and the column density of H2, iV(H2, J ) , in the
rotational level J = 3 of the ground electronic and vibrational state, after
normalization to the total column density of H2 ... 396
F ig u re 6 .2 7 . The correlations between the column density of A5780 and the
column densities of H2, iV(H2, J ), in the rotational levels J = 2 ,3 ,4 and 5
of the ground electronic and vibrational state, after normalization to the
total column density of H2 ... 397
A p p e n d i x 2
F ig u re A 2 .1 . Frequency bar charts illustrating the univariate distributions of the equivalent w idth measurements of all the diffuse features studied in
this work; and the univariate distributions of the colour excesses E ( B — V)
and intrinsic colours ( B — V ) Q of the programme stars ... 484
F ig u re A 2 .2 . The dependence of the equivalent widths of the diffuse features
on E ( B - V ) ... 486 F ig u re A 2 .3 . The dependence of the residual equivalent widths of the diffuse
features, R\ , on the spectral types of the target s t a r s ... 491
F ig u re A 2 .4 . The intercorrelations of the equivalent widths of the diffuse
f e a t u r e s ... 496
F ig u re A 2 .5 . The intercorrelations of the equivalent widths of the diffuse
features, following normalization to unit E ( B — V) ... 502
F ig u re A 2 .6 . The intercorrelations of the equivalent widths of the diffuse
features, following normalization to unit A v ... 504
F ig u re A 2 .7 . The correlations between the equivalent widths of the diffuse
Figures
F ig u re A 2 .8 . The correlations between the diffuse feature equivalent widths
and the total column density of hydrogen, N (H ) ... 514
F ig u re A 2.9. The correlations between the diffuse feature abundances and
interstellar atomic abundances—Mg and S i ... 516
F ig u re A 2.1 0 . The correlations between the diffuse feature abundances and
interstellar atomic abundances—P, S and Z n ... 517
F ig u re A 2 . l l . The correlations between the diffuse feature abundances and
interstellar atomic abundances—Mn ... 518
F ig u re A 2 .1 2 . The correlations between the diffuse feature abundances and
interstellar atomic abundances—F e ... 520
F ig u re A 2 .1 3 . The correlations between the diffuse feature abundances and
interstellar atomic abundances—Fe (limited s a m p l e ) ... 522
F ig u re A 2 .1 4 . The correlations between the diffuse feature abundances and
interstellar atomic abundances—Ti and C a l l ... 523
F ig u re A 2 .1 5 . The correlations between the diffuse feature abundances and
interstellar ionic abundances—C l, N a l and K I ... 524
F ig u re A 2 .1 6 . The correlations between the diffuse feature abundance ratios
and interstellar atomic abundances—Mg and Si ... 525
F ig u re A 2 .1 7 . The correlations between the diffuse feature abundance ratios
and interstellar atomic abundances—Mn... ... 526
F ig u re A 2 .1 8 . The correlations between the diffuse feature abundance ratios
and interstellar atomic abundances—F e ... 527
F ig u re A 2 .1 9 . The correlations between the diffuse feature abundance ratios
and interstellar ionic abundances— C l, N a l and K I ... 528
F ig u re A 2 .2 0 . The correlations of the diffuse feature abundances and
abundance ratios with the column density ratio log iV (N aI)/iV (CaII) . . . 529
F ig u re A 2 .2 1 . The correlations between interstellar molecular column
densities and E ( B — V ) ... 530
F ig u re A 2 .2 2 . The correlations between the diffuse feature column densities
and lo gN(H.2) ... 531
F ig u re A 2 .2 3 . The correlations between the diffuse feature column densities
and log iV(CH) and log J V ( C H + ) ... 532
F ig u re A 2 .2 4 . The correlations between the diffuse feature column densities
and logiV(CO) and log iV (C N ) ... 533
F ig u re A 2 .2 5 . The correlations between the diffuse feature abundances and
interstellar molecular abundances—H2... 534
F ig u re A 2 .2 6 . The correlations between the diffuse feature abundances and
Figures
F ig u re A 2.27. The correlations between the diffuse feature abundances and
interstellar molecular abundances— CO and CN ... 536
F ig u re A 2 .2 8 . The correlations between the diffuse feature abundances and
interstellar molecular abundances— CH+ ... 537
F ig u re A 2 .2 9 . The correlations between the diffuse feature abundances and
the column density ratios log iV(CH+ )/JV(CH) and log JV’(CH+ ) / <AT(H2) . . 538
F ig u re A 2 .3 0 . The correlations between the diffuse feature abundance ratios
and lo g / and A (C O ) ... 540
F ig u re A 2 .3 1 . The correlations between the diffuse feature abundance
ratios and A(CH), A(CN) and A(CH+ ) ... 541
F ig u re A 2 .3 2 . The correlations between the diffuse feature abundance ratios
C H A P T E R 1
In tro d u ctio n :
D iffu se C lou ds, D iffu se F eatu res
uThat Dust itself which is scattered so rare in Heaven .
C.S. Lewis, Voyage to Venus (Perelandra) (1943)
The diffuse interstellar features are a class of spectroscopic absorption lines which
are formed in the interstellar medium (ISM) and whose origin has defied explanation
since they were first observed in the early part of this century. The motivation for
their study has been the hope th at they may evidence an im portant ingredient of the
interstellar dust or gas th a t has hitherto remained unrecognised, or th a t they may be
diagnostic of physical conditions within the ISM.
This thesis describes a survey of some of the stronger diffuse features in the
yellow-red seen towards about 120 stars. A statistical analysis of the d ata obtained
has been used to examine the relationships between the hypothetical carriers of the
diffuse features and other constituents of the interstellar dust and gas; the prim ary
goal has been to constrain hypotheses of the nature of the carriers and to define the
physical conditions under which the formation of the diffuse features is efficient. In
this introduction, we will review the component phases of the ISM and in particular
the nature of the dust and gas in the diffuse interstellar medium. A short history
of the early observations and research of the diffuse features is followed by a fairly
comprehensive review of modern observations and hypotheses for their origin. A guide
Chapter 1
1.1 I n te r ste lla r clo u d s and p h ases
The interstellar medium is believed to exist in several discrete phases which are
characterised by very different temperatures and densities. These thermal phases in the
ISM are stable distributions of interstellar gas which coexist in approximate pressure
equilibrium w ith each other (e.g., see Shull 1987). Early models of the ISM (e.g.,
Field, Goldsmith & Habing 1969) included two phases: cold clouds (T ~ 100K) and
warm intercloud m atter (T ~ 104K). However, amongst other difficulties, such models
were not complete. The 1970’s saw the observation of a hot phase (T ~ 105-106K) of
the ISM and the construction of a model (McKee & Ostriker 1977) which comprised
three components: a hot, low-density medium which occupies most of the interstellar
volume and in which are embedded the cold, neutral clouds; and warm (T ~ 8000K)
photoionized envelopes which surround each cloud, the inner regions of which are
mostly neutral. Observationally, the existence of these phases seems certain, b u t their
topology is not well defined. We discuss each below in the light of observational
evidence on their physical state and distribution.
1.1.1 C old n e u tra l clouds.
At the distance of the Sun from the Galactic centre, about half of the mass of
the interstellar gas is in the cold clouds (Sanders et al. 1984), yet they fill only a few
percent of the interstellar volume. In fact, the cold neutral ISM is quite inhomogeneous
and is observed over a wide range of temperatures, densities and characteristic cloud
sizes. Broadly, we may classify the distribution of this material into diffuse clouds, dark
clouds and molecular clouds, although a continuum of cloud dimensions and opacities
may be more realistic.
Diffuse clouds are transparent to visible and ultraviolet (UV) radiation and are generally revealed by absorption and emission in the 21 cm line of atomic hydrogen,
or by discrete absorption components of atoms and simple molecules in the spectra of
background stars. The mean temperature of such clouds is about 80K, b u t can range
from about 40 to 130K (Savage et al. 1977); hydrogen densities in the range of a few
tens to a few hundred atoms cm-3 are typical. The statistics of diffuse clouds derived
Chapter 1
with the median diffuse cloud having a hydrogen column density N (H I)= 0.8 X 10²⁰
cm-2 and a reddening E (B — V ) = 0.017 mag; typically, about 6 such clouds might be
intersected by a line of sight of 1 kpc length, with higher column-density clouds being
encountered less frequently. The traditional concept of a spherical cloud is probably
mistaken (McCray & Snow 1979; Kulkarni & Heiles 1987): radio observations of H I
reveal many sheet-like and filamentary structures; and the thickness of diffuse clouds
suggested by optical and UV absorption line studies is typically 1-10 pc (Cowie &:
Songaila 1986), usually much smaller than their observed lateral extent (e.g., Sancisi
et al. 1974). Thus diffuse clouds are not self-gravitating and magnetic fields and shocks may play a significant role in controlling their structure.
Dark clouds are relatively opaque to visible and UV radiation and may be as
sociated in complexes up to about 20 pc across, like those in the region of Perseus
and Taurus (Myers 1987). Dark clouds are observed in molecular radio emission, and
are often seen optically as general patches of obscuration against a background of field
stars (e.g., Lynds 1962). The average density n (of hydrogen nuclei in all forms) in such
complexes is about 100—1000 cm-3 at a tem perature of about 10K (Goldsmith 1987).
W ithin such complexes exist very dense cores about 0.2pc across and in which n>, 104
cm- 3 . These dense condensations are often associated with low-mass star formation,
highlighted by concentrations of T-Tauri stars and very heavily obscured IR A S sources
(Myers 1987).
Giant molecular clouds contain a significant fraction of the total molecular mate rial in the ISM. These appear to be long-lived, gravitationally bound structures which
are not in pressure equilibrium with the other phases of the ISM. They are the sites for
massive OB star formation within the Galaxy; one of the most outstanding sites of OB
star formation local to the Sun—M42 in the Orion OBI association—is situated within
such a molecular cloud complex (Genzel & Stutzki 1989). Typically, the dimensions of
these massive clouds are about 40-100 pc with a mass of about 105-106Af® (Scoville
& Sanders 1987). Their average tem perature and density are about 10K and a few 100
cm- 3 , but within clumps or the molecular cloud core these can rise to T ~ 100K and
Chapter 1
1.1.2 T h e w arm in terclo u d m edium .
The warm intercloud medium is very difficult to observe directly (Kulkarni &:
Heiles 1987). The warm neutral component is visible in 21 cm emission as a broad
shallow feature on which is superposed the emission from the cold H I clouds (e.g.,
Radhakrishnan et al. 1972); an ionized component of the warm medium is required
to explain widespread diffuse H a emission and to account for the interstellar elec
trons revealed by observations of the dispersion of pulsar signals. Various observations
suggest th a t the tem perature of the warm medium is about 8000K; th e density is prob
ably about 0.3 cm- 3 . The photoionization of the warm ionized medium is probably
m aintained by hot OB stars, planetary nebula nuclei and other sources of UV photons.
The warm component probably fills a greater volume of the interstellar medium
th an the McKee-Ostriker model assumes, possibly >,50% (Kulkarni & Heiles 1987). In
our p art of the Galactic disk, the warm neutral medium seems to account for about 40%
of the interstellar hydrogen and the ionized component about 10%. The topology of
the warm intercloud medium is quite uncertain: whether it forms an envelope around
some of the cold neutral clouds, as in the McKee-Ostriker model, or whether it is
distributed more like a pervasive substrate is unknown.
1.1.3 T h e h o t com ponent.
It was first postulated by Spitzer (1956) th a t the existence of hot “coronal” gas
in the ISM was necessary to confine clouds of neutral gas which were observed at
large distances above the galactic plane. The detection of such a phase was made via
observations of O VI (Rogerson et al. 1973) and soft X-ray emission (Williamson et al.
1974). The O V I observations imply T ~ 1-3 X 10⁵K; the X-ray emission implies a
tem perature of 1-2 X l06K. However, these observations sample different volumes of
space: the diffuse X-rays observed in the Galactic plane must originate w ithin a few
hundred parsecs of the Sun (Savage 1987)—indeed, our Sun appears to be contained
within the hot bubble of a supernova remnant with a radius of about 100 pc (e.g.,
see Cox & Reynolds 1987); but the Os+ column density is well correlated w ith path-
length to about 3.2 kpc (Jenkins 1978a, 6), which indicates th a t it is well distributed
Chapter 1
Other highly ionized species such as C3+, Si3+ and N4+ have also been observed
(Savage & Massa 1987). The hot gas is probably heated by high velocity shocks
produced by supernova explosions and winds from OB associations. Indeed, if the
supernova rate were high enough, much of the Galactic volume may be filled with a
tunnel network of hot gas due to overlapping supernova remnants (Cox & Sm ith 1974).
However, the observed velocity dispersion of the O VI components is not large, and it
has been suggested th at the 05+ is actually produced in conductive transition regions
between the cooler medium and the hot gas (McKee & Ostriker 1977; Cowie et al.
1979).
1.2 D u s t an d gas in th e d iffu se in te r ste lla r m ed iu m
It will be worthwhile to take a closer look at the nature of the dust and gas in
the diffuse interstellar medium. A num ber of hypotheses of the origin of the diffuse
features proposed in recent years have been based on the belief th a t they are closely
associated with the dust grains, perhaps for w ant of a suitable gas-phase carrier. A
measure of the consensus of th at view is probably provided by the appearance of the
diffuse features as a topic in a recent Symposium on interstellar dust (Allamandola &
Tielens 1989). The justification for this view will be questioned more closely in this
thesis; nevertheless, the following review will emphasise the nature and composition,
formation and destruction of diffuse medium dust in particular.
1.2.1 G as in th e diffuse m edium .
Much of what we know about the diffuse medium comes from the observation of
interstellar absorption lines. Since essentially all species are in their ground electronic
states, most absorption lines fall in the ultraviolet part of the spectrum, which is
therefore particularly useful for studying the interstellar gets (Spitzer & Jenkins 1975;
Cowie & Songaila 1986). From such observations we may determine the abundance
and excitation of such species as H2, C° and C+ , which are powerful diagnostics of the
Chapter 1
In addition, much of our understanding of grain growth and destruction has come from
observations of elemental abundances in different interstellar environments.
The gas in the diffuse medium is composed primarily of neutral atomic hydrogen.
In addition to the atoms and ions of heavier elements, simple molecules are also known
to exist. Neglecting the effects of charge exchange and ion-molecule reactions, those
atoms which can be ionized by photons longward of the Lyman limit exist in a state
of ionization equilibrium which is determined by the intensity and energy distribution
of the radiation field and the electron density and tem perature. In general, a large
proportion of most elements with ionization potentials below 13.6 eV exist as ions, e.g.,
Fe+ and Ca+ or Ca2+. Infrared emission in the fine-structure excitation lines of atoms
and ions (e.g., C II A158/im ) dominates the cooling of the diffuse medium (Dalgarno
& McCray 1972) and permits a stable thermal phase to exist.
The existence of grains in the diffuse medium is pivotal for the existence of observ
able concentrations of molecules: firstly, the grains provide some shielding in diffuse
clouds against photodissociation by UV photons; b u t more im portantly, the grain sur
faces are the sites for the efficient formation of H2(e.g., Shull & Beckwith 1982)—and
H2 is the key to the whole of interstellar chemistry, which can then proceed by fast
ia.
ion-molecule reactions to syjthesise a variety of molecular species. The molecules which
have been observed in the diffuse medium in addition to H2 are HD (e.g., Wright &
Morton 1979), CO, CH, CH+ , CN (e.g., Dickman et al. 1983 and references therein),
C2 (van Dishoeck 1984), OH (e.g., Chaffee & Lutz 1977) and the isotopic forms of
some of these.
Steady state models of diffuse interstellar clouds (e.g., van Dishoeck &: Black 1986)
have been fairly successful in accounting for the observed abundances and excitation
of many of these molecules according to presently understood reaction networks. One
most notable exception is CH+ (Dalgarno 1976). It has been necessary to invoke models
of the chemistry in magnetohydrodynamic shocks in order to predict abundances of
CH+ which are close to observed values (Pineau des Forets et al. 1986; Draine &
Katz 19866). Reactions on grain surfaces probably contribute significantly to the
chemistry in the diffuse medium; but excepting the case of H2, the accuracy of current
observations is not sufficient to discriminate between models which do or do not include