VALIDATED METHOD DEVELOPMENT FOR THE
QUANTIFICATION OF CINITAPRIDE AND
PANTOPRAZOLE BY SPECTROPHOTOMETRY
AND RP-HPLC IN BULK AND ORAL DOSGE FORM
A dissertation submitted to
The Tamilnadu Dr. M.G.R. Medical University
Chennai – 600 032.
In partial fulfillment of the requirements
for the award of the degree of
MASTER OF PHARMACY
IN
PHARMACEUTICAL CHEMISTRY
Submitted by
Reg. No. 26108332
DEPARTMENT OF PHARMACEUTICAL CHEMISTRY COLLEGE OF PHARMACY
MADRAS MEDICAL COLLEGE CHENNAI – 600 003
CERTIFICATE
This is to certify that the dissertation entitled “VALIDATED METHOD
DEVELOPMENT FOR THE QUANTIFICATION OF CINITAPRIDE AND PANTOPRAZOLE BY SPECTROPHOTOMETRY AND RP-HPLC IN BULK AND ORAL DOSGE FORM’’ submitted by
Reg. No. 26108332
in partialfulfillment of the requirements for the award of the degree of MASTER OF
PHARMACY in PHARMACEUTICAL CHEMISTRY by The Tamilnadu Dr.M.G.R. Medical Univeristy is a bonafide work done by her during the academic year 2011-2012 at the Department of Pharmaceutical Chemistry, College of
Pharmacy, Madras Medical College, Chennai – 600 003.
Dr. A. JERAD SURESH, M.Pharm., Ph.D.,
Principal, College of Pharmacy, Professor & HOD
Dept. of Pharmaceutical Chemistry College of Pharmacy
CERTIFICATE
This is to certify that the dissertation entitled “VALIDATED METHOD
DEVELOPMENT FOR THE QUANTIFICATION OF CINITAPRIDE AND PANTOPRAZOLE BY SPECTROPHOTOMETRY AND RP-HPLC IN BULK
AND ORAL DOSGE FORM’’ submitted by
Reg. No. 26108332
in partial fulfillment of the requirements for the award of the degree of MASTER OF
PHARMACY in PHARMACEUTICAL CHEMISTRY by The Tamilnadu Dr. M.G.R. Medical University is a bonafide work done by her during the academic year 2011- 2012 under my guidance.
Dr. (Mrs.) V. NIRAIMATHI, M.Pharm., Ph.D.,
Project Advisor,
Dept. of Pharmaceutical Chemistry, College of Pharmacy,
Madras Medical College,
ACKNOWLEDGEMENTS
I, first and foremost express my revered regard and obeisance to the ALMIGHTY GOD
with whose blessings I was able to complete my project work.
I am grateful to express my sincere thanks to Dr. KANAGASABAI, M.D., Dean,
Madras Medical College, for giving an opportunity to carry out my project work.
It is my privilege to express a deep and heartfelt sense of gratitude and honorable regards
to our respected, Dr. A. JERAD SURESH, M.PHARM., Ph.D., Principal, College of
Pharmacy and Professor and Head, Department of Pharmaceutical Chemistry for his whole hearted support in rendering me all the facilities required for my project work.
It is my utmost duty and privilege to express my heartfelt gratitude and sincere thanks to
Dr. (MRS.) V. NIRAIMATHI, M.Pharm., Ph.D., Assistant Reader in Pharmacy, Department of Pharmaceutical Chemistry, for her active guidance, advise, help, support and encouragement. I am very much obliged for her perseverance, without which my project work would not have been completed.
I thank Mrs. P.G.Sunitha, M.Pharm., Mrs. T.Saraswathi, M.Pharm., Mrs.
R.Priyadarshini, M.Pharm., Mr. M.Satish, M.Pharm., Tutors in Pharmacy, Department of Pharmaceutical Chemistry for their kind help.
I thank Mr. D.Siva Kumar, Mr. Baskaran and Mrs.R.Usha, lab supervisors,
I also thank Mrs. Maheshwari, Mrs. V. Booma and Mrs. Murugeshwari, lab technicians, Department of Pharmaceutical Chemistry for their kind help.
I express my special thanks to my ever loving friends Mrs. D. Priya and Miss. A.
Kalaimagal for their constant motivation and help. I also thank all other friends and the juniors of my department.
Last but not the least, I would like to express my heartfelt thanks to my mother, my
CONTENTS
S.No.
TITLE
Page No.
1. INTRODUCTION 1
2. DRUG PROFILE 18
3. REVIEW OF LITERATURE 24
4. AIM AND OBJECTIVE OF THE STUDY 34 5. MATERIALS AND METHODS
I. UV-SPECTROPHOTOMETRY
Standard absorbance method Area Under Curve
Derivative Spectrophotometry
II. VISIBLE SPECTROPHOTOMETRY Colorimetry
Diazotisation and coupling with EAA Diazotisation and coupling with AAC
Colorimetry
Oxidation and complexation with 1,10- Phenanthroline Oxidation and complexation with ammonium thiocyanate
III. HIGH PERFORMANCE LIQUID CHROMATOGRAPHY
36 38 44 45 45
47 48
51 52
60
6. RESULTS AND DISCUSSION 66
7. SUMMARY & CONCLUSION 123
LIST OF ABBREVIATIONS
S.No
ABBREVIATION
EXPANSION
1. CNP Cinitapride
2. PNP Pantoprazole
3. Avg. Average
4. LOD Limit of Detection
5. LOQ Limit of Quantification
6. µg Microgram
7. mg Milligram
8. mL Millilitre
9. R.S.D Relative standard deviation
10. Rt Retention time
11. Std. Standard
12. SD Standard deviation
13. UV Ultra-Violet Spectroscopy
14. Wt. Weight
15. HPLC High Performance Liquid Chromatography
16. RP-HPLC Reverse phase High Performance Liquid
Chromatography
17. AAC Acetyl acetone
18. EAA Ethyl acetoacetate
19. ATC Ammonium thiocyanate
20. Abs Absorbance
21. Conc. Concentration
Department of Pharmaceutical Chemistry Page 1
INTRODUCTION
Analytical chemistry is the branch of chemical science which deals with the
identification of components of a mixture by separating them and then analyzing
how much percentage of each component is present in the mixture, in other words, it
is a branch of chemistry dealing with any type of technique which may yield any sort
of information about a chemical system occurring in nature or of artificial or
synthetic origin.
Analytical chemistry involves two basic or major divisions.
I. Qualitative analysis:
It involves the establishment of chemical composition of a material of natural
or synthetic origin i.e., it deals with the identification of atoms, ions and
molecules that make the material being analyzed. Two essential requirement
of a qualitative analytical method are
Specificity
Ability to detect the presence of an unknown element in the presence of other
elements. Example: iron in presence of nickel, manganese, chromium etc.
Sensitivity
Smallest quantity of the element that can be detected by the given method. It
is expressed in magnitudes of the order of 1mgm (one millionth part of a
Department of Pharmaceutical Chemistry Page 2
II. Quantitative analysis
It involves the estimation or determination of the amount of element on
molecule qualitatively detected present in the compound being analyzed. In
addition to specificity and sensitivity quantitative analysis is characterized by
accuracy.
Significance of Analytical Chemistry
The identification of gases which was once considered as a single substance was of great significance in chemical analysis.
The chemical composition of a matter is determined.
Structure elucidation of a compound is possible.
Helps to analyze which component of a mixture or which part of the chemical
structure was responsible for the reaction
Significance of Pharmaceutical analysis
Structure elucidation of newly synthesized drug or isolated from natural origin.
Provides information on the identity, purity, content and stability of starting materials, excipients and active pharmaceutical ingredients. (Pharmaceutical
analysis – Metrohm 2009)
Pharmacokinetic studies of drugs become easier
Studies involving metabolites of the drugs was possible
Impurity profiling of the drug
Department of Pharmaceutical Chemistry Page 3
Chiral separation of enantiomers and analyzing which enantiomer is
responsible for the bio activity
Bio analytical studies became simpler and easy to perform by the emergence
of hyphenated analytical techniques
To check the purity of the raw material thus making cost effective synthesis of drugs.
Structure elucidation of proteins and creation of protein data bank. In medicine, analytical chemistry is the basis for clinical laboratory tests which
help physicians diagnose disease and chart progress in recovery.
In Industry, analytical chemistry provides the means of testing raw materials and for assuring the quality of finished products whose chemical composition
is critical.
Environmental quality is often evaluated by testing for suspected
contaminants using the techniques of analytical chemistry (Anonymous
www.acs-analytical.duq.edu/whatisanalyticalchem.html)
The recent developments of computer automation and information
technologies have innervated analytical chemistry to initiate a number of new
biological fields. For example, automated DNA sequencing machines were
the basis to complete human genome projects leading to the birth of
genomics. Protein identification and peptide sequencing by mass
spectrometry opened a new field of proteomics.
Analytical chemistry plays important role in quality control and quality
Department of Pharmaceutical Chemistry Page 4 good acceptable quality (quality assurance) and to control the quality of the analyte
up to the standard so that the raw material could be further taken in to the
manufaturing process and the finished product could be let in to the market.
Quality assurance is a wide-ranging concept covering all matters that individually or
collectively influence the quality of a product. It is the totality of the arrangements
made with the object of ensuring that pharmaceutical products are of the quality
required for their intended use. Quality assurance therefore incorporates GMP
Quality control, commonly shortened to QC refers to all those processes and
procedures designed to ensure that the results of laboratory analysis are consistent,
comparable, and accurate and within specified limits of precision.
Methods of analytical chemistry
The compound of interest is separated by precipitation or extraction or
distillation. Further they are subjected to qualitative or quantitative analysis.
Qualitative analysis
Separated components treated with reagents that yield product that could be
recognized by color, boiling point, melting point, solubility in a series of
solvents, odour, optical activity and refractive index.
Quantitative analysis
Department of Pharmaceutical Chemistry Page 5
Quantitative Analytical Techniques involve the following techniques (Willard, et
al. 1986; Douglas, A. Skoog, et al.,2004; P.D.Sethi, 2001)
The different classical methods are
Titrimetric methods: The volume of a solution containing sufficient reagent to react completely with the analyte is measured. It include acid – base,
precipitation, redox, complexometric, diazotisation, aqueous and non
aqueous titrations which involve either direct and indirect (back titration)
methods
Gravimetric methods determine the mass of the analyte or some compound chemically related to it by weighing mass of the analyte after extraction,
derivative separation, residue after ignition.
Instrumental Methods
Spectrophotometric methods are based on measurement of the interaction between electromagnetic radiation and analyte. It includes UV-Visible, Infra
red, Raman, Mass, Nuclear magnetic resonance(NMR), fluorimetry, flame
photometry, nephelo- turbidimetry.
Electro analytical methods involve the measurement of electrical properties such as voltage, current, resistance etc. It include potentiometry,
conductometry, amperometry, electrogravimetry etc
Separation methods all types of chromatography like thin layer, paper, column, gas, High Performance Liquid and High Performance Thin Layer
Department of Pharmaceutical Chemistry Page 6
Miscellaneous methods include
thermal analysis(based on heat of reaction), kinetic techniques
(based on the kinetics of reactions of the analyte), enzyme assay
Hyphenated techniques includes the combination of the above discussed methods like GC-MS (Gas chromatography – Mass spectrometry), LC-MS
(Liquid chromatography – Mass spectrometry), GC-IR (Gas
chromatography – Infrared spectroscopy), ICP-MS (Inductively coupled
plasma–Mass spectrometry), LC-DAD-MS (Liquid chromatography –
Diode Array Detector – Mass spectrometry), LC-MS-MS (Liquid
chromatography – Mass spectrometry – Mass spectrometry).
AnalyticalMethod Validation (Code Q2A- ICH Guidelines IP, 1996)
Method validation is the process to confirm that the analytical procedure
employed for a specific test is suitable for its intended use. For pharmaceutical
analytical methods guidelines from the United States Pharmacopeia (USP)
International Conference on Harmonization (ICH), and Food and Drug
Administration (FDA) provide a frame work for performing such validations.
Types of Validation (Sethi, 2008)
Prospective validation
This is employed when historical data of the productis not available. Such
validation is conducted prior torelease of eithr new product or product made
under revised / new manufacturing process where revision may affect the
Department of Pharmaceutical Chemistry Page 7
Retrospective validation
This provides a review and evaluation of existing information for comparison
when historical data is sufficient and readily available. Retrospective
validation is acceptable only when specific test results generated by reliable
analytical method on number of samples are available to allow statistical
analysis.
Concurrent validation
This verifies the quality characteristics s of a particular batch and provides
assurance that the same quality would be attained again when subsequent
batches are manufactured and analyzed under similar conditions
Reasons for Validation
• Enables scientiststo evaluate procedures for checking complaints and taking
remedial measures.
• To provide high degree of confidence that the same level of quality is
consistently built in each unit of finished product from batch to batch.
• To take appropriate action, in case of non-compliance.
• Closer interaction with pharmacopoeial harmonization particularly with
respect to determination of imprities and their limits.
Methods need to be validated or revalidated:
Department of Pharmaceutical Chemistry Page 8
Whenever the conditions change for which the method has been validated. e.g., instruments with different characteristics.
Whenever the method is changed, and the change is outside the original scope
of the method, the International Conference on Harmonization (ICH) of
Technical Requirements for the Registration of Pharmaceuticals for human
use has developed a consensus text on the validation of analytical procedures.
The document includes definitions for eight validation characteristics which
includes.
Linearity
Specificity
Accuracy
Precision
Repeatability
Intermediate precision
Reproducibility
Limit of detection
Limit of quantification
Range
Ruggedness
Department of Pharmaceutical Chemistry Page 9
Linearity
The linearity of an analytical method is its ability to elicit test results that are
directly proportional to the concentration of analytes in samples. Acceptability of
linearity data is judged by the correlation coefficient and intercept of the linear
regression line for the response versus concentration plot. The range of correlation
coefficient should be NLT -1 and NMT +1.
Specificity
It is the ability of the method to accurately measure the analyte response in the
presence of all sample components like placebo formulation, synthesis intermediates,
excipients, degradation products, process impurities etc., in comparison with the
response of the standard analyte (or only the analyte).
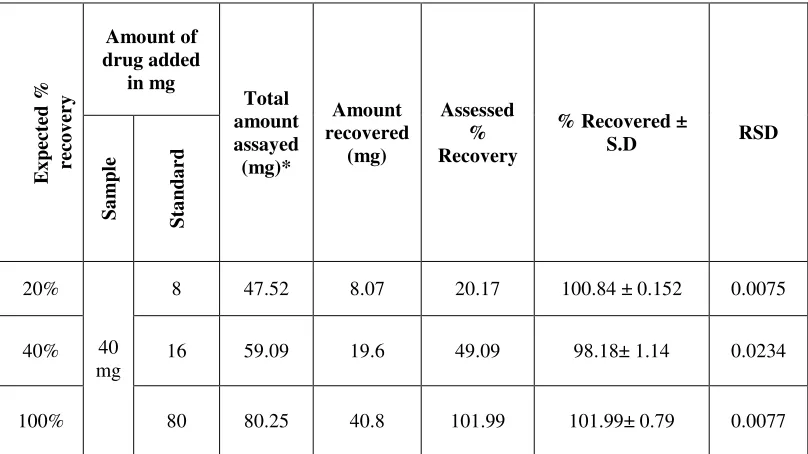
Accuracy
The accuracy of an analytical method is the extent to which test results
generated by the method and the true value agree. Accuracy of the method is the
closeness of the measured value to the true value.
Accuracy is calculated as the percentage of recovery by the assay of the
known added amount of standard analyte in the previously analyzed sample (spiked
sample), or as the difference between the mean and the accepted true value, together
with confidence interval. Accuracy is usually performed in triplicate at three levels
over a range of 50 to 150% of the target concentration.(Analytical chemistry 1996)
Department of Pharmaceutical Chemistry Page 10
Precision
It may be measure of either the degree of reproducibility, intermediate
precision or repeatability of the analytical method under normal operating
conditions. It is usually expressed as SD (Co-efficient of variation) of a series of
measurements.
Repeatability (intraday precision) refers to the use of analytical procedure
within the laboratory over a short period of time using the same analyst with same
instrument.
Reproducibility refers to the use of analytical procedure in different
laboratories as in a collaborative study.
Detection Limit (LOD)
It is the lowest amount of analyte in the sample that produces a response
detectable above the noise level of the system, but not necessarily quantified as an
exact value. Based on the standard deviation of the response and the slope the
detection limit (LOD) may be expressed as
3.3
Where,
σ - standard deviation of the response,
Department of Pharmaceutical Chemistry Page 11
Quantitation Limit (LOQ)
It is the lowest amount of analyte in the sample that can be determined with
acceptable precision and accuracy under the stated experimental conditions. If not
determined experimentally it can be calculated as the analyte concentration that gives
S/N= 10 (Signal to Noise ratio). The quantitation limit is expressed as the
concentration of analyte (eg : percentage parts per million) of the sample.
10
Where, σ - standard deviation of the response,
S – Slope of the calibration curve (of the analyte)
Range
Range of a method is the interval between the upper and the lower levels of
analyte (including these concentrations) that have been demonstrated to be
determined within a suitable level of precision, accuracy and linearity.
Sensitivity
The sensitivity of an analytical method is the capability of the method to
discriminate small differences in concentration or mass of the test analyte. In
practical terms, sensitivity is the slope of the calibration curve that is obtained by
Department of Pharmaceutical Chemistry Page 12
Ruggedness
Ruggedness is a measure of reproducibility of test results under normal,
expected operational conditions from laboratory to laboratory and from analyst to
analyst. Ruggedness is determined by the analysis of aliquots from homogeneous
lots in different laboratories.
Robustness
Robustness tests examine the effect that operational parameters have on the
analysis results. For the determination of a method’s robustness, a number of method
parameters, for example, pH, flow rate, column temperature, injection volume,
detection wavelength or mobile phase composition, are varied within a realistic
range, and the quantitative influence of the variables is determined. If the influence
of the parameter is within a previously specified tolerance, the parameter is said to be
within the method’s robustness range.
System suitability parameters for HPLC analysis:
The purpose of the system suitability test is to ensure that the complete testing
system (including instrument, reagents, columns, analysts) is suitable for the
intended application. System suitability tests are an integral part of gas and liquid
chromatographic methods. They are used to verify that the resolution and
reproducibility of the chromatographic system are adequate for the analysis to be
Department of Pharmaceutical Chemistry Page 13 chromatographic methods. In the current FDA guideline on “Validation of
Chromatographic methods” the following acceptance limits are proposed as initial
criteria.
Capacity Factor (k')
It is the measure of a sample peak in the chromatogram being specific for a
given compound, a parameter which specifies the delay of a substance to be
separated.
′
Where,
tr = retention time from time of injection to time of elution of peak maximum.
to = void volume
Resolution (Rs)
The resolution Rs is a function of column efficiency N and is specified to
ensure that closely eluting compounds are resolved from each other to establish the
general resolving power of the system and to ensure that internal standards are
resolved from the drug.
2 1
2
1
)
(
2
W
W
t
t
R
+
−
=
Department of Pharmaceutical Chemistry Page 14 Where,
t1 and t2 = retention times of first and second adjacent bands.
W1 and W2 = width of peak
Limit = Rs of >2 between the peak of interest and the closest potential interfering
peak is desirable.
Tailing Factor (T)
The tailing factor T, a measure of peak symmetry, is unity for perfectly
symmetrical peaks and its value increases as tailing becomes more pronounced.In
some cases, values less than unity may be observed. As peak asymmetry increases,
integration, and hence precision becomes less reliable.
.
Where,
W0.05 = width of peak at 5% height
f = Distance from the peak maximum to the leading edge of the peak, the distance
being measured at a point 5% of the peak height from the baseline.
Limit: ≤ 2 is preferable.
Theoretical plates (N)
The number of theoretical plates, N is a measure of column efficiency. For
Gaussian peaks, it is calculated by the equations.
Department of Pharmaceutical Chemistry Page 15 Where,
t = retention time of substance.
w = width of the peak at its base, obtained by extrapolating the relatively straight
sides of the peak to the baseline.
w1/2 = width of the peak at half height, obtained directly by electronic integrators.
The value of ‘N’ depends upon the substance being chromatographed as well as the
operating conditions such as mobile phase, temperature etc.
The limits of system suitability are tabulated below (system stablility -online):
STATISTICS IN ANALYTICAL CHEMISTRY
It is the science of making effective use of numerical data relating to groups of
individuals or experiments. It is the quantitative science, meaning that desired result
is almost always numeric.
S.No System suitability
parameters Limits
1. Capacity factor k’>2
2. Injection Precision RSD<1%
for n > 5
3. Resolution Rs>2
4. Tailing factor T<2
Department of Pharmaceutical Chemistry Page 16 Quantitative results are obtained using devices or instruments that allow us to
determine the concentration of a chemical in a sample from observable signal. One
of the use of statistics in analytical chemistry is to provide an estimate of the likely
value of that error, in otherwords, to establish the uncertainty associated with the
measurement.
STATISTICAL PARAMETERS
The precision or reproducibility of the analytical method was
determined by repeating the analysis and the following statistical parameters
were calculated.
Mean
The Mean or average is obtained by dividing the sum of observed
values by the number of observations (n).
n
X x=
∑
Standard Deviation
Standard deviation (SD) is measure of data dispersion or variability.
The standard deviation gives an idea of how close the entire set of data is to
the average value. SD is also called root mean square deviation.
∑
− −= (X X)2/ n 1
Department of Pharmaceutical Chemistry Page 17
Relative Standard Deviation
The relative standard deviation (RSD) is also called co-efficient of
variation. It is defined as
X SD RSD= /
100
% = ×
X SD RSD
Regression Equation
A regression is a statistical analysis assessing the association between
two variables. It is used to find the relationship between two variables.
Regression equation y = mx + c
Where,
m – the slope of regression line;
c– the intercept point of regression line and the y axis
Standard Error
Standard error is a statistical term that measures the accuracy with which a
sample represents a population. In statistics, a samplemean deviates from the
actual mean of a population; this deviation is the standard error. Standard
error (SE) is given by
n
Department of Pharmaceutical Chemistry
I. CINITAPRIDE ( O’ Neil MJ
Cinitapride is available in the form of cinitapr
is a new gastro prokinetic agent. It is a substituted benzamide with 5
antagonist and agonist activity. It is chemically described as 4
cyclohexen-1-ylmethyl)
tartarate.
EMPIRICAL FORMULA
MOLECULAR WEIGHT
STRUCTURE
DESCRIPTION
The tartarate salt of cinitapride is almost lemon yellow crystalline powder.It
is freely soluble in methanol, soluble in water, ethanol, parti
insoluble in carbon tetra chloride, chloroform.
Department of Pharmaceutical Chemistry
DRUG PROFILE
( O’ Neil MJ., 2007; S. C. Sweetman 2002 )
is available in the form of cinitapride hydrogen tart
is a new gastro prokinetic agent. It is a substituted benzamide with 5
antagonist and agonist activity. It is chemically described as 4
ylmethyl)-4-piperidinyl]-2-ethoxy-5-nitrobenzamide hydrogen L
FORMULA : C25H36N40O10
MOLECULAR WEIGHT : 552.58.
Cinitapride
The tartarate salt of cinitapride is almost lemon yellow crystalline powder.It
is freely soluble in methanol, soluble in water, ethanol, partially soluble in acetone,
insoluble in carbon tetra chloride, chloroform.
Page 18 hydrogen tartarate which
is a new gastro prokinetic agent. It is a substituted benzamide with 5-HT receptor
antagonist and agonist activity. It is chemically described as
4-Amino-N-[1-(3-nitrobenzamide hydrogen
L-(+)-The tartarate salt of cinitapride is almost lemon yellow crystalline powder.It
Department of Pharmaceutical Chemistry Page 19
SOLUBILITY
Cinitaprde hydrogen tartarate is freely soluble in methanol, Ethanol,
acetonitrile; soluble in water, 0.1N hydrochloric acid and in chloroform, practically
insoluble acetone, ether and precipitates in 0.1N sodium hydroxide.
MECHANISM OF ACTION
Cinitapride is a substituted benzamide gastroenteric prokinetic agent acting
via complex, but synergistic effects on serotonergic 5-HT2 (inhibition) and 5-HT4
(stimulation) receptor and dopaminergic D2 (inhibition) receptors in the neuronal
synapses of the m yenteric plexus
INDICATIONS AND USAGE
Cinitapride is indicated for the treatment of gastrointestinal disorders
associated with motility disturbances such as gastro esophageal reflux disease,
non-ulcer dyspepsia and delayed gastric emptying.
DOSAGE AND ADMINISTRATION
The usual daily dosage for adults is 1mg of Cinitapride orally thrice a day 15
minutes before meals. The dose may be reduced, if required, depending on the
patient’s age and symptoms at the discretion of the physician.
PHARMACOKINETICS
Pharmacokinetic studies in man following oral and intramuscular
Department of Pharmaceutical Chemistry Page 20 dose due to the absence of a sufficiently sensitive analytical method for the detection
of plasma concentrations following very low doses of cinitapride. The absorption of
cinitapride (12mg) following oral administration was rapid, with peak levels being
achieved 2 h after dosing; absorption following intramuscular administration (4mg)
was even more rapid, with peak levels (50% more that oral levels) being achieved 1
h after dosing.
CONTRAINDICATIONS
Cinitapride is contraindicated in patients with known hypersensitivity to
cinitapride or any of the other constituents of the formulation.
DRUG INTERACTIONS
Anticholinergic agents like atropine, scopolamine etc, may reduce the action
of cinitapride. Cinitapride can enhance the effect of medicines that are used for the
treatment of illnesses of the nervous system and for insomnia. Cinitapride can also
alter the absorption of some medicines e.g. digoxin as it simulates gastric emptying.
UNDESIRABLE EFFECTS
Cinitapride has usually been very well tolerated with the most common
adverse events in clinical trials being drowsiness and diaorrhea. Extrapyramidal
effects (involuntary muscular movements of the head, neck and tongue) have been
reported occasionally. Very rarely, cutaneous reactions like eruptions, itching or
Department of Pharmaceutical Chemistry Page 21
OVERDOSAGE
The symptoms of overdose include drowsiness, confusion and extrapyramidal
effects. Cinitapride does not cause QT prolongation. In case of excessive
overdosage, the usual measures of gastric lavage and symptomatic therapy should be
applied. The extrapyramidal effects should be treated with antiparkinsonians,
anticholinergics or antihistaminics with anticholinergic properties.
II. PANTOPRAZOLE SODIUM SESQUIHYDRATE (www.drugbank)
Pantoprazole is an irreversible proton pump inhibitor drug used for short-term
treatment of erosion and ulceration of the esophagus caused by gastro esophageal
reflux disease. .Like other drugs of its class, reduces gastric acid secretion by
inhibition of portion on the parietal cells. Pantoprazole inhibits H+/K+ ATPase pump
function thereby reducing gastric acid secretion. It also has a role in the eradication
of H.pylori. Chemically, pantoprazole is
6-(difluoromethoxy)-2-{[(3,4-dimethoxypyridin-2-yl)methane]sulfinyl}-1H-1,3-benzodiazole
EMPIRICAL FORMULA:
Pantoprazole free base : C16 H15 F2 N3 O4 S
Pantoprazole sodium sesquihydrate : C16 H14 F2 N3 O4 SNa. 1.5 H2O
MOLECULAR WEIGHT:
Pantoprazole free base : 383.37 g/mol
Department of Pharmaceutical Chemistry
STRUCTURE
Pantoprazole sodium sesquihydrate
DESCRIPTION:
The sodium salt of pantoprazole is almost white to off
powder.It is freely soluble in methanol, soluble in water, ethanol, partially soluble in
acetone, insoluble in carbon tetra chloride, chloroform. Because of gradual
degradation of pantoprazole sodium during heating, the melting point cannot be
determined
MECHANISM OF ACTION
Pantoprazole is a proton pump inhibitor (PPI) that suppresses the final step in
gastric acid production by forming a covalent bond to two sites of the (H+, K+)
ATPase enzyme system at the secretory surface of the
effect is dose-related and leads to inhibition of both basal and stimulated gastric acid
secretion irrespective of the stimulus. The binding to the (H+, K+)
a duration of antisecretory effect that persists long
Department of Pharmaceutical Chemistry
Pantoprazole sodium sesquihydrate
The sodium salt of pantoprazole is almost white to off-white, crystalline
It is freely soluble in methanol, soluble in water, ethanol, partially soluble in
acetone, insoluble in carbon tetra chloride, chloroform. Because of gradual
degradation of pantoprazole sodium during heating, the melting point cannot be
M OF ACTION
Pantoprazole is a proton pump inhibitor (PPI) that suppresses the final step in
gastric acid production by forming a covalent bond to two sites of the (H+, K+)
ATPase enzyme system at the secretory surface of the gastric parietal cell. This
related and leads to inhibition of both basal and stimulated gastric acid
secretion irrespective of the stimulus. The binding to the (H+, K+)-ATPase results in
a duration of antisecretory effect that persists longer than 24 hours.
Page 22 white, crystalline
It is freely soluble in methanol, soluble in water, ethanol, partially soluble in
acetone, insoluble in carbon tetra chloride, chloroform. Because of gradual
degradation of pantoprazole sodium during heating, the melting point cannot be
Pantoprazole is a proton pump inhibitor (PPI) that suppresses the final step in
gastric acid production by forming a covalent bond to two sites of the (H+,
K+)-gastric parietal cell. This
related and leads to inhibition of both basal and stimulated gastric acid
Department of Pharmaceutical Chemistry Page 23
PHARMACOKINETICS (Radhofer-Welte S.,1999)
Absorption : Well absorbed; peak plasma concentrations: Approx 2-3 hr
Oral bioavailability : Approx 77% with enteric-coated formulation (does not vary
after single or multiple doses).
Distribution : Protein-binding: 98%; volume of distribution: 11-24L.
Metabolism : Hepatic; mainly by cytochrome CYP2C19 and slightly by
CYP2D6 and CYP2C0.
INDICATIONS
Pantoprazole used for short-term treatment of erosion and ulceration of the
esophagus caused by gastro- esophageal reflux disease. It is the drug of choice for
the initial treatment of H.pylori along with other drugs.
DRUG INTERACTIONS
Pantoprazole shows interactions: Indinavir, Enoxacin, Clopidogrel,
Ketoconazole, Topotecan, Cefditoren, Itraconazole, Dasatinib.
FOOD INTERACTIONS : Take without regard to meal
Department of Pharmaceutical Chemistry Page 24
REVIEW OF LITERATURE
A review of literature was done for the past fifteen years to enumerate various
methods available for the analysis of cinitapride and pantoprazole. In view of the
literature cited for the quantification of cinitapride and pantoprazole in
pharmaceutical dosage forms, there is no documentary evidence available.
Pantoprazole and Cinitapride in combined dosage form
Patel G.H., et al., (2011) developed HPTLC method for the estimation of
pantoprazole and cinitapride in combined dosage forms. Chromatographic separation
of the drugs was performed on aluminium plates precoated with silica gel 60 F254 as
the stationary phase and the solvent system consisted of ethyl acetate: methanol 9:
1(v/v). Densitometric evaluation of the separated zones was performed at 278 nm.
Paresh U. Patel., et al., (2011) developed first derivative spectrophotometric
analytical method for the simultaneous estimation of pantoprazole and cinitapride in
combined dosage form. The drugs obeyed the Beer’s law in the concentration range
of 1-26 ug/mL. Zero crossing point of cinitapride was found to be 302 nm and zero
crossing Point of Pantoprazole was 249 nm.
CINITAPRIDE
Alarcon de Lastra C., et al., (1998) studied the effects of cinitapride on gastric
ulceration and secretion in rats. The study demonstrated a gastro protective nature of
cinitapride not only through reduction of neutrophil toxicity but by an increased
Department of Pharmaceutical Chemistry Page 25 showed seratonergic dependent mechanism are also involved by 5-HT2 blockade and
5-HT1 receptor activation .
González Marti I., et al., (1998) determined cinitapride by differential pulse
polarography and adsorptive stripping voltammetry (ASV) in Britton–Robinson
buffer, with 3s detection limits of 1.3×10⁻⁸ and 8.4×10⁻¹⁰ M, respectively. ASV
was applied for the determination of cinitapride in urine samples with an
accumulation time of 65 s. A 3s detection limit was found to be 1.8×10⁻⁷ M with
RSD of 1% was determined.
Matias E Manzotti., et al., (2007) determined the utility of prokinetic drugs
(cinitapride, cisapride) in improving symptoms and endoscopic lesions in patients
with GERD esophagitis. They concluded that randomized controlled trials provided
moderate-quality evidence that prokinetic drugs improve symptoms in patients with
reflux esophagitis and low-quality evidence that they have an impact on endoscopic
healing.
Helena Marquez., et al., (2011) developed a UHPLC method for the assessment of
the metabolic profile of cinitapride. Metabolites were generated from the incubation
of cinitapride with human liver microsomes. Cinitapride and its metabolites were
separated by reversed-phase mode using a formate aqueous solution (pH 6.5) and
acetonitrile as the components of the mobile phase. Limits of detection are about
0.03µmol/L, and repeatabilities were better than 0.06% for retention times and better
than 3.5% for concentrations. The method was applied to characterize the in
Department of Pharmaceutical Chemistry Page 26
Marta Robert., et al., (2007) studied that the prokinetic cinitapride has no clinically
relevant pharmacokinetic interaction and effect on QT during coadministration with
ketoconazole. The safety and tolerability of the study treatments were also evaluated.
Shikha Roy M.N., et al., (2008) determined free levels of cinitapride in human
plasma by liquid chromatography- tandem mass spectrometry. Risperidone was used
as the internal standard. The method was developed by extracting the sample and
analyzed by high performance liquid chromatography coupled to electrospray tandem
mass spectrometry API-4000 (LC-MS/MS). The method allowed an appropriate
characterization of the pharmacokinetic profile of cinitapride at the therapeutic dose.
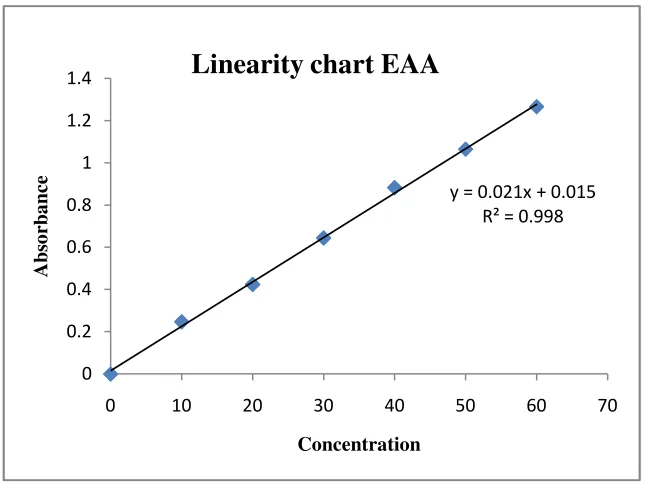
Thangabalan B., et al., (2010) validated extractive spectrophotometric estimation of
cinitapride in pure and its solid dosage form. These methods are based on the
formation of chloroform soluble ion-association complexes of cinitapride with
bromocresol green and with bromothymol blue in potassium hydrogen phthalate
buffer PH- 4.0 with absorption maximum at about 414 and 416nm for BCG and BTB
respectively.
Roy S.M.N., et al., (2010) developed RP-HPLC method for the determination of
cinitapride under stress induced degradation studies.. The drug was subjected to all
stress conditions such as reduction, oxidation acidic and alkaline medium.
Acetonitrile and phosphate buffer, pH 6.7 in the ratio (70:30 v/v) was used as the
mobile phase and cinitapride detected at 260nm. Glimepride was used as an internal
Department of Pharmaceutical Chemistry Page 27 degradation in the presence of in alkaline, acidic and oxidative condition but the drug
was found to be stable under thermal stress.
Syeda Humaire., et al., (2010) developed colorimetric method for the determination
of cinitapride hydrogen tartarate in drug formulations. Six simple and sensitive
spectrophotometric methods (A, B, C, D, E and F) have been developed for the
quantitative estimation of cinitapride in bulk drug and pharmaceutical dosage forms.
Method A and B is based on the oxidation followed by coupling reaction of
cinitapride with 1, 10 phenanthroline and 2, 2’ bipyridyl in presence of ferric chloride
to form orange‐red colored chromogens respectively. Methods are based on the
diazotization of cinitapride with nitrous acid followed by its coupling in situ with N-
(1-naphthyl) ethylenediamine dihydrochloride to form pinkish purple colored
chromogen(C), with phloroglucinol to form orange colored chromogen (D), with
diphenylamine to form pink colored chromogen (E) and with chromo tropic acid to
form orange colored chromogen (F) respectively.
Syeda Humaira et al., (2011) developed a validated RP-HPLC method to determine
cinitapride hydrogen tartarate in solid oral dosage forms. Gradient elution technique
with mobile phase consisting of 0.1% formic acid in water and acetonitrile and UV
detection wavelength of 268nm was utilized. The developed method was validated for
precision which includes system precision and method precision, accuracy and
linearity studies in the concentration range of 5-100 µg/mL with correlation
Department of Pharmaceutical Chemistry Page 28
Thangabalan B., et al., (2011) analysed spectrophotometrically the amount of
cinitapride in tablet dosage form using 2.0 M sodium benzoate solution as the
hydrotropic solubilizing agent.. Cinitapride showed λ max at 395 nm obeyed Beers
law at 10-80µ g/mL. The results were validated statistically and by recovery studies.
Suresh Ch.V., et al., (2011) developed a new visible spectrophotometric method for
the determination of cinitapride in pharmaceutical dosage forms. They developed
three methods involving charge transfer complex with chloranilic acid, oxidative
coupling with MBTH and oxidation followed by complex formation with 1, 10 -
phenanthroline in the ferric chloride. The complexes were found to show λ max at
550, 420, and 510nm respectively.
PANTOPRAZOLE
Patricia Poole., (2001) compared pantoprazole with histamine H2 -receptor
antagonists (H2RAs) and omeprazole in clinical trials of patients with grade II or III
(Savary-Miller scale) reflux esophagitis. Studies comparing pantoprazole and H2RAs
found that pantoprazole had consistently better healing rates and symptom control.
Abdel-Aziz M. Wahbi., et al., (2002) applied compensation and chemometric
methods (derivative, orthogonal and difference spectrophotometry) for the estimation
of omepazole, lansoprazole and pantoprazole in their pharmaceutical preparations.
The difference spectrophotometry was found to be unaffected by acid induced
Department of Pharmaceutical Chemistry Page 29
Karljikovic–Rajic.K., et al., (2003) developed a first-order UV-derivative
spectrophotometry in the analysis of omeprazole and pantoprazole sodium salt and
corresponding impurities. Applied zero-crossing method for the determination of
omeprazole, omeprazole sulphone, pantoprazole sodium salt, and
N-methylpantoprazole in methanol-ammonia 4.0% v/v. The method showed the
impurity-drug intermolecular interactions, due to the possible intermolecular
hydrogen bonds, confirmed by divergences of experimentally obtained amplitudes for
impurities omeprazole sulphone and N-methylpantoprazole in comparison to
expected values according to regression equations of calibration graphs.
Salama F., et al., (2003) validated spectrophotometric determination of omeprazole
and pantoprazole sodium via their metal chelates. The procedures are based on the
formation of 2:1 chelates of both drugs with different metal ions. The coloured
chelates of omeprazole in ethanol are determined spectrophotometrically at 411, 399
and 523nm using iron (III), chromium (III) and cobalt (II) respectively.
Incilay Suslu., et al., (2003) developed first derivative spectroscopy for the
estimation of pantoprazole using 1: 9 ratio of water: methanol as the diluent; λmax of
295 nm and 303 nm for standard comparison and Zero crossing point respectively.
Lix Q., et al., (2004) compared the inhibitory effects of the proton pump-inhibiting
drugs omeprazole, esomeprazole, lansoprazole, pantoprazole, and rabeprazole on
human cytochrome P450 activities. It was suggested that, although the inhibitory
profiles of the five studied PPIs were similar, lansoprazole and pantoprazole are the
Department of Pharmaceutical Chemistry Page 30
Rahman., et al., (2006) devised a kinetic spectrophotometric method based on the oxidation of pantoprazole with Fe(III) in sulfuric acid medium. The reaction was
followed spectrophotometrically by measuring the increase in absorbance with time
(1 - 8 min) at 725 nm. The initial rate method was adopted for constructing the
calibration graph, which is linear in the concentration range of 5 - 90 µg mL-1.
Bardhan K., et al., (D, (2007) performed a clinical trial comparing pantoprazole and
esomeprazole to explore the concept of achieving 'complete remission' in
gastro-oesophageal reflux disease. Thus, complete remission is a more reliable and
clinically relevant endpoint of treatment.
Akheel Ahmed Syed., et al., (2007) demonstrated a spectrophotometric
determination of certain proton pump inhibitors using new reagents such as
neocuproine and bathocuproine. Spectrophotometric methods were developed for the
determination of antiulcer drugs namely omeprazole, lansoprazole, pantoprazole,
rabeprazole and esomoprazole.
Basavaiah K., et al., (2007) determined pantoprazole by colorimetric methods using
bromate –bromide, methyl orange and indigo carmine as the colouring agents. The
methyl orange complex showed λmax at 520 nm and indigo carmine complex at
610nm.
Syed AA., et al., (2008) developed a spectrophotometric method for the
determination of certain proton pump inhibitors belonging to the benzimidazole class
of compounds. The method is based on the reaction of omeprazole, lansoprazole,
Department of Pharmaceutical Chemistry Page 31 with ferricyanide under neutral condition which yields Prussian blue product with
maximum absorption at 720-730 nm.
Pimpodkar N.V., et al., (2008) developed visible spectrophotometric method by the
oxidative coupling of pantoprazole by MBTH reagent in the presence of ferric
ammonium sulphate and observed λ max at 504nm.
Urdigere Rangachar., et al., (2008) developed visible spectrophotometric method
by the redox and complexation method using N-bromosuccinimide and iron II
thiocyanate and tiron reagents. Coupling of pantoprazole by MBTH reagent in the
presence of ferric ammonium sulphate and measuring the absorbance at a λ max of
504nm.
Kanakapura Basavaiah., et al., (2009) developed titrimetric and visible
spectrophotometric methods for pantoprazole. Both methods involve reaction of
pantoprazole with excess potassium permanganate in sulphuric acid and indirectly
determining the amount of pantoprazole by titrating with iron II solution for titrimetry
and measuring the absorbance at 545 nm for the spectrophotometry.
Kakde R.B., et al., (2009) developed three-wavelength spectrophotometric method
for simultaneous estimation of pantoprazole and domperidone in pharmaceutical
preparations. The method utilizes a wavelength at which domperidone has zero
absorbance for the determination of pantoprazole.
Basavaiah. K., et al., (2009) determined pantoprazole by colorimetric methods using
Department of Pharmaceutical Chemistry Page 32
The methyl orange complex showed λmax at 520 nm and indigo carmine complex at
610nm.
Paluru Rudra Mohan Reddy., et al., (2010) developed a stability indicating fast
LC method for the estimation of impurities of pantoprazole in tablet dosage forms.
The method utilizes gradient elution technique, mobile phase consisting of
ammonium acetate buffer – acetonitrile at a flow rate of 0.8mL/min and detected at
290 nm
Kalaichelvi R., et al., (2010) developed a extractive colorimetric determination of
pantoprazole sodium by acid-dye complexation method in solid dosage form using
bromothymol blue dye for the complexation. The complex showed λmax at 428nm.
Basavaiah K., et al., (2010) determined pantoprazole by colormetric methods using
potassium permanganate as the colouring agent in neutral medium and measured
absorbance at 350nm.
Krishna R. Gupta., et al., (2010) developed simultaneous UV spectrophotometric
method for the estimation of pantoprazole and itopride in capsule dosage form.
Simultaneous equation method and absorbance ratio method have applied for the
estimation.
Prasanna Reddy Battu., et al., (2011) developed and validated a simple, selective,
accurate High Performance Liquid Chromatographic (HPLC) method for the
estimation of pantoprazole sodium sesquihydrate in pharmaceutical dosage forms and
Department of Pharmaceutical Chemistry Page 33 column utilizing a mobile phase of acetonitrile/phosphate buffer (70:30, v/v, pH 7.0)
at a flow rate of 0.8 mL/min and UV detection at 260 nm
Rajnish Kumar., et al., (2011) developed UV spectroscopy for the estimation of
pantoprazole in pharmaceutical dosage forms using distilled water as the diluent and
λmax at 292 nm
Arunadevi S. Birajda., et al., (2011) developed simultaneous estimation method
for pantoprazole and mosapride in fixed dose combination by RP- HPLC and UV .
The methods adopts 274 and 288.2 nm for the simultaneous estimation by UV and
30 mM ammonium sulphate buffer : acetonitrile (50:50v/v) as the mobile phase for
RP- HPLC.
Kanakapura Basavaiah., et al., (2011) developed titrimetric and visible
spectrophotometric methods for pantoprazole. Both methods involve reaction of
pantoprazole with excess ceric ammonium sulphate and indirectly determining the
amount of pantoprazole by titrating with iron II solution for titrimetry and measuring
the absorbance at 545 nm for the spectrophotometric method.
Juana Isabel Balderas., et al., (2011) studied the bioavailability of two
coated-tablet formulations of a single dose of pantoprazole 40 mg comparison in healthy
Department of Pharmaceutical Chemistry Page 34
AIM AND OBJECTIVE OF WORK
Analysis of drugs plays a major role in the development, manufacture and
therapeutic use of drug. Quantitative analysis of raw materials and the final product
is necessary to ensure that they meet certain specifications and to ascertain the
amount of each component in the final product.
Standard analytical procedures for newly designed and synthesized drugs are
not available in any of the pharmacopoeias. So it becomes necessary to develop
newer, accurate, specific, simple, easy to perform, reliable and economic analytical
techniques for the estimation of the new drugs.
This thesis deals with pantoprazole (PNP) and cinitapride (CNP).
Pantoprazole has been recently included in Indian Pharmacopoeia – 2010.
Cinitapride is a very new drug, launched in 2007 and is not official in any of the
pharmacopoeias. It has been very recently added in drug bank in 2012. The
combination of the two drugs has been launched in 2011.Extensive literature survey
reveals that only first derivative and HPTLC method for the determination of
pantoprazole (PNP) and cinitapride (CNP) has been reported. There is no evidence
for the estimation of PNP and CNP by UV-Visible spectrophotometry and RP-HPLC
methods in bulk and in combined tablet dosage form. So, an attempt has been
made is to develop a validated, simple, easy to perform, accurate, cost effective
and rapid spectrophotometric methods for the estimation of CNP and PNP in
Department of Pharmaceutical Chemistry Page 35
PLAN OF WORK
1. Procurement of Gift samples of PNP and CNP.
2. Development of simple and accurate UV – Visible spectrophotometric methods.
Standard absorbance method
Area under curve
Second derivative spectroscopy
Visible spectrophotometry
Colorimetry (Diazotisation followed by coupling for CNP)
Colorimetry (Redox method for PNP)
3. Development of rapid and accurate RP-HPLC method using UV detection
4. Validation of proposed analytical methods.
5. Statistical analysis of developed analytical methods
Department of Pharmaceutical Chemistry Page 36
MATERIALS AND METHODS
MATERIALS
DRUG SAMPLES
Cinitapride pure drug sample was generously gifted by M/S Zydus Cadila,
Ankleshwar, Gujarat (India) and Pantoprazole by M/S Knis Laboratories, Chennai,
TN (India).The combined capsule dosage form was acquired from the local market.
The capsule contained within it enteric coated tablet of pantoprazole sodium
sesquihydrate equivalent to 40 mg of PNP and extended release tablet of cinitapride
hydrogen tartarate equivalent to 3 mg of cinitapride.
REAGENTS AND CHEMICALS
All the chemical used in the study were of analytical grade and procured from
Merck India ltd.The chemicals used during the study are
S.no Chemicals Grade
1. Methanol Analytical grade
2. Water Double distilled water,
HPLC grade for HPLC
3. Methanol HPLC grade for HPLC
4. Acetonitrile HPLC grade for HPLC
Department of Pharmaceutical Chemistry Page 37
6. Potassium bromate Analytical grade
7. Potassium bromide Analytical grade
8. FAS Analytical grade
9. Ammonium Thiocyanate Analytical grade
10. 1,10 phenanthroline Analytical grade
11. EAA, AAC Analytical grade
INSTRUMENTS
1. Digital Balance
2. Shimadzu UV-Visible spectrophotometer, Model 1650PC
3. A Shimadzu Prominence LC-20AT with SPD-20A UV detector -HPLC
Department of Pharmaceutical Chemistry Page 38
ULTRA VIOLET- VISIBLE SPECTROSCOPY
General discussion
Ultraviolet spectroscopy is most frequently employed technique in
pharmaceutical analysis. The ultraviolet region of the electromagnetic spectrum is
used in the analysis which extends from 200-400 nm. It involves transitition of
electrons of π orbitals and lone pairs (n = non bonding) so UV spectroscopy is of
most use for identifying conjugated systems.
Choice of solvent (Sharma, 1994; Chatwal and Anand, 2000)
The most important requirement of the solvent are:
• It should solubilize the analyte freely.
• It should not itself absorb in the region of the analyte.
• It should not undergo association or dissociation with the analyte
The Absorption laws (Sharma YR, 2010)
There are two laws which govern the absorption of light by the molecules.
Theyare,
o Lambert-Bouger’s law
o Beer’s law
Lambert-Bouger’s law
It states that, when a beam of monochromatic radiation passes through a
Department of Pharmaceutical Chemistry Page 39 radiation with thickness of absorbing medium is directly proportional to the intensity
of the incident radiation.
The law is given by: I=I010 - ax
Where, I0 is the intensity incident light; I is the intensity of transmitted light.
Beer’s law
This law states that, when a beam of monochromatic radiation is passed
through a solution of an absorbing substance, the rate of decrease of intensity of
transmitted radiation with concentration of the absorbing solution is directly
proportional to the intensity of incident radiation. The law is given by:
I=I0 e-k’cx
On combining these two laws ,the Beer- Lambert law is formulated
Log I0/I = a .c.l = A
Where, I0 = intensity incident light; I = intensity of transmitted light
a = Molar extinction coefficient; c = concentration of solute in moles litre-1
l = pathlength of the sample ( usually 1 cm); A = absorbance
Quantitative analysis
The use of UV in quantitative analysis employs the method of comparing the
Department of Pharmaceutical Chemistry Page 40
Assay of Substances in single Component Samples (Beckett and Stenlake, 2002)
The most important characteristics of photometric and spectrophotometric
methods are high selectivity and ease of convenience. Quantitative analysis (assay of
an absorbing substance) can be done using following methods.
• Use of A (1%, 1cm) values
This method can be used for the estimation of formulation or raw material
when reference standard not available. The use of standard A (1%, 1cm) value
avoids the need to prepare a standard solution of the reference substance in order to
determine its absorption.
• Use of calibration graph
In this method a calibration curve is plotted using concentration (X-axis) Vs
absorbance (Y-axis) with the value of five or more standard solutions. A straight
line is drawn through maximum number of points. This line is called line of best fit.
By interpolating the absorbance of the sample solution on the calibration chart, the
concentration of the drug amount and percentage purity can be calculated. This is
used in the new method development for the estimation of an analyte by UV- Visible
spectrophotometry.
The amount present can be calculated using the formula
Amount present Amount present Amount present
Amount present SamSamSamSample absorbanceple absorbanceple absorbanceple absorbance Standard absorbance Standard absorbance Standard absorbance
Standard absorbance(Dilution factor((Dilution factor((Dilution factor((Dilution factor(
Wt of Std Wt of StdWt of Std Wt of Std Wt of Sample Wt of Sample Wt of Sample
Department of Pharmaceutical Chemistry Page 41
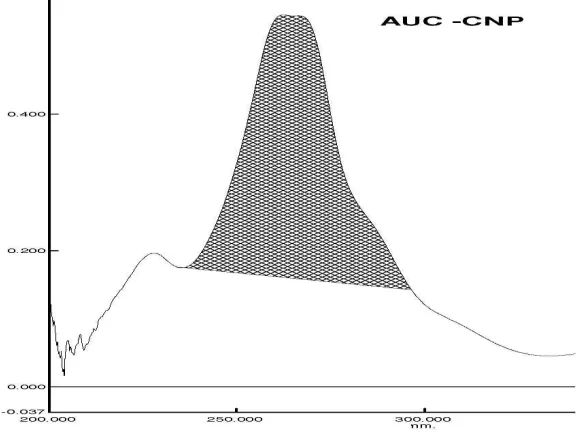
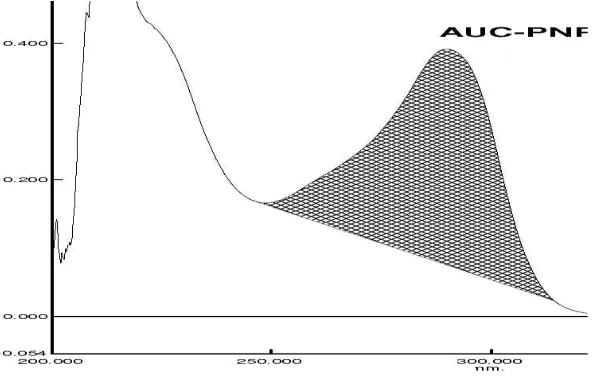
• For Area under Curve, instead of absorbance , Area is used.
• For Derivative spectrophotometry, Amplitude of negative maxima is used
instead of absorbance.
VISIBLE SPECTROPHOTOMETRY
The visible spectrophotometry follows the same Beer- Lamberts law. But the
abasorbance of the analyte is observed in the Visible region (380 nm to
800nm).Analytes which do not have absorbing chromophore in their structure are
chemically derivatized by chromogenic reactions to form a coloured complex which
show bathochromic shift towards the visible region. There different complexing
methods and corresponding complexing agent.
1. Diazotisation followed by coupling reaction to form diazo dyes
2. Complexes involving redox reactions and reagents.
3. Acid dye techniques involving ion pair reagents like Bromothymol
blue,Bromocresol green, Eriochrome black II. Methyl red etc
4. Reagents specific for phenols- 2,6 dichloro indo phenol
5. Reagents specific for primary amines- PDAB (para dimethyl amino
benzaldehyde, MBTH (3-methyl 1,2 benzothiazoline hydrazone hydrochloride)
etc.
While developing methods for estimation of analytes using UV –Visible
spectrophotometry following criterias are considered
Department of Pharmaceutical Chemistry Page 42
• Stability of the drug in the solvent /diluents.
• Selectivity of the complexing agent in colorimetry.
• Stability of the complex, colour of the complex.
• Stability of absorbance with respect to time ,pH, temperature, ionic strength
etc.
METHODS
I. ULTRA VIOLET SPECTROPHOTOMETRIC METHOD
SELECTION OF SOLVENT ( IP,2010)
The solubility of CNP and PNP were studied as per Indian Pharmacopoeial
standards. The solubility of the drugs was tested in both polar and non polar solvents.
Both the drugs were found to be freely soluble in methanol. So methanol was
selected for further studies on CNP and PNP by UV spectroscopy.
PREPARATION OF STANDARD STOCK SOLUTION
Weighed accurately about 50 mg each of standard CNP and PNP in two separate
50mL volumetric flasks. Dissolved in 10 mL of methanol and made up to volume
with methanol to obtain stock solutions of concentration 1000 µg/mL of both CNP
Department of Pharmaceutical Chemistry Page 43
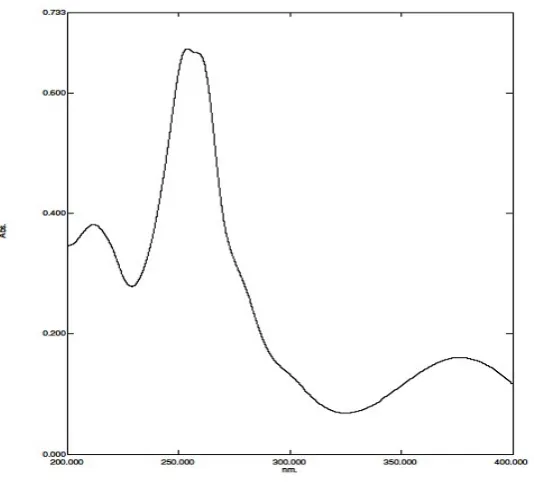
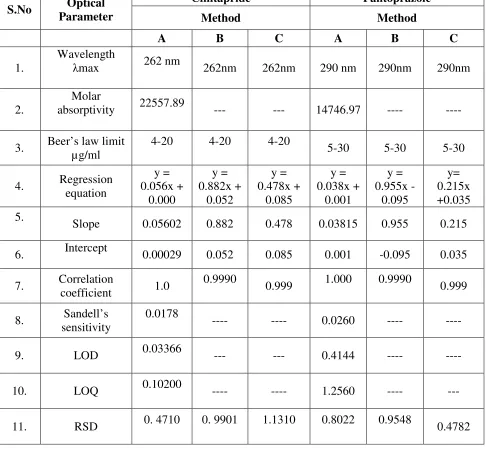
SELECTION OF ABSORPTION MAXIMA
The stock solutions of both CNP and PNP were appropriately diluted to obtain a
concentration of 10 µg/ mL. The dilutions were scanned in ultra violet region
(200-400nm) against methanol blank. CNP showed maximum absorbance at 262nm and
PNP at 290 nm. Thus λ max for CNP and PNP were selected as 262 and 290 nm
respectively and used during further studies for the estimation of CNP and PNP by
UV spectrophotometry.
ESTABLISHMENT OF LINEARITY
CINITAPRIDE
The stock solution (1000 µg/ mL) of CNP was serially diluted with methanol
to obtain dilutions ranging 4-20 µg/ mL. The final dilutions were scanned in
ultraviolet region (200-400nm) against methanol blank. The λ max was found to be
stable at 262nm. The absorbance of the dilutions was measured at the selected λ max,
262nm.
PANTOPRAZOLE
The stock solution (1000 µg/ mL) of PNP was serially diluted with methanol
to obtain dilutions ranging 5-30 µg/ mL. The final dilutions were scanned in
ultraviolet region (200-400nm) against methanol blank. The λ max was found to be
stable at 290 nm. The absorbance of the dilutions was measured at the selected λ
Department of Pharmaceutical Chemistry Page 44
SAMPLE ANALYSIS
The capsule dosage form contained PNP as enteric coated tablet and CNP as
extended release tablet. Thus both the components were analyzed as separate entities
METHOD A: STANDARD ABSORBANCE METHOD
CINITAPRIDE
Twenty tablets of CNP were accurately weighed and crushed to fine powder.
Tablet powder equivalent to 10mg of the CNP was weighed in a 100 mL
volumetric flask, shaken vigorously with sufficient quantity of methanol for half an
hour. Finally the solution was made up to volume with methanol. The solution was
well shaken and filtered through Whatmann filter paper (No.41). First few mL of the
filtrate was discarded and an aliquot quantity of the filtrate was diluted to obtain a
final concentration of 10µg/mL of CNP. The absorbance of the resulting solution
was measured at 262nm against methanol blank.
PANTOPRAZOLE
Twenty tablets of PNP was accurately weighed and crushed to fine powder.
Tablet powder equivalent to 50mg of PNP was weighed in a 100mL volumetric
flask, shaken vigorously with sufficient amount of methanol for half an hour and
finally made up to volume with methanol. The resulting solution was filtered through
Whatmann filter paper (No.41). First few mL of the filtrate was discarded and
Department of Pharmaceutical Chemistry Page 45 concentration of 15µ g/mL of PNP. The