R E S E A R C H A R T I C L E
Open Access
Modularity detection in protein-protein
interaction networks
Tejaswini Narayanan
1, Merril Gersten
2, Shankar Subramaniam
3*and Ananth Grama
4*Abstract
Background:Many recent studies have investigated modularity in biological networks, and its role in functional and structural characterization of constituent biomolecules. A technique that has shown considerable promise in the domain of modularity detection is the Newman and Girvan (NG) algorithm, which relies on the number of shortest-paths across pairs of vertices in the network traversing a given edge, referred to as thebetweennessof that edge. The edge with the highest betweenness is iteratively eliminated from the network, with the betweenness of the remaining edges recalculated in every iteration. This generates a complete dendrogram, from which modules are extracted by applying a quality metric calledmodularitydenoted byQ. This exhaustive computation can be prohibitively expensive for large networks such as Protein-Protein Interaction Networks. In this paper, we present a novel optimization to the modularity detection algorithm, in terms of an efficient termination criterion based on a
target edge betweennessvalue, using which the process of iterative edge removal may be terminated.
Results:We validate the robustness of our approach by applying our algorithm on real-world protein-protein interaction networks ofYeast, C.ElegansandDrosophila, and demonstrate that our algorithm consistently has significant computational gains in terms of reduced runtime, when compared to the NG algorithm. Furthermore, our algorithm produces modules comparable to those from the NG algorithm, qualitatively and quantitatively. We illustrate this using comparison metrics such as module distribution, module membership cardinality, modularityQ, and Jaccard Similarity Coefficient.
Conclusions:We have presented an optimized approach for efficient modularity detection in networks. The intuition driving our approach is the extraction of holistic measures of centrality from graphs, which are
representative of inherent modular structure of the underlying network, and the application of those measures to efficiently guide the modularity detection process. We have empirically evaluated our approach in the specific context of real-world large scale biological networks, and have demonstrated significant savings in computational time while maintaining comparable quality of detected modules.
Background
The problem of modularity detection in networks has received considerable attention in recent literature [1-5]. Specifically, in the context of biological networks, identi-fication of modules enables functional annotation of constituent biomolecules, discovery of targets for thera-peutic intervention and screening etc. More generally, modular decomposition provides us with a higher-level understanding of the organization of networks and also
serves as the basis for other network analysis tasks, such as hierarchical alignment, modular evolution, and orthology.
There are three primary approaches to modularity detection: (i) top down (or divisive) techniques, in which a series of network partitions hierarchically decompose a network into modules, (ii) bottom up (or agglomerative) techniques, in which modules are con-structed by adding elements to an initial seed, and (iii) force directed methods, in which suitably designed parameters drive nodes belonging to the same module to spatially proximate regions of space. There have also been investigations focused on relating various classes of methods [6].
* Correspondence: [email protected]; [email protected]
3Department of Bioengineering, University of California, San Diego, USA 4
Department of Computer Science, Purdue University, West Lafayette, IN, USA
Full list of author information is available at the end of the article
Newman and Girvan algorithm
One such divisive technique of interest is the Newman and Girvan (NG) algorithm [1], which uses the notion ofedge-betweenness, a metric that has received consider-able recent research interest in the domain of modular-ity detection. Edge-betweenness is typically computed as the number of (pair-wise) shortest paths that traverse an edge in a network. This notion, which was first intro-duced by Anthonisse [7], can be used to compute mod-ules by repeatedly identifying and eliminating the edge with highest betweenness. Note that since the elimina-tion of a single edge (especially one with high between-ness) may cause significant perturbations to the shortest paths, the edge-betweenness of the remaining edges must be recomputed after each edge-elimination.
The output from the NG algorithm is a complete den-drogram, which decomposes a given graph down to individual nodes. Modules are extracted from this den-drogram by applying a quality metric calledmodularity
(Q), which is defined as follows:
Q =
i
(eii−a2i) = Tr(e)− e2
where,eis ak×ksymmetric matrix whose element eij
is the fraction of all edges in the network that link ver-tices in moduleito vertices in module j;kis the number of modules in the network;
Tr(e) = ∑i eii, is the trace ofe, which represents the
fraction of edges in the network that connect vertices in the same module;
ai=∑jeij, are the row (or column) sums, which
repre-sent the fraction of edges that connect to vertices in modulei;
||E|| denotes the sum of the elements of matrixE. We observe that, in a network in which edges fall between vertices without regard for the modules they belong to,eij=aiaj.
TheQ value measures the fraction of the edges that connect vertices within the same module minus the expected value of the same quantity in the network. If the number of intra-modular edges is no better than
random, we get Q = 0. Values approaching Q = 1,
which is the maximum, indicate strong modular struc-ture [1]. In practice, Q values for such networks with strong modular structure typically fall in the range from about 0.3 to 0.7. The modular decomposition of the
net-work (from the dendrogram) with maximumQvalue is
considered to be the best split by the NG algorithm. While the computation of modules using the NG algorithm has been shown to perform well in terms of quality of modules, its computational cost can be signifi-cant (particularly for large networks such as biological networks). This cost, in part, stems from repeated edge
betweenness computations. Furthermore, a level of refinement in the output dendrogram to the individual nodes, is typically unnecessary from an application standpoint, often un-informative, and computationally expensive. Finally, the dendrogram requires additional post-processing to identify suitable modules based on quality measures associated with the modules. Comput-ing the quality of each module correspondComput-ing to every node in the dendrogram is itself expensive. A stopping criterion that identifies a near-optimal point at which the process of iterative edge-removal may be terminated would significantly reduce the time and space complex-ity of the NG algorithm.
The problem of terminating divisive clustering is an important one, especially when the clustering method is itself expensive. A number of other approaches have been proposed–including use of pvalues of clusters as termination criteria [8]. However, each of these methods assumes models for underlying data, or specific proper-ties for quality measures applied to modules. For exam-ple, the divisive partitioning technique of Koyuturk et al. [8] stops the partitioning process when thepvalue of a module is lower than a user-specified threshold. This does not guarantee that the optimalpvalue modules are found. Similarly, for data-sets for which precise models are not available, estimation of number of clusters is dif-ficult. Neither class of techniques is directly applicable for divisive partitioning based on the NG algorithm.
In this paper, we experimentally derive an optimized termination criterion for the NG algorithm (which we call thetarget edge-betweenness), based on initial values of edge-betweenness computed over the input network. In particular, we define the target edge-betweennessto be thegeometric meanof edge-betweenness values of all edges in the input network (and hence refer to our algo-rithm as theGmean algorithmin the discussion below). A detailed description of our algorithm is included in the Methods section.
Results and discussion
There are two computational problems with the NG algorithm:
1. The iterative removal of edges (preceded by recalcu-lation of edge betweenness in every iteration) is per-formed until all the edges are removed, leading to a time complexity of O(ne2) for a network of n vertices and e edges (using Brandes’ algorithm, assuming con-nected networks as inputs). This computation becomes prohibitively expensive in the context of large biological networks.
The Gmean algorithm directly addresses these over-heads in two fundamental ways: it terminates the pro-cess before all edges are removed, thus significantly reducing the first overhead. Since the termination criter-ion is computed just once (at the start of the algorithm), and does not rely on repeatedQvalue computations, we eliminate the second overhead altogether.
Furthermore, we demonstrate that our algorithm
results in modules with Q values comparable to the
maximum Qvalue from the NG algorithm–thus
main-taining the quality of the identified modules, while sig-nificantly reducing runtime. We also use theJaccard Similarity Coefficient (a measure of similaritybetween two sample sets) to show that the resulting modules from both the approaches are similar.
We validate our approach on the networks summar-ized in Table 1. For each of the networks, we eliminate multiple edges between pairs of nodes, self-loops, and mirrored edges. Thus, the final number of edges/interac-tions considered is shown in #Edges (Network considered).
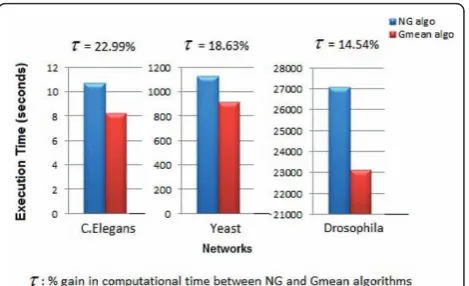
We perform our experimental evaluation using a par-allelized approach [11] to implement the NG and Gmean algorithms. Our results (as shown in Figure 1) demonstrate excellent performance in terms of effi-ciency on moderate machine configurations (tens of processors).
Comparison of computational efficiency
For a specific network under consideration, let RTNG
and RTGmean denote the execution times for the NG
and Gmean algorithms respectively. We define the per-centage gain in computational time (τ) between the NG and Gmean algorithms, as follows:
τ = RTNG−RTGmean
RTNG ×
100
We observe significant and consistent savings in com-putational cost with our proposed optimization (for the networks in our biological test bed under consideration).
Figure 1 presents a comparison of the execution times for the NG and Gmean algorithms.
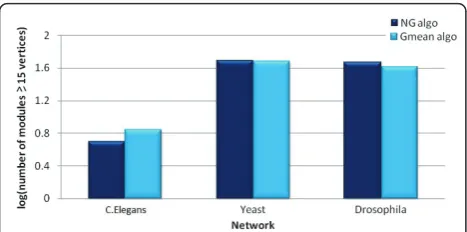
Comparison of module size and distribution
In Figures 2 and 3, we present a broad quantitative comparison of the size and distribution of modules pro-duced using the Gmean and NG algorithms. In particu-lar, we observe that, for all the three networks under consideration, the total number of modules produced by the two algorithms is comparable.
Comparison of modularity
In addition to quantitatively comparing and demonstrat-ing that the modules resultdemonstrat-ing from our algorithm are comparable in number and distribution to the modules resulting from the NG algorithm, we also present a qua-litative validation that the results are indeed statistically
similar in terms of quality of the modules produced
[image:3.595.306.541.88.231.2]using the modularity valueQ. Figure 4 shows the modu-larity value comparison for the set of modules produced by both the algorithms, for the different networks con-sidered in this paper. We note that for all networks under consideration, our algorithm identifies modules with very similar modularity values as the NG algorithm.
Table 1 Summary of Networks that were used to validate our approach
Network Source #Vertices [Original Network]
#Edges
Original Network
Network Considered
C.Elegans [9] 453 4596 2025
Yeast* [10] 3654 15316 9946
Drosophila [10] 7666 25649 25433
* The entire Yeast network contains 160,566 interactions. We restrict the dataset to interactions determined by Co-purification or Yeast Two-hybrid experiments. This yields a network of 15,316 interactions
[image:3.595.306.539.585.690.2]Figure 1 Comparison of Runtimes for NG and Gmean algorithms for C.Elegans, Yeast and Drosophila networks.
[image:3.595.57.292.612.705.2]Comparison of Jaccard similarity coefficient
Jaccard Similarity Coefficient or theJaccard Index is a statistic used for comparing the similarity and diversity of sample sets. The Jaccard Index measures similarity between two sample sets (sayAand B), and is defined as the size of the intersection divided by the size of the union of the sample sets:
J(A,B) = |A∩B|
|A∪B|
The Jaccard Index is 1 if the two sample sets are exactly identical, and is equal to 0, if they have no over-lap at all.
We use this metric to show the similarity of the modules produced as the output by the NG and the Gmean algo-rithms. Specifically, we consider the modules produced by the algorithms as sample sets constituted by vertices and calculate the Jaccard IndicesJ(A,B) for all pairs of mod-ulesAandB(one from the output of each algorithm).
We define the percentage similarity score (l) as the following:
λ =
J(A,B)
J(A,B)∗ × 100
whereJ (A,B) is the Jaccard Index for the modules A
andB, one from the output of each algorithm;
J (A,B)* is theidealJaccard Index for the modulesA
and B, one from the output of each algorithm (note that
J (A,B)* = 1, corresponding to perfect match, when the two modulesAandBare exactly identical);
Σ is the summation over all pairs of modules, one
[image:4.595.57.291.88.204.2]from the output of each algorithm.
Table 2 shows the percentage similarity values for the modules produced by the two algorithms for all the net-works considered. We observe that the modules pro-duced by the two algorithms demonstrate a high degree of similarity.
Conclusions
In this paper, we have proposed a novel termination cri-terion for efficient modularity detection in networks. The intuition driving our approach is the extraction of holistic measures of centrality from graphs, which are representative of inherent modular structure, and the application of those measures to efficiently guide the modularity detection process. We have empirically eval-uated our approach against existing techniques for mod-ularity detection in the context of biological networks, and have demonstrated significant savings in computa-tional time while maintaining comparable quality of detected modules.
Methods
Existing NG method
In the NG algorithm, the edge-betweenness is computed for each edge in the network under consideration. The edge with the maximum edge-betweenness is identified and eliminated, followed by a recalculation of the edge-betweenness values of all the remaining edges in the resultant network. This process is iteratively repeated till no edges are remaining, thus generating a complete dendrogram which is then traversed to identify the par-tition with best modularity valueQ.
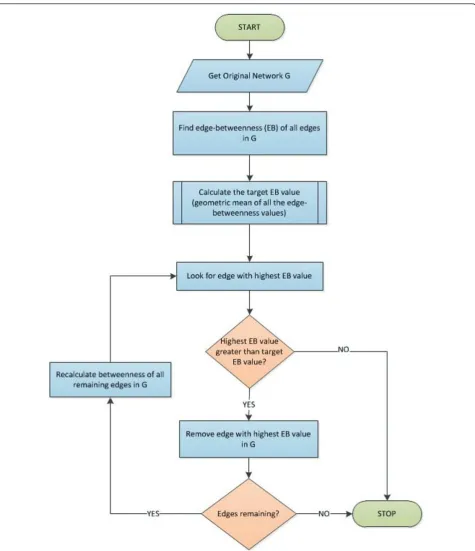
Proposed Gmean method
Figure 5 presents a flow diagram that illustrates the gen-eral framework of the proposed Gmean algorithm. Our motivation is to compute a target edge betweenness T
that is used to determine termination of the algorithm. Figure 3Log scale comparison of number of modules with at
[image:4.595.57.291.518.694.2]least 15 vertices identified by NG and Gmean algorithms for C. Elegans, Yeast and Drosophila networks.
Figure 4Comparison of Modularity (Q) values from NG and Gmean algorithms for C.Elegans, Yeast and Drosophila networks.
Table 2 Summary of % similarity for biological networks considered
C.Elegans Yeast Drosophila ΣJ(A,B) 4.5472 47.973 40.5089
ΣJ(A,B) 5 48 46
[image:4.595.305.539.676.731.2]In particular, we propose that the recalculation of edge-betweenness and removal of the edges be stopped when the edge to be removed has a betweenness value less than T. More intuitively, we propose that for an edge to be considered to be an inter-modular edge, it must have betweenness value of at leastT.
Based on extensive experimentation, we propose the following definition ofT:
T = G(e)
whereG(e) is the geometric mean (gmean) of edge-betweenness values of all edges in the input network. Validation on real networks shows that this choice serves as a robust and high-quality termination criterion. Specifically, as stated in the results section, this choice produces a set of modules comparable in quality and quantity to those produced by the NG algorithm. We show this for a number of biological networks of inter-est. All biological network data used for the experimen-tal study are from publicly available data sources [9,10].
List of abbreviations
C.Elegans: Caenorhabditis elegans; gmean: Geometric Mean.
Acknowledgements
We acknowledge NSF grant awards Science and Technology Center Grant 0939370, DBI 0835541 and DBI 0641037 which supported this work.
Author details
1Department of Electrical and Computer Engineering, University of California,
San Diego, USA.2Graduate Program in Bioinformatics and Systems Biology,
University of California, San Diego, USA.3Department of Bioengineering,
University of California, San Diego, USA.4Department of Computer Science, Purdue University, West Lafayette, IN, USA.
Authors’contributions
TN investigated the problem of modularity detection and associated literature, proposed the optimization to the existing Newman and Girvan algorithm, and empirically evaluated the approach. MG helped with refining the proposed optimization and perform quantitative comparison. SS and AG provided guidance relative to the theoretical and practical aspects of designing/evaluating the algorithm. All authors read and approved the final manuscript.
Competing interests
The authors declare that they have no competing interests.
Received: 31 August 2011 Accepted: 29 December 2011 Published: 29 December 2011
References
1. Newman MEJ, Girvan M:Finding and evaluating community structure in networks.Phys Rev E Stat Nonlin Soft Matter Phys2004,69(2 Pt 2):026113. 2. Bader G, Hogue C:An automated method for finding molecular
complexes in large protein interaction networks.BMC Bioinformatics2003, 4:2.
3. Dunn R, Dudbridge F, Sanderson CM:The use of edge-betweenness clustering to investigate biological function in protein interaction networks.BMC Bioinformatics2005,6:39.
4. Rives A, Galitski T:Modular organization of cellular networks.PNAS2003, 100:1128-1133.
5. Sharan R, Ideker T, Kelley B, Shamir R, Karp RM:Identification of protein complexes by comparative analysis of yeast and bacterial protein interaction data.J Comput Biol2005,12(6):835-846.
6. Quigley A, Eades P:FADE: Graph Drawing, Clustering, and Visual Abstraction.Spinger-Verlag2001.
7. Anthonisse JM:The Rush in a Directed Graph. Technical Report BN 9/71.
Stichting Mathematicsh Centrum, Amsterdam1971.
8. Koyuturk M, Grama A, Szpankowski W:Pairwise local alignment of protein interaction networks guided by models of evolution.Proceedings of ACM RECOMB2005, 48-65.
9. Duch J, Arenas A:Community identification using extremal optimization.
Phys Rev E Stat Nonlin Soft Matter Phys2005,72(2 Pt 2):027104. 10. The Biogrid.[http://thebiogrid.org/].
11. Yang Q, Lonardi S:A parallel edge-betweenness clustering tool for Protein-Protein Interaction networks.Int J Data Min Bioinform2007, 1(3):241-247.
doi:10.1186/1756-0500-4-569
Cite this article as:Narayananet al.:Modularity detection in protein-protein interaction networks.BMC Research Notes20114:569.
Submit your next manuscript to BioMed Central and take full advantage of:
• Convenient online submission
• Thorough peer review
• No space constraints or color figure charges
• Immediate publication on acceptance
• Inclusion in PubMed, CAS, Scopus and Google Scholar
• Research which is freely available for redistribution