T E C H N I C A L N O T E
Open Access
Quality assessment metrics for whole genome
gene expression profiling of paraffin embedded
samples
Douglas W Mahoney
1*, Terry M Therneau
1, S Keith Anderson
1, Jin Jen
1, Jean-Pierre A Kocher
1, Monica M Reinholz
2,
Edith A Perez
3and Jeanette E Eckel-Passow
1Abstract
Background:Formalin fixed, paraffin embedded tissues are most commonly used for routine pathology analysis and for long term tissue preservation in the clinical setting. Many institutions have large archives of Formalin fixed, paraffin embedded tissues that provide a unique opportunity for understanding genomic signatures of disease. However, genome-wide expression profiling of Formalin fixed, paraffin embedded samples have been challenging due to RNA degradation. Because of the significant heterogeneity in tissue quality, normalization and analysis of these data presents particular challenges. The distribution of intensity values from archival tissues are inherently noisy and skewed due to differential sample degradation raising two primary concerns; whether a highly skewed array will unduly influence initial normalization of the data and whether outlier arrays can be reliably identified.
Findings:Two simple extensions of common regression diagnostic measures are introduced that measure the stress an array undergoes during normalization and how much a given array deviates from the remaining arrays post-normalization. These metrics are applied to a study involving 1618 formalin-fixed, paraffin-embedded HER2-positive breast cancer samples from the N9831 adjuvant trial processed with Illumina’s cDNA-mediated Annealing Selection extension and Ligation assay.
Conclusion:Proper assessment of array quality within a research study is crucial for controlling unwanted variability in the data. The metrics proposed in this paper have direct biological interpretations and can be used to identify arrays that should either be removed from analysis all together or down-weighted to reduce their influence in downstream analyses.
Keywords:High-dimensional array quality, Formalin-Fixed, Paraffin-embedded tissue, Outlier detection
Background
Many institutions have large archives of formalin-fixed paraffin-embedded (FFPE) tissue. Compared to the general availability, sample collection protocols, and time-sensitive nature of fresh-frozen tissue, these large archives of FFPE tissues are easily assessable and provide a unique opportun-ity for understanding genomic signatures of disease on a large scale as well as the ability to evaluate long-term prog-nostic associations [1,2]. These FFPE samples have been relatively untouched by high dimensional platforms due to
RNA degradation and cross-linking of nucleic acids due to formalin fixation process [3]. However, Illumina introduced their cDNA-mediated Annealing Selection extension and Ligation (DASL) assay that is specifically designed to enable whole genome expression profiling using degradated RNA and is used in conjunction with their BeadArray technology [4-7]. Similarly, the OvationW FFPE WTA system is avai-lable from NuGEN for processing archival tissues to be analyzed by the Affymetrix platform. Although sequencing-based technologies are seen by many as a better alternative to microarray-based methods, sequencing is limited by difficult sample preparation protocols for FFPE samples and the cost of large-scale studies. In addition, several works have reported on the validity of microarray-based
* Correspondence:[email protected]
1
Biomedical Statistics and Informatics, Mayo Clinic, 200 First Street SW, Rochester, MN 55905, USA
Full list of author information is available at the end of the article
approaches to FFPE relative to fresh-frozen tissue and the growth for this technology will most likely increase rapidly [8-10].
The prevailing consensus in the literature is that normalization is a necessary step for microarray platforms in order to adjust for the influence of factors extraneous to the primary biological question such as sample preparation, scanner efficiency, and cross hybridization of probes [11,12]. A fundamental premise of many of the normalization routines is an assertion that the true overall distribution of RNA abundance will be essentially identical from sample to sample, since only a minority of genes will be differentially expressed. Quantile normalization, for instance, forces the marginal distributions across arrays to be equivalent, while other routines use feature specific estimates as a normalization target in order to estimate non-linear bias correction functions [13,14]. Typically, the distribution of pre-normalized data is well behaved and the normalization corrections are numerically small. For array data using FFPE samples, our experience is that the distri-butional properties of pre-normalized intensity values are extremely variable in the amount of abundance, skewness, and spread that is present in the data (Figure 1). A primary challenge for proper analysis of these data is defining a reasonable target distribution to normalize against without adding unwanted variation to the biological signals by including outlier arrays in the normalization process.
Although normalization will equalize the distribution of feature intensities across the arrays, there remains a
need to assess the quality of the data. For example, of 7 FFPE experiments submitted to Gene Expression Ominbus (GSE20140, GSE19977, GSE23368, GSE20017, GSE25727, GSE28064, and GSE21921) only the latter two studies acknowledged that array quality assessments were even conducted and neither of these two studies reported their findings [1,2,8,9,15-17]. Recently Chow et al. reported on their workflow of assessing array quality for FFPE samples
using the lumi pipeline [18]. Although this work is an
important initial step towards assessing the quality of array data using FFPE samples, the metrics used are based on measures of multidimensional dissimilarity; a con-cept that may be unfamiliar to the average researcher. Furthermore, thresholds for declaring a sample to be an outlier is study specific and thus make inter-study interrogation difficult.
In this work, we introduce two metrics that easily can be used to assess microarray quality regardless of the platform under consideration and have direct clinical interpretations. These two metrics are used 1) to measure how much data from a single microarray needs to be“stretched”during the normalization process in order to make its marginal distri-bution match with the remaining arrays (Stress) and 2) a measure of how much a single array deviates from the remaining arrays within the experiment post-normalization (dfArray). We compare our findings to currently available metrics for FFPE samples using the DASL assay and show the benefit of removing arrays of questionable quality from an experiment where differential expression is the primary objective.
Case study
[image:2.595.57.292.452.653.2]The case study consisted of patients with resected HER-2 positive breast cancer who were enrolled in the adjuvant N9831 trial (NCT00005970), which was a Phase III trial where patients were randomized to three arms: (Arm A) doxorubicin and cyclophospha-mide followed by weekly paclitaxel, (Arm B) same as Arm A but followed by 1 year of sequential trastu-zumab, or (Arm C) same as Arm A but with 1 year concurrent trastuzumab started the same day as weekly paclitaxel [19]. Patient consent was obtained for additional translational work related to the tumor specimens and the institutional review board of all participating institutions approved the study. A total of 1632 samples from 1460 unique patients were labeled using the Whole-Genome DASL HT Assay and hybridized on the HumanHT-12 v4 Expression BeadChip. Patient samples were randomized onto 96-well plates, stratified by treatment arm, year on N9831 study and nodal status. The final dataset used herein consists of 1618 arrays after removing subjects that had withdrawn consent post data acquisition.
Methods
Model specification
We begin with a description of a basic statistical model for microarray data and will follow the notation as described by McCall and others [20-23]. The basic physical architec-ture of a microarray is that a specific probe is designed to bind to a specific RNA transcript. The RNA is extracted according to the manufacture’s protocol and hybridized to an array. The observed intensityIijof the ith feature (i = 1,
. . ., p) from the jthsample (j = 1,. . ., n) is expressed
Iij¼KijθijφijþOij ð1Þ
The termOijrepresents background intensity present in the data due to scanner inefficiencies and non-specific binding of probes. This background is typically subtracted from the data using vendor-specific methods or user speci-fied packages. We leave it up to the user to specify which correction is to be used and simply move to the commonly used log-linear model form of (1)
Yij¼μijþSijþεij ð2Þ
Where Yijdenotes the intensity values after background correction,μij= log2θijrepresents the“true”relative amount of a feature hybridized to the array and is the primary
par-ameter of interest in microarray experiments, Sij=
log2Kij represents systematic biases, and εij=log2θij represents random variation with mean 0 and vari-ance σi with the subscript indicating that the variance is feature specific.
The termSijrepresents an arbitrary bias function for the ithfeature on the jtharray and is assumed to be independent of the remaining parameters in equation (2). Examples of biases might be variations in sample dilution that would add a constant value to probes on the array, or other more complicated effects. The bias function is estimated using any number of user-specified normalization routines of which the most popular is quantile normalization and is used throughout this work [14]. We denote the post-normalized data as
Yij0 ¼YijSij¼μijþε
0
ij ð3Þ
Review of other metrics
Bolstad et al. [24] and McCall et al. [20] introduced metrics to evaluate whether or not an array is an outlier based on the post-normalized dataY0ij. Bolstad’s first metric referred to as theRelative Log Expression(RLE) is defined as
RLE¼Yij0median
j Y
0
ij
and compares a given array’s feature intensity relative to the median level of intensity for that feature across all j arrays.
The array-specific distribution ofRLEis used to determine if a particular array has predominately low- or high-expressed features as indicated by an overall shift. This metric is easily applicable to any microarray platform. However, for normalization routines that leverage
probe-specific information such as loess, RLE ≅ 0 by
definition so one does not expect to see large shifts. Moreover, the spread in the distribution ofRLEis not inde-pendent of feature variance σi2. This makes distribution summaries difficult to interpret for the purpose of outlier detection as an outlier for a particular feature can be masked by the other features with large variance.
The next metric, first introduced by Bolstad (Normalized Unscaled Standard Error; NUSE) and later modified by
McCall (Global NUSE; GNUSE), was developed for
evaluating the quality of Affymetrix array data. Both measure array quality relative to the standard error of the estimated feature abundance. In the case of Affymetrix, the primary feature of interest is gene level expression and is estimated by taking a robust average of probe sequences (average of 11 probes per gene on the HGU133plus2 array). WhereasRLEis used to look for overall shifts in the distribution of intensity between arrays,NUSEandGNUSE
assess the variability of the estimated feature intensity across arrays and is defined as
GNUSEij¼
SE Yij0 medianj SE Yij0
The two measures only differ in that the GNUSE
metric uses distributional information onYij' from a large collection of stored arrays to estimate the denominator
medianj(SE(Yij')) whereas NUSEre-estimates this for each new experiment. Regardless of which form is used, if the
median NUSE or GNUSE for a particular array is high,
this would be an indication that many of the features are behaving poorly and thus the array should be considered
for removal. A value of 1.25 for the median NUSE or
GNUSE has been suggested by McCall as a guideline for identifying bad arrays as this suggests that the variation for the array is 25% higher than an average array.
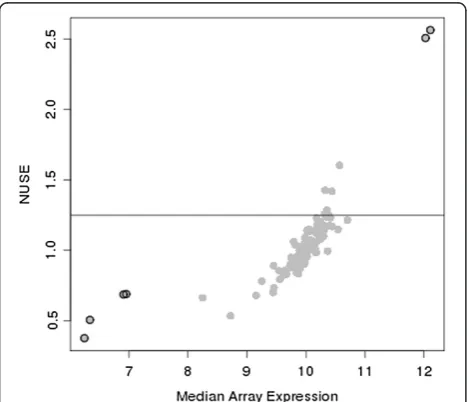
ofSE (Y0ij) for the calculation of NUSE. There are two fun-damental flaws to this approach. First, as shown in Figure 1, the NUSE metric is directly proportional to the median expression for an array. This indicates that arrays with samples having higher RNA concentrations will be penalized more than arrays with samples closer to the over-all median. Secondly, the criteria for determining an array as poor quality is purely one-sided and does not detect arrays where RNA concentrations are at the lower limits of detection (Figure 1). This is especially important for FFPE samples as there is a wide level of expression patterns with many arrays towards the lower limit of detection (Figure 2). Recently, Chow et al. described their quality
assess-ment workflow using thelumipackage developed by Du
et al. for DASL arrays [18,27]. This workflow is
summa-rized in Table 1. The main metric used in the lumi
package is the “distance to the average array”, which we will define as
lumiOutlierj¼dissimilarity Zij;Targeti
Where Zij represents the feature mean centered and
scaled pre- or post-normalized expression data for the ith feature from the jtharray andTargetirepresents a robust estimate of the feature mean across all arrays and is a cor-respondingly a pre- or post-normalized estimate (Table 1). The dissimilarity function used is either the Euclidean dis-tance of the jth array from theTarget or one minus the correlation between the jtharray and theTarget. Thelumi
package considers an array as an outlier whenever
lumiOutlierj>Th × median(lumiOutlierj) , whereThis a user-specified threshold (default specified in the package is
Th= 2). It is difficult to attribute a biologically meaningful interpretation of this metric in such a way as to make it easily transparent to the average researcher. Another drawback is that the threshold is defined relative to the current sample of arrays. Thresholds that are sample dependent are problematic in practice as they vary from batch-to-batch and provide no sense of glo-bal quality of an array beyond the average array within the current batch. If, for example, the average array is also of poor quality, the researcher is left with an experiment containing many poor arrays jeopardizing the validity of the study.
Proposed methods
To address the shortcomings of the metrics purposed thus far, we propose two metrics that combine the essence of
RLE, NUSE/GNUSE, and the lumiOutlier, yet are flexible enough to be implemented on a broad spectrum of microarray platforms with direct biological interpretation. Importantly for the analysis of archival tissues, the proposed metrics allow for the identification of poor arrays that have undue influence during the normalization process. Such arrays are fairly obvious to identify when evaluating data from fresh-frozen samples; however, it is less obvious to determine a threshold for determining poor samples with archival samples.
From Equation (3), Sij can be viewed as an estimate
[image:4.595.57.546.465.676.2]for the amount that each feature on an array needs to be
shifted for normalization; we refer to this as the Stress
measure due to its similarity to the same concept in multidimensional scaling. The overall distribution of
Stress captures the amount of deformation that was applied to an array during normalization. Since we are not concerned about arrays that differ from other arrays by a constant shift (e.g., the scanner was 50% brighter for one array compared to the others) the array-specific mean ofSijis subtracted, which leads to our first metric calledStressand is defined as
log2 Stressj
¼median S ijSj
and is calculated across all i features on a specific array. Thelog2is used here to indicate that the index will need to be transformed to the fold-change scale. Also, by taking the absolute value, features that are up or down regulated by“x-fold” are considered equallyStressed. Various distri-butional summaries and figures can be generated on
Stressj, but we found the median to be the most useful. Arrays can be rank ordered according to theirStressvalues, and the arrays with the highest or more disparate Stress
values would be considered as suspect for inclusion in the study. As an example, if the medianStressof an array is 2, this would indicate that half of the features had to be adjusted by 100% or more relative to their initial values. For many studies, a 2-fold change is the biological effect size of interest. Any final result becomes highly suspect when it is of the same order of magnitude as the biases that were removed from the data.
Although Stress provides a biologically meaningful
measure of how much the global distribution of a sam-ple will change during normalization, it does not lever-age feature-specific information. From Equation (3), and under the assumption that a preponderance of features on a microarray are not differentially expressed, an esti-mate of intensity for the ithfeature is simply the mean of that feature across the n arraysμ^i¼Yi0. Let^μið Þj denote the mean and sd ^μið Þj
denote the sample standard
deviation of the ithfeature by excluding the jtharray. We define our next metricdfArray(Deviation oF Array) as
dfArrayij¼
Yij0 μ^ið Þj sd ^μið Þj
ð4Þ
and is analogous to common diagnostic tests in linear regression modeling known as Cooks distance [28]. The numerator ofdfArrayis similar to the RLE metric proposed by Bolstad, butdfArrayis scaled by the standard deviation of the remaining arrays so that features are scaled both within and across arrays as the distribution of each feature will have a mean of zero and a standard deviation of one. Recalculation of Equation (4) for each array is computa-tionally tedious especially for large experiments and a more
efficient approach is to replace ^μið Þj and sd ^μið Þj
with
their corresponding robust estimates, which only need to be calculated once. In this work, we used the median expression of the ith feature in place of ^μið Þj and the
median absolute deviation in place of sd ^μið Þj
. We
have found various distribution summaries and figures of dfArray to be useful for quality assessment purposes, but as a single summary of this metric we use
dfArray¼quantile
i
dfArrayij
;0:75 ð5Þ
as values that fall above or below μ^ið Þj are viewed as equivalent errors. For this work we consider any array with 25% of the features having expression levels larger than twice the standard deviation above the median expression as suspect. This threshold can certainly be modified by the user and by expressing the cutoff in terms of standard deviations above the median expression level allows for a better reference of understanding amongst researchers with basic statistical training.
[image:5.595.56.540.112.236.2]As we show in the results,dfArrayis highly correlated with the dissimilarity metric used in the lumi package. Since the dissimilarity metric is used in clustering Table 1 Quality assessment strategies for Formalin Fixed Paraffin-Embedded tissues analyzed with Illumina’s DASL assay
Mahoney et al. Chow et al.
Normalize Data
CalculateStressanddfArray CalculateOutlierusing un-normalized raw data
(PlotStressvsdfArray)
Stage 1: Remove arrays withStress≥1.5 Stage 1: Remove arrays withOutlier≥Th*median(Outlier) (DefaultTh= 2)
Renormalize data after removing bad arrays Renormalize data after removing bad arrays
CalculatedfArrayon renormalized data CalculateOutlieron renormalized data
Stage 2: Investigate arrays withdfArray≥2 Stage 2: Remove arrays withOutlier≥Th*median(Outlier) (DefaultTh= 2)
procedures, this indicates that arrays with a large
dfArray index may be associated to clinical subclasses not accounted for in the normalization process. Our proposed quality assessment strategy for FFPE samples analyzed is outlined in Table 1 and the R package Stress.dfArray is freely available at http://mayoresearch.mayo.edu/mayo/ research/biostat/splusfunctions.cfm.
Results
Distributional characteristics of arrays
As described above, the case study used throughout con-sists of 1618 HumanHT-12 v4 Expression BeadChip DASL assays that were generated as part of an ongoing breast cancer study that analyzed FFPE archival tissues. Boxplots of the log2transformed intensity values showed that the quality of the data varied dramatically between the samples. Specifically, it was apparent that some of the samples failed completely, while there were other samples for which it appeared that some of the probes worked while other probes did not. Figure 2A displays box-plots of the pre-normalized expression values for 40 samples, representing various array qualities. For presentation purposes, samples were assigned to 4 array-quality groups
based on the interquartile range (IQR = Q3 – Q1) and
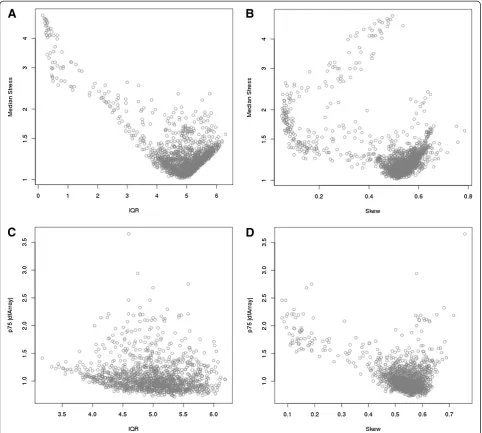
skewness (skew = (Q3-Q1)/IQR; symmetric distribution will have skew = 0.50) in order to represent the extremes in array quality and 10 representative samples are shown for each group. Approximately 15% of the 1618 FFPE samples examined exhibited large skewness (shown in quadrant R2), a small IQR (quadrant R3), or both (quadrant R4). Unlike data from fresh-frozen samples where only a couple of arrays might be poor and are obvious to detect, the distribution of intensity values from archival samples vary dramatically and there is not a clear threshold for determining which arrays are of poor quality.
Association of quality metrics with array characteristics The IQR and skewness thresholds used in Figure 2A to identify potentially poor-quality samples are ad hoc; how-ever, they do provide a reasonable first-pass look into the
data. As discussed above, GNUSE or NUSE cannot be
applied as the majority of the features on the DASL array do not have multiple probes nor is there a comprehensive archive of the HumanHT-12 v4 Expression Beadchip DASL assay to define a reference distribution. Figure 2B displays
box-plots of the RLE metric on the same set of arrays
shown in Figure 2A. From our experiences, it is difficult to detect striking deviations in the RLE across good and poor-quality samples. Thus, we applied the metrics
Stress,dfArray, andlumi Outlierin an attempt to identify poor-quality samples. First, we comparedStressagainst the
IQR (Figure 3A) and skewness (Figure 3A); Stress was
calculated using quantile normalization. Arrays with a low IQR have a high median Stressindicating that the global
distribution for these arrays would require the most
“stretching” during normalization (Figure 2A). Similarly, there is a general tendency for arrays with higher levels of skewness to also have high medianStress(Figure 3B). Using 1.5 as a threshold, we removed all arrays with median
Stress≥1.5 and subsequently calculateddfArrayand further
compared dfArray to IQR (Figure 3C) and skewness
(Figure 3D). Even after removing arrays based on their global distributions usingStress,dfArray shows that arrays of questionable quality might remain. Specifically, we see that there are arrays with large IQR that might be of poor quality (Figure 3C). Additionally, there are arrays of various skewness levels that might be of poor quality (Figure 3D).
Concordance of quality metrics
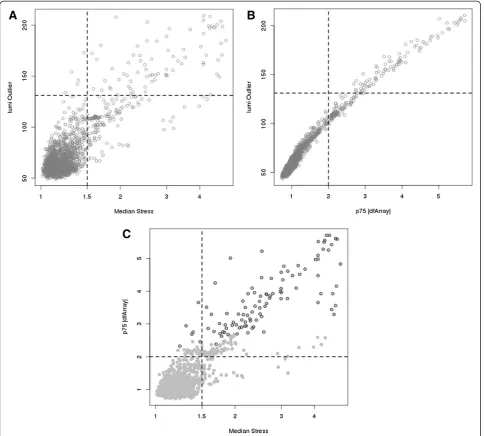
lumiOutlierhas been proposed as a quality-control metric specifically for Illumina microarrays and thus we evaluated the concordance betweendfArray,Stress, andlumi Outlier. As displayed in Figure 4A,Stressandlumi Outlierare cor-related; the suggested threshold for outlier determination for each method is indicated. Using the suggested thresh-olds,Stressidentified most of the samples thatlumi Outlier
did as well as additional arrays. Similarly, we see the direct association betweendfArrayandlumi Outlieras anticipated as both metrics are functions of Equation 4 (Figure 4B). Cleary,dfArrayandlumi Outliercould be calibrated to the same scale, but dfArrayis already on a scale of biological relevance as it expressed the deviation of an array in units of standard deviation of the features being measured. This is a natural metric for deciding intuitive threshold values a prior and holds across studies. Conversely, there is vague-ness in determining a threshold value for a distance metric such as that used bylumi Outlierand the threshold is data dependent. Figure 4C displays the correlation between
dfArrayandStressusing quantile normalization on all 1618 arrays, where the open circles indicate arrays that are
considered outliers by lumi Outlier. Arrays with the
highest Stress also tend to have relatively large dfArray
values and together they capture all the arrays that would be considered outliers bylumi Outlier.
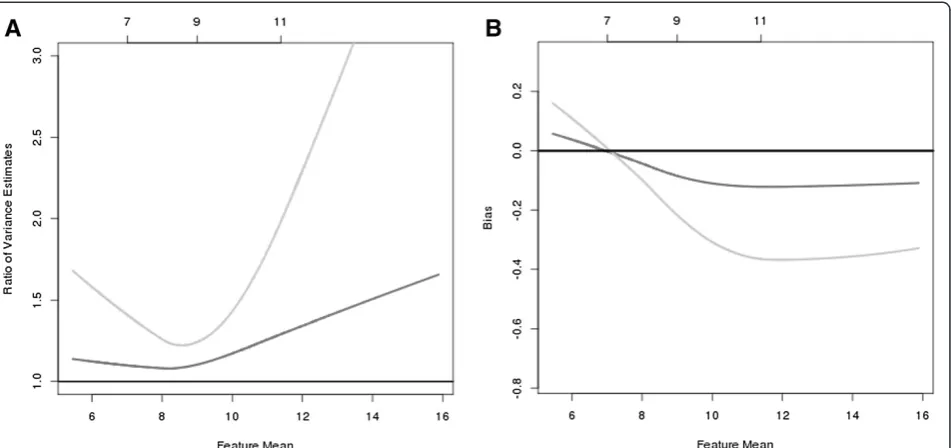
Figure 5A displays the ratio of the feature variances relative to the feature variance of the 1378 reference arrays when additional arrays are included. When none of the questio-nable arrays are excluded (i.e., adding the 100 + 140 arrays that were considered as bad quality for any of the three methods; light gray line), the feature variance is at least 25% larger than the variance in the reference sample and becomes increasingly larger for both low- and high-intensity values. When excluding only the 100 arrays that were considered as outliers by all three methods (or when including the 140 arrays that were considered questionable by onlyStress/dfArray) , Figure 5A shows that the relative increase in variance is approximately 5% to 10% higher for low-intensity features but is 50% larger for high-intensity
features (dark grey line). Similarly, the bias in the estimated feature abundance is highest when including all of the questionable arrays and is lower, but still present, when excluding only the 100 arrays that were considered ques-tionable by all three methods. Again, biologically we antici-pate that only a relatively small number of features are truly differentially expressed between samples and there-fore we would not expect to see any shifts in the estimated mean or variance of feature intensities when including or excluding any number of arrays.
Discussion
[image:7.595.57.540.89.522.2]The use of microarrays in understanding disease patho-genesis has seen extraordinary growth over the last decade.
Historically, data generated by this technology has been used for class comparisons (comparing gene expression profiles between known disease states), class prediction (prediction of disease state), and class discovery (identifica-tion of new subclasses of disease base on gene expression profiles). Recently, interest has moved from the bench to the bed side where treatment decisions based on gene-expression profiles obtained from microarrays are being considered [29]. In fact, this is the objective of the current case study; to define a molecular signature to predict response to trastuzumab for HER2-positive breast cancer patients.
[image:8.595.57.542.89.525.2]As the use of microarrays has increased, so to have the concerns about the validity of this technology [30-33]. Some of these concerns broadly revolve around proper analytical methods, the concordance of results between publications, centers, or laboratories, and the concor-dance of results between different platforms, to name just a few. Several research initiatives have formed over the years to investigate these concerns dating back to the early days of “Affycomp” [34] to the more recent formation of the External RNA Control Consortium and the MicroArray Quality and Countrol projects [30]. These efforts have facilitated greater communication between researchers as
Figure 4Plot oflumi Outlierversus medianStress(A) and 75thpercentile absolute value of
dfArray(B) with reference dashed lines indicating the respective threshold for outlier detection for each method.Plot of medianStressversus 75thpercentile absolute value of
well as the development of standard practices to increase the validity of microarray technologies. The overarching theme resulting from these efforts is that microarray tech-nologies are reliably reproducible across many different settings with proper laboratory procedures, data handling, and scrutiny. Several investigations have reported on the gain in analytic efficiency when poor-quality microarrays are removed [20,35]. However, most and if not all of this work has centered on analysis of fresh-frozen samples.
Analysis of archival tissues presents a new challenge and is complicated by poor RNA quality and significant variation among FFPE samples that have been preserved over the course of many years and under different conditions. As we have shown here, this variation in sample quality for FFPE samples creates large variation in the expression profiles across arrays that are typically not seen when dealing with fresh-frozen samples. This has spurred many questions regarding the normalization, quality assessment, and analysis of array based studies using FFPE samples [10].
The choice of normalization routine may have an impact on downstream analyses when it comes to FFPE samples. Many of the FFPE samples in the present study exhibit a high prevalence of“dead probes”where little or no signal is generated beyond background. Many of the more popular normalization routines (e.g., quantile, loess) used in practice were developed on data where the prevalence of dead probes was very small. Therefore, we believe additional studies are required to determine the best
normalization strategy for data that is generated from the FFPE samples.
It is important to note that normalization is not the end all step to preprocessing microarray data and certainly not a solution for poorly-designed studies. Assessing the quality of microarray data is essential and the two metrics proposed here,Stress anddfArray, are easily applicable to any microarray platform for this purpose. For studies using FFPE samples, removing arrays that are of poor quality from the normalization process reduces the bias in the estimated feature abundance and the noise level in the data and thus increases the ability to detect biologically-meaningful differences. Some have suggested that the infor-mation provided by the quality metrics could also be used to weight downstream analyses towards arrays with better quality [36]. This is potentially a viable option for studies using FFPE samples, but more research is needed. We anticipate that the arrays identified by the Stressmetric as being an outlier have the greatest influence on the normalization process and therefore will need to be excluded. However, theStressmetric could be recomputed after removing outliers and either the newly-computed
Stress metric or dfArray could be used to down weight arrays during differential-expression analyses.
[image:9.595.63.539.89.313.2]As more high dimensional data become publicly available, there is an increasing interest to pool data across studies, or at the very least, mine these repositories for promising biomarker signatures prior to initiating a research project. At our institution, such an endeavor is
Figure 5The relative increase in feature variance (A) and bias in the estimated feature intensity (B) bynotexcluding any array ( light gray line ) and excludingonlythe arrays that were considered to be an outlier by thelumi Outlier( medium gray line ).The 25th, 50th,
and 75thpercentiles of feature intensity for the 1378 arrays are listed along the top of the figure and the reference lines at 1 (A) and 0 (B)
being implemented through the creation of the Biologically Oriented Repository Architecture (BORA), which is an informatics warehouse of “-omics” data that is linked to the tissue pathology and clinical characteristics of the patient. These types of initiatives require robust quality metrics to accurately assess high dimensional data across multiple studies especially when the data has been preprocessed and summarized prior to storage.
Findings
Two robust quality control metrics are presented that pro-vide the end-users with valuable information regarding the quality of the arrays within their study. These metrics are directly applicable to any high-dimensional platform and can be easily implemented into preprocessing pipelines.
Availability and requirements Package name: Stress.dfArray
Package source: http://mayoresearch.mayo.edu/mayo/re-search/biostat/splusfunctions.cfm
Requirements: R-2.14.0 or later (http://www.r-project. org/)
Abbreviations
RLE: Relative Log Expression; NUSE: Normalized Unscaled Standard Error; GNUSE: Global Normalized Unscaled Standard Error;dfArray: Deviation of array; DASL: cDNA-mediated Annealing Selection extension and Ligation; Th: Threshold; FFPE: Formalin-Fixed, Parriffin-Embedded; Q1,Q3: First and third quartiles; IQR: Interquartile range; SE: Standard Error; sd: Standard deviation.
Competing interests
The authors declare that they have no competing interests.
Authors’contributions
DWM, TMT, SKA and JE-P developed the statistical methodology. JJ, JPAK, MMR and EAP provided guidance on the statistical methodologies. MMR and EAP provided the case study. All authors read and approved the final manuscript.
Acknowledgements
We thank Giovanni Parmigiani, PhD, for helpful discussions regarding the content of the manuscript and the Mayo Clinic Gene Expression Core for generating all of the DASL data used in this study. This work was supported in part by the National Institutes of Health [Grant #s CA25224, CA114740, and CA129949], the Breast Cancer Research Foundation, Mayo Clinic Cancer Center, and the Mayo Clinic Center for Individualized Medicine.
Funding
This work was supported in part by the National Institutes of Health [Grant #s CA25224, CA114740, and CA129949], the Breast Cancer Research Foundation, Mayo Clinic Cancer Center, and the Mayo Clinic Center for Individualized Medicine.
Author details
1
Biomedical Statistics and Informatics, Mayo Clinic, 200 First Street SW, Rochester, MN 55905, USA.2Clinical Studies & Translational Diagnostics,
Ventana Medical Systems, Inc., 1910 E. innovation Park Drive, Tucson, AZ 85755, USA.3Hematology Oncology, Mayo Clinic, 4500 San Pablo Road,
Jacksonville, FL 32224, USA.
Received: 10 August 2012 Accepted: 18 January 2013 Published: 30 January 2013
References
1. Waddell N, Cocciardi S, Johnson J, Healey S, Marsh A, Riley J, da Silva L, Vargas AC, Reid L, Simpson PT,et al:Gene expression profiling of formalin-fixed, paraffin-embedded familial breast tumours using the whole genome-DASL assay.J Pathol2010,221(4):452–461.
2. Sadi AM, Wang DY, Youngson BJ, Miller N, Boerner S, Done SJ, Leong WL: Clinical relevance of DNA microarray analyses using archival formalin-fixed paraffin-embedded breast cancer specimens.BMC Cancer2011, 11:253–251. 213.
3. Ton CC, Vartanian N, Chai X, Lin MG, Yuan X, Malone KE, Li CI, Dawson A, Sather C, Delrow J,et al:Gene expression array testing of FFPE archival breast tumor samples: an optimized protocol for WG-DASL sample preparation.Breast Cancer Res Treat2011,125(3):879–883.
4. Bibikova M, Talantov D, Chudin E, Yeakley JM, Chen J, Doucet D, Wickham E, Atkins D, Barker D, Chee M,et al:Quantitative gene expression profiling in formalin-fixed, paraffin-embedded tissues using universal bead arrays. Am J Pathol2004,165(5):1799–1807.
5. Fan JB, Yeakley JM, Bibikova M, Chudin E, Wickham E, Chen J, Doucet D, Rigault P, Zhang B, Shen R,et al:A versatile assay for high-throughput gene expression profiling on universal array matrices.Genome Res2004, 14(5):878–885.
6. Bibikova M, Yeakley JM, Chudin E, Chen J, Wickham E, Wang-Rodriguez J, Fan JB:Gene expression profiles in formalin-fixed, paraffin-embedded tissues obtained with a novel assay for microarray analysis.Clin Chem 2004,50(12):2384–2386.
7. April C, Klotzle B, Royce T, Wickham-Garcia E, Boyaniwsky T, Izzo J, Cox D, Jones W, Rubio R, Holton K,et al:Whole-genome gene expression profiling of formalin-fixed, paraffin-embedded tissue samples.PLoS One 2009,4(12):e8162.
8. Fountzilas E, Markou K, Vlachtsis K, Nikolaou A, Arapantoni-Dadioti P, Ntoula E, Tassopoulos G, Bobos M, Konstantinopoulos P, Fountzilas G,et al: Identification and validation of gene expression models that predict clinical outcome in patients with early-stage laryngeal cancer.Ann Oncol 2012,23(8):2146–2153.
9. Minguez B, Hoshida Y, Villanueva A, Toffanin S, Cabellos L, Thung S, Mandeli J, Sia D, April C, Fan JB,et al:Gene-expression signature of vascular invasion in hepatocellular carcinoma.J Hepatol2011,55(6):1325–1331. 10. Waldron L, Simpson P, Parmigiani G, Huttenhower C:Report on emerging
technologies for translational bioinformatics: a symposium on gene expression profiling for archival tissues.BMC Cancer2012,12:124. 11. Kerr MK, Churchill GA:Experimental design for gene expression
microarrays.Biostatistics2001,2(2):183–201.
12. Kerr MK, Churchill GA:Statistical design and the analysis of gene expression microarray data.Genet Res2001,77(2):123–128. 13. Ballman KV, Grill DE, Oberg AL, Therneau TM:Faster cyclic loess:
normalizing RNA arrays via linear models.Bioinformatics2004, 20(16):2778–2786.
14. Bolstad BM, Irizarry RA, Astrand M, Speed TP:A comparison of normalization methods for high density oligonucleotide array data based on variance and bias.Bioinformatics2003,19(2):185–193. 15. Toffanin S, Hoshida Y, Lachenmayer A, Villanueva A, Cabellos L, Minguez B,
Savic R, Ward SC, Thung S, Chiang DY,et al:MicroRNA-based classification of hepatocellular carcinoma and oncogenic role of miR-517a. Gastroenterology2011,140(5):1618–1628. e1616.
16. Villanueva A, Hoshida Y, Battiston C, Tovar V, Sia D, Alsinet C, Cornella H, Liberzon A, Kobayashi M, Kumada H,et al:Combining clinical, pathology, and gene expression data to predict recurrence of hepatocellular carcinoma.Gastroenterology2011,140(5):1501–1512. e1502.
17. Winn ME, Shaw M, April C, Klotzle B, Fan JB, Murray SS, Schork NJ:Gene expression profiling of human whole blood samples with the Illumina WG-DASL assay.BMC Genomics2011,12:412.
18. Chow ML, Winn ME, Li HR, April C, Wynshaw-Boris A, Fan JB, Fu XD, Courchesne E, Schork NJ:Preprocessing and quality control strategies for illumina DASL assay-based brain gene expression studies with semi-degraded samples.Front Genet2012,3:11.
19. Perez EA, Suman VJ, Davidson NE, Gralow JR, Kaufman PA, Visscher DW, Chen B, Ingle JN, Dakhil SR, Zujewski J,et al:Sequential versus concurrent trastuzumab in adjuvant chemotherapy for breast cancer.J Clin Oncol 2011,29(34):4491–4497.
21. Wu Z, Irizarry RA:A statistical framework for the analysis of microarray probe-level data.Ann Appl Stat2007,1:333–357.
22. Huber W, von Heydebreck A, Sültmann H, Poustka A, Vingron M:Variance stabilization applied to microarray data calibration and to the quantification of differential expression.Bioinformatics2002,18(suppl 1): S96–S104.
23. Rocke DM, Durbin B:A model for measurement error for gene expression arrays.J Comput Biol2001,8(6):557–569.
24. Bolstad BM, Collin F, Simpson KM, Irizarry RA, Speed TP:Experimental design and low-level analysis of microarray data.Int Rev Neurobiol2004, 60:25–58.
25. Ritchie ME, Dunning MJ, Smith ML, Shi W, Lynch AG:BeadArray expression analysis using bioconductor.PLoS Comput Biol2011,7(12):e1002276. 26. Kim RS, Lin J:Multi-level mixed effects models for bead arrays.
Bioinformatics2011,27(5):633–640.
27. Du P, Kibbe WA, Lin SM:Lumi: a pipeline for processing illumina microarray.Bioinformatics2008,24(13):1547–1548.
28. Myers RH:Classical and modern regression with applications. 2nd edition. Boston: PWS-KENT; 1990.
29. Making the most of microarrays.Nat Biotechnol2006,24(9):1039. 30. Shi L, Reid LH, Jones WD, Shippy R, Warrington JA, Baker SC, Collins PJ, de
Longueville F, Kawasaki ES, Lee KY,et al:The MicroArray quality control (MAQC) project shows inter- and intraplatform reproducibility of gene expression measurements.Nat Biotechnol2006,24(9):1151–1161. 31. Tong W, Lucas AB, Shippy R, Fan X, Fang H, Hong H, Orr MS, Chu TM, Guo
X, Collins PJ,et al:Evaluation of external RNA controls for the assessment of microarray performance.Nat Biotechnol2006,24(9):1132–1139. 32. Canales RD, Luo Y, Willey JC, Austermiller B, Barbacioru CC, Boysen C,
Hunkapiller K, Jensen RV, Knight CR, Lee KY,et al:Evaluation of DNA microarray results with quantitative gene expression platforms. Nat Biotechnol2006,24(9):1115–1122.
33. Shi L, Campbell G, Jones WD, Campagne F, Wen Z, Walker SJ, Su Z, Chu TM, Goodsaid FM, Pusztai L,et al:The MicroArray quality control (MAQC)-II study of common practices for the development and validation of microarray-based predictive models.Nat Biotechnol2010,28(8):827–838. 34. Irizarry RA, Wu Z, Jaffee HA:Comparison of affymetrix GeneChip
expression measures.Bioinformatics2006,22(7):789–794.
35. Parmigiani G, Garrett-Mayer ES, Anbazhagan R, Gabrielson E:A cross-study comparison of gene expression studies for the molecular classification of lung cancer.Clin Cancer Res2004,10(9):2922–2927.
36. Ritchie ME, Diyagama D, Neilson J, van Laar R, Dobrovic A, Holloway A, Smyth GK:Empirical array quality weights in the analysis of microarray data.BMC Bioinforma2006,7:261.
doi:10.1186/1756-0500-6-33
Cite this article as:Mahoneyet al.:Quality assessment metrics for whole genome gene expression profiling of paraffin embedded samples.BMC Research Notes20136:33.
Submit your next manuscript to BioMed Central and take full advantage of:
• Convenient online submission
• Thorough peer review
• No space constraints or color figure charges
• Immediate publication on acceptance
• Inclusion in PubMed, CAS, Scopus and Google Scholar
• Research which is freely available for redistribution