Open Access
Short Report
Advanced spot quality analysis in two-colour microarray
experiments
Mikalai Yatskou
1,2, Eugene Novikov
3,4,5, Guillaume Vetter
1,2, Arnaud Muller
1,
Emmanuel Barillot
3,4,5, Laurent Vallar
1and Evelyne Friederich*
1,2Address: 1Microarray Center/LBMAGM, CRP-Santé, 84 Rue Val Fleuri, L-1526, Luxembourg, 2Cytoskeleton and Cell Plasticity Laboratory, Life
Sciences Research Unit, University of Luxembourg, 162A Avenue de la Faïencerie, L-1511, Luxembourg, 3Institut Curie, Service Bioinformatique,
Institute Curie, 26 Rue d'Ulm, Paris, F-75248, France, 4INSERM, U900, Paris, F-75248, France and 5Ecole des Mines de Paris, Fontainebleau,
F-77300, France
Email: Mikalai Yatskou - [email protected]; Eugene Novikov - [email protected]; Guillaume Vetter - [email protected]; Arnaud Muller - [email protected]; Emmanuel Barillot - [email protected]; Laurent Vallar - [email protected]; Evelyne Friederich* - [email protected]
* Corresponding author
Abstract
Background: Image analysis of microarrays and, in particular, spot quantification and spot quality control, is one of the most important steps in statistical analysis of microarray data. Recent methods of spot quality control are still in early age of development, often leading to underestimation of true positive microarray features and, consequently, to loss of important biological information. Therefore, improving and standardizing the statistical approaches of spot quality control are essential to facilitate the overall analysis of microarray data and subsequent extraction of biological information.
Findings: We evaluated the performance of two image analysis packages MAIA and GenePix (GP) using two complementary experimental approaches with a focus on the statistical analysis of spot quality factors. First, we developed control microarrays with a priori known fluorescence ratios to verify the accuracy and precision of the ratio estimation of signal intensities. Next, we developed advanced semi-automatic protocols of spot quality evaluation in MAIA and GP and compared their performance with available facilities of spot quantitative filtering in GP. We evaluated these algorithms for standardised spot quality analysis in a whole-genome microarray experiment assessing well-characterised transcriptional modifications induced by the transcription regulator SNAI1. Using a set of RT-PCR or qRT-PCR validated microarray data, we found that the semi-automatic protocol of spot quality control we developed with MAIA allowed recovering approximately 13% more spots and 38% more differentially expressed genes (at FDR = 5%) than GP with default spot filtering conditions.
Conclusion: Careful control of spot quality characteristics with advanced spot quality evaluation can significantly increase the amount of confident and accurate data resulting in more meaningful biological conclusions.
Published: 17 September 2008
BMC Research Notes 2008, 1:80 doi:10.1186/1756-0500-1-80
Received: 20 June 2008 Accepted: 17 September 2008 This article is available from: http://www.biomedcentral.com/1756-0500/1/80
© 2008 Friederich et al; licensee BioMed Central Ltd.
Background
Microarray technology allows gaining novel insights into different biological phenotypes by studying genome-wide differences in gene expression profiles [1,2]. Many efforts have been made to standardize microarray data analysis pipelines [3,4]. Several initiatives such as the MAQC project showed that standardising data analysis proce-dures improved performance of microarray platforms [5]. A critical component of the microarray data analysis pipe-line is image analysis. Any error made at this stage of the analysis may propagate throughout the pipeline invalidat-ing final biological conclusions such as differential expression or gene network establishment. Among the various approaches aiming at improving microarray anal-ysis, one of the most important and less formalized is the evaluation of the quality of spots obtained in microarray experiments [6]. Too stringent spot quality requirements can result in filtering-out relevant spots and loss of useful biological information. Conversely, too flexible filtering conditions will conserve bad spots leading to wrong pre-dictions. This situation is mainly observed when analys-ing weak or contaminated spots which yet might contain important biological information. Numerous studies are aimed at improving the control of microarray spot quality including spot quality assessment [7] and filtering [8], evaluation of normalisation procedures [9], missing val-ues imputation [10], comparison of different spot quality-assessing algorithms [11]. However, there is still a lack of consistent and standardized methodology for microarray image analysis using advanced algorithms for automated spot quality evaluation.
Several software tools, such as AMIA [12], Matarray [13], MASQOT-GUI [14], Tiger Spotfinder [15], MAIA [16], which are based on standardized, semi-automated strate-gies for microarray image analysis are currently available for academic users. GenePix Pro (Molecular Devices, Sun-nyvale, CA, USA) is a representative commercial software that is routinely used. Among reported software [for a brief overview see Additional file 1] GenePix (GP) and MAIA have distinct advantages. GP provides automated and user-friendly tools for microarray gridding, feature alignments, data management, and graphical representa-tion of the results. GP has also funcrepresenta-tionality for spot qual-ity analysis, in particular, a filter system for flagging spots as "good" (Flag = 100) or "bad" (Flag = 0) based on a user-defined set of conditions for the GP parameters. However, this facility is not automated and spot qualification in GP is highly dependent on user decisions. We have chosen MAIA as a representative example of an automated spot quality treatment allowing to save spots containing useful biological information [16]. MAIA implements a compact set of statistical algorithms for microarray image analysis, including algorithms for the spot quality analysis at the pixel level. MAIA assigns to each ratio estimate a quality
score ranging from 0 to 1. This score is calculated from 10 main quality characteristics reflecting different spot prop-erties within the microarray.
Here, we developed advanced spot quality evaluation methodologies for MAIA and GP. These approaches were evaluated experimentally and compared to the default parameter filtering settings provided in GP. The precision and accuracy of spot quantification procedures were veri-fied using microarrays with a priori known ratios of Cy5 to Cy3 intensities and biological relevance was assessed by comparing differentially expressed genes and significantly over-represented gene ontology (GO) categories in a whole-genome transcriptomic microarray experiment. Our results show that advanced spot quality evaluation methodologies developed in MAIA give slightly more accurate and precise Log2 ratios of signal intensities allow-ing to recover more useful spots and differentially expressed genes when compared with the default spot fil-tering procedure in GP.
Methodology for spot quality evaluation Semi-automatic pipeline in MAIA
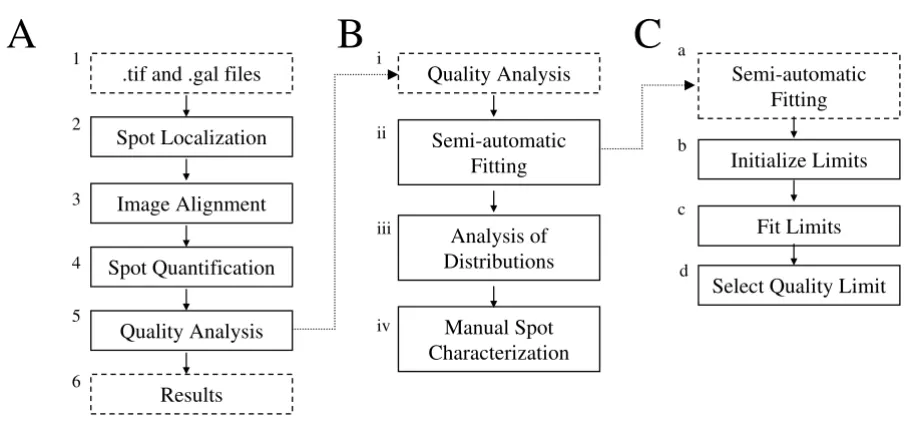
The main principles of the semi-automatic image analysis in MAIA are briefly outlined [6]. The general image processing workflow is shown in Figure 1A. In Block 1, raw data, i.e. .tif and .gal (GenePix Array List) files, are imported in the program, whereupon the automatic image analysis procedure is launched: Spot Localization
(Block 2), Image Alignment (Block 3), Spot Quantification
(Block 4) and Quality Analysis (Block 5). Part of the proce-dure presented in Figure 1A, Blocks 1–4, is also applicable to GP. To standardize procedures for spot quality evalua-tion in MAIA, we expand the block Quality Analysis (Block 5) into three main steps, presented in Figure 1B: semi-automatic fitting of the quality parameter weights (Block ii), analysis of the histograms/distributions of the quality parameters (Block iii); and manual spot characterization (Block iv). Semi-automatic fitting (Figure 1C) of the qual-ity parameter weights can only be launched for an image comprising replicated spots [6]. In Block b the initializa-tion of the quality parameter limits is performed. The quality parameter weights are then fitted in Block c Fit Limits, yielding appropriate parameter limits for quality assessment. In Block d a proper value of the Quality Limit
Spot filtering in GP
Many microarray studies performed with GP use standard or default settings of GP criteria and parameter limits for filtering spot features. An example of the use of default
parameters in GP, named here standard parameters, is shown in Table 1[17]. However, the standard set of GP parameters is not always optimal and may result in losing many informative spots. To systematize GP filtering, we
[image:3.612.80.533.114.329.2]The workflow diagram of the semi-automatic analysis pipeline in MAIA Figure 1
The workflow diagram of the semi-automatic analysis pipeline in MAIA. (A) Main scheme of the semi-automatic analysis pipeline in MAIA. (B) Scheme of the spot quality analysis using the quality parameters. (C) Scheme of the semi-auto-matic fitting of the parameter limits.
Spot Localization
Image Alignment
Spot Quantification
Quality Analysis
Results
.tif and .gal files Quality Analysis
Initialize Limits
Fit Limits Semi-automatic
Fitting
Analysis of Distributions
Manual Spot Characterization
Semi-automatic Fitting
Select Quality Limit
A
B
C
1
2
3
4
5
6
i
ii
iii
iv
a
b
c
d
Table 1: The GP parameters and limits for different filtering conditions in GP.
Filtering conditions
Parameter Strong Medium Weak Standard
1 Dia. >= 120 >= 100 >= 70 NR
2 % > B635+2SD > 98 > 95 > 66 > 55*
3 % > B532+2SD > 98 > 95 > 66 > 55
4 F635% Sat. < 1 < 5 < 10 < 2–3
5 F532% Sat. < 1 < 5 < 10 < 2–3
6 Rgn Ratio (635/532) > 0 > 0 > 0 NR
7 Rgn R2 (635/532) > 0.8 > 0.6 > 0.4 > 0.5
8 Circularity > 85 > 80 > 50 > 80
9 F635 Median – B635 > 600 > 400 > 200 NR
10 F532 Median – B532 > 600 > 400 > 200 NR
11 SNR 635 > 10 > 5 > 2 > 3
12 SNR 532 > 10 > 5 > 2 > 3
13 Flags >= 0 >= 0 >= 0 >= 0
[image:3.612.55.557.513.702.2]tested various sets of the GP parameters and their cutoff values to define a set of parameters preserving a maximum of informative spots. We analysed 56 parameters provided by GP and classified them into nine groups, representing logically-formalized properties of a spot in a microarray [see Additional file 1]. These groups were established using hierarchical clustering with the Pearson centered metrics applied to a representative microarray. By com-bining proper parameter representatives of each correla-tion group with spot properties, we reduced the full set of the GP parameters to a limited number of the most repre-sentative parameters which were further used for auto-matic filtering in GP. From the distributions, we defined three groups of filtering conditions for detecting "good" spots associated with three levels of filtering stringency (weak, medium and strong/stringent) and corresponding to 1, 2, and 3 STD borders of the tails in the parameter dis-tributions. List of selected GP parameters and summary of the estimated parametric constrains are shown in Table 1. Additionally, so-called standard configuration of default GP parameters and filtering limits provided in the GP and Acuity software [17] are given in Table 1 and are used in the following analysis.
Microarray analysis pipeline
A brief overview of steps common to MAIA and GP of our microarray analysis pipeline (normalization, preprocess-ing, aso) are given below.
The overall flow of statistical analysis of microarray data performed in this study is shown in Figure 2. Data processing starts with import of the scanned microarray image files (.tif files) and GenePix Array List file (.gal file), in Block 1. Block 2–4 represents microarray image analy-sis that can be performed either by MAIA or GP. Image Analysis consists of Spot Localization (Block 2), Spot Quan-tification (Block 3) and Spot Quality Analysis (Block 4). For Spot Quality Analysis, the spots are further quantified using several statistical quality factors, which are also used in subsequent filtering (Block 5). The microarray data are normalized (Block 6), and then series of microarray data are combined in one dataset table (Block 7) for prelimi-nary treatment, which includes procedures of dye-swap transformation, evaluation and correction of genes with missing values, data centring and scaling, data visualisa-tions (box plots, histograms of the Log2 ratios, MA-plots). Differential analysis of gene expression data from repli-cated microarrays is done (Block 8), differentially expressed genes at the accepted false-discovery rate are identified (Block 9) and then submitted for GO mining (Block 10). The results of GO mining are analyzed (Block 11) to identify the relative enrichment of significant func-tional categories. The data analysis pipeline yields lists of differentially expressed genes and significantly enriched biological categories (Block 12). Microarray data are
vali-dated using the RT-PCR or qRT-PCR techniques applied to a set of selected genes (Block 13).
Experimental evaluation of standardized approaches for spot quality assessment using control microarrays with a priori known fluorescence ratios
Spot quality can be evaluated in terms of i) accuracy and precision of the obtained ratio estimates and ii) quantita-tive characterization of various spot defects or systematic distortions, such as dust, donut-shaped spots, smears, outliers, saturated and high-background pixels, non-lin-ear foreground and background signals. First, we evalu-ated the accuracy and precision of the algorithms for ratio estimation. For this purpose, we developed five dedicated microarrays referred as to control chips using the Arabi-dopsis thaliana spike RNA control set produced by the Institute for Genomic Research [18]. The control microar-rays actually consist of three populations of spots further noted as down-, invariant-, and up- features [see Additional file 2]. Spots deemed as relevant by both MAIA and GP in all five microarray replicates were selected and the corre-sponding means of signal intensity Log2 ratio were ana-lysed. First, we directly compared non-normalized data of
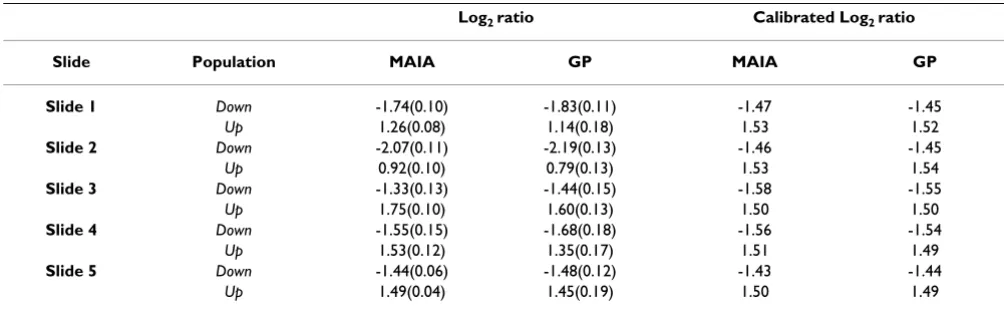
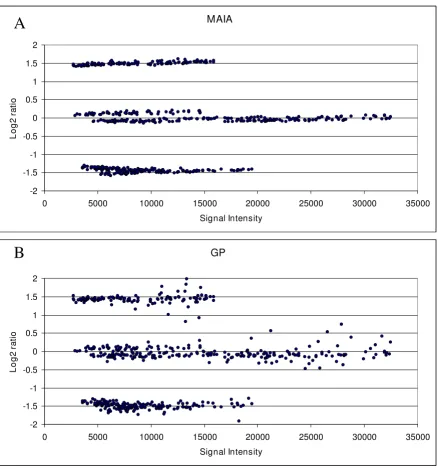
down- and up-features immediately after spot quantifica-tion. Then, we compared these data upon calibration to remove any linear bias introduced by the quantification algorithms. This transformation consisted in a linear nor-malization of the Log2 ratios so that the set of invariant fea-tures, i.e. features with 1:1 theoretical ratios, was centred. A brief summary of comparison of 5 control slides is given in Table 2 (for a full version of Table 2 see Additional file 3). The plots Log2 Ratio vs Intensity of a typical control microarray obtained in MAIA (top) and GP (bottom) are shown in Figure 3. Three groups of spots were found with mean Log2 ratios corresponding to those expected, but being more dispersed when analysed using GP. We also noted that MAIA gives more precise estimations of the Log2 ratios. Analysis of the relative errors showed that esti-mations of the Log2 ratios by MAIA were on average 5–7%
Overall flow diagram of the statistical analysis of microarray data Figure 2
Overall flow diagram of the statistical analysis of microarray data.
Filtering
Normalization
Pre-treatment
Differential
Analysis
GO mining
GO Analysis
Gene Listing and
Functional
Categories
.tif and .gal files
1
5
6
7
8
10
11
12
Image Analysis
Spot Quality
Analysis
Lists of DE Genes
4
9
RT-PCR
13
Spot Quantification
3
Spot Localization
procedure [20], these estimates are robust and better pre-serve precision of the final ratios.
Collectively, our data show that MAIA generally gives slightly more accurate and precise Log2 ratios. An addi-tional processing step or a proper calibration of the data is therefore needed in GP to smooth out the differences in Log2 ratios between the programs. This should allow con-serving more informative spots in the follow-up analysis.
Evaluation of the performances of the image analysis methodologies in a comparative gene expression study using whole-genome arrays
Although accuracy and precision of the ratio estimates are important for reliable follow-up analysis, the major prob-lem in microarray studies comes from deficient spots that when being improperly treated, may obscure the final conclusions. However, while stringent filtering conditions allow eliminating such bad spots, they also might lead to the loss of good, informative spots.
Our artificial microarrays with the known ratios are of very good overall quality and therefore they are not appro-priate to evaluate algorithms for quantitative characteriza-tion of various spot deficiencies or systematic distorcharacteriza-tions. To evaluate the developed filtering procedures, we used oligonucleotide microarrays measuring genes which are differentially expressed in human MCF-7 epithelial breast carcinoma cells after induction of the transcription regu-lator SNAI1 [see Additional file 2]. SNAI1 directly represses the expression of a set of genes triggering thereby a well-described transcriptomic program which leads to the transition of epithelial cells to a mesenchymal pheno-type [21]. Because functional categories of genes that are up- or down-regulated during this process are well-charac-terized [22], we considered this experimental model
suit-able to further evaluate the performance of the image analysis procedures. We used cells transfected with the human SNAI1-cDNA cloned in a tetOff conditional expression system. Expression profiles before and after SNAI1 induction (time points 0 and 96 hours, a sample at time point 0 was a reference) were analyzed using oligo-nucleotide two-color microarrays purchased from the "University Medical Center of Utrecht" (UMCU, The Netherlands) [23]. The microarray images were analysed either by MAIA or GP as described in Figure 2. We applied the semi-automatic approach for the spot quality assess-ment in MAIA and four filtering conditions – standard, weak,medium, and strong (defined in the Table 1) – for the spot quality assessment in GP. For the analysis in GP, we arbitrarily selected one microarray out of the 9 in the series and performed automatic gridding and spot quanti-fication procedures. Weak, medium and strong/stringent fil-tering conditions were defined as described in Additional file 1 by considering 1, 2 and 3 STD borders in the distri-butions of the GP parameters (see in Table 1). We used the default GP filtering parameters as standard.
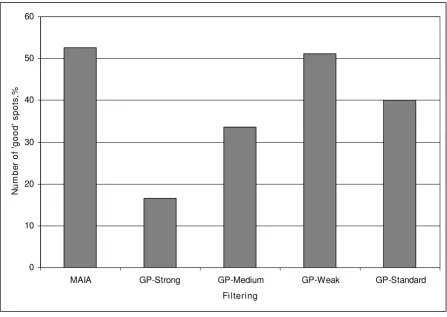
[image:6.612.53.555.101.258.2]The average number of spots deemed as "good" using MAIA and GP programs, calculated as a percentage of total number of spots in a microarray (25 392), is plotted in Figure 4. MAIA detected 13%, 19%, and 36% more "good" spots than GP with standard, medium and strong fil-tering conditions, respectively. Moreover, the number of good-quality spots found with MAIA, 53%, was compara-ble to that obtained by the GP-weak filtering, 51%. Obvi-ously, the proportion of "good"-quality spots might be increased technically by releasing filtering conditions defined by cutoff values for the GP parameters. This would lead to an increase of the number of true "good" spots (true positives), but would also generate more false "good" spots (false positives). We found that a majority of
Table 2: Mean Log2ratio obtained from analysis of five control slides by MAIA and GP.
Log2 ratio Calibrated Log2 ratio
Slide Population MAIA GP MAIA GP
Slide 1 Down -1.74(0.10) -1.83(0.11) -1.47 -1.45
Up 1.26(0.08) 1.14(0.18) 1.53 1.52
Slide 2 Down -2.07(0.11) -2.19(0.13) -1.46 -1.45
Up 0.92(0.10) 0.79(0.13) 1.53 1.54
Slide 3 Down -1.33(0.13) -1.44(0.15) -1.58 -1.55
Up 1.75(0.10) 1.60(0.13) 1.50 1.50
Slide 4 Down -1.55(0.15) -1.68(0.18) -1.56 -1.54
Up 1.53(0.12) 1.35(0.17) 1.51 1.49
Slide 5 Down -1.44(0.06) -1.48(0.12) -1.43 -1.44
Up 1.49(0.04) 1.45(0.19) 1.50 1.49
Log2 ratio vs Signal Intensity scatter plots obtained by MAIA (A) and GP (B) for a selected control microarray Figure 3
Log2 ratio vs Signal Intensity scatter plots obtained by MAIA (A) and GP (B) for a selected control microarray. The fixed number of down-, invariant-, and up- features, found "good" by both programs, is selected for the statistical compari-son. Procedures of girding and image quantifications were done automatically as recommended in the corresponding manuals of MAIA and GP. A control microarray consists of three populations of spots with expected Log2 ratios of -1.58 (3:1), 0 (1:1),
and 1.58 (1:3) [see Additional file 2]. Data yielded by the GP analysis are more dispersive. We assume that no normalisation procedure is required for these data even at low signal intensities, where the experimental data may deviate from the theoret-ical values. Data are not calibrated and not normalized.
MAIA
-2 -1.5 -1 -0.5 0 0.5 1 1.5 2
0 5000 10000 15000 20000 25000 30000 35000
Signal Intensity
L
og2
r
a
ti
o
GP
-2 -1.5 -1 -0.5 0 0.5 1 1.5 2
0 5000 10000 15000 20000 25000 30000 35000
Signal Intensity
Lo
g2
r
a
ti
o
A
the spots identified as "good" in MAIA but not in GP, independent of the stringency of the filtering procedure in GP, were associated with saturated and/or contaminated pixels or with low signals or high background levels [see Additional file 4]. To address the biological relevance of these extra "good" spots found in MAIA compared to GP, we further analyzed the differentially expressed (DE) genes. To determine their significance level and their bio-logical value we used the SAM and GoMiner programs, respectively [24,25]. The SAM (Significance Analysis of Microarrays) is a modified t-test for finding significantly expressed genes in a set of microarray experiments. GoM-iner, a program package, organizes lists of DE genes from a microarray experiment for gene ontology-based biolog-ical interpretation. This analysis provides quantitative and
statistical output on enrichment or depletion of bio-cate-gories of DE genes.
To identify the DE genes from the "good" spot datasets produced by MAIA and GP we applied one-class response type of SAM. Summary of the SAM plots resulting from the analysis of each (MAIA or GP) "good" spot dataset is shown in Figure 5. At the cutoff FDR = 5% the MAIA spot quality analysis preserved 12% more significant genes than GP weak filtering conditions, 38% and 47% more significant genes than GP standard and medium filtering conditions and even more (85%) with more stringent GP filtering conditions. The number of DE genes found after
medium and standard filtering was in a close range, remain-ing at the same proportion as for deemed "good" spots.
[image:8.612.82.530.93.410.2]Average number of "good" spots obtained from spot quality analysis of the whole-genome microarrays using MAIA and four fil-tering approaches in GP
Figure 4
Average number of "good" spots obtained from spot quality analysis of the whole-genome microarrays using MAIA and four filtering approaches in GP. Series of nine whole-genome microarrays, slides containing 25 392 spots (21 521 70-mers and 3 871 control spots, Operon, human whole genome version 2.0), were printed onto Corning UltraGAPS slides with 48 subgrids of 23 × 23 spots. Differential expression of genes after SNAI1 induction was analysed. Data were ana-lysed using the semi-automatic approach for the spot quality assessment in MAIA and four filtering conditions – standard, weak, medium, and strong (defined in the Table 1) – for the spot quality assessment in GP resulting in two groups of spots: "good" and "bad". The bars show the average number of "good" spots, calculated as a mean of nine microarrays, obtained from spot quality analysis either by MAIA or GP. Results are expressed as percentages relative to the total number of spots in each microarray.
0 10 20 30 40 50 60
MAIA GP-Strong GP-Medium GP-Weak GP-Standard
Filtering
N
u
m
b
e
r of
'
good'
s
pot
s
The SAM plots of the nine whole-genome microarrays resulted from spot quality analysis in MAIA and GP Figure 5
The SAM plots of the nine whole-genome microarrays resulted from spot quality analysis in MAIA and GP. (A) Number of called genes [24] versus the false discovery rate (FDR) as resulted after SAM analysis of gene lists generated by MAIA and GP-associated analysis. (B) The number of differentially expressed genes (called genes) at FDR = 5 and 1% found by SAM.
A
B
0 500 1000 1500 2000 2500 3000 3500 4000 4500 5000
MAIA GP-Strong GP-Medium GP-Weak GP-Standard
C
a
ll
e
d ge
ne
s
FDR = 5%
FDR = 1% 0
1000 2000 3000 4000 5000 6000 7000 8000 9000
0.00 0.05 0.10 0.15 0.20 0.25 0.30 0.35 0.40
FDR
C
a
ll
e
d ge
ne
s
GP-Standard
GP-Weak
GP-Medium
GP-Strong
However, medium and standard filtering yielded about 38– 47% less DE genes than those obtained by analysis in MAIA. In addition the GP weak filtering did not yield as many DE genes when compared with MAIA, albeit the input was similar, 51 and 53%, respectively. Nevertheless, the list of the GP weak DE genes exceeded over those obtained from the GP standard and medium filtering con-ditions. This is additional proof that the default filtering parameters in GP may be sub-optimal and need to be improved and to be automated. The GP strong filtering gave the shortest list of DE, corresponding to 20% of the MAIA DE gene list, and to highly-expressed genes in the study, i.e. genes associated with high-quality spots in the arrays.
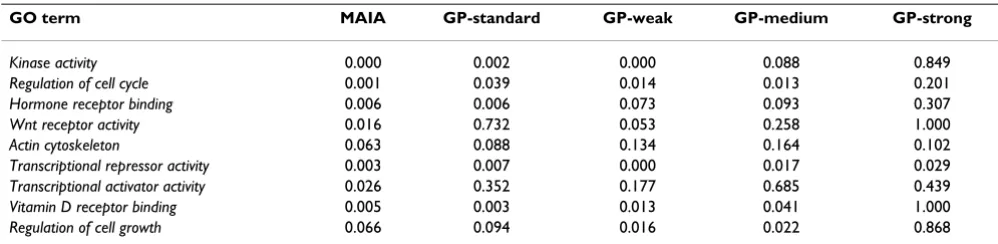
Significant DE genes identified by SAM analysis (FDR cut-off 5%) of all "good"-quality spots in MAIA and GP were submitted to GoMiner to identify the over-represented GO categories as compared to the overall GO categories represented on the whole microarray. GO analysis high-lighted a marked enrichment in GO categories in the gene dataset obtained from MAIA. Indeed, 278 enriched GO categories were identified in the dataset from MAIA, com-pared with 179 from GP-standard, 202 from GP-weak, 204 from GP-medium, and 112 from GP-strong (p-value cutoff 5%, FDR cutoff 30%) [see Additional file 5]. Interestingly, the GP-weak filtering did not introduce much more bio-logical terms than the GP-standard filtering, indicating that lowering the spot filtering conditions in GP did not improve gene data mining or statistical significance of the GO categories. Analysis of the GO terms after the
GP-standard filtering revealed that the majority of functional categories were similar to those obtained by MAIA although leading to higher p-values and FDR scores [see Additional file 5]. When considering GO categories potentially playing an important role in SNAI1 activity and EMT process, p-values of the Fisher exact test resulting from the GoMiner analysis were slightly lower with MAIA dataset than those obtained with GP (Table 3). Among the
GO categories listed in Table 3, some were most impor-tant bio-functions involved in the EMT processes. For example, the categories regulation of cell cycle and cell growth indicated a direct blocking of these functions, after the ectopic expression of the SNAI1 protein [26]. Wnt -pathway is known to contribute to the EMT [27] and Vita-min D receptor has been shown recently to be directly reg-ulated by the SNAI1 protein [28]. Finally, ectopic expression of SNAI1 target genes is involved in the estab-lishment of cytoskeleton organization [29]. Our results suggested that the larger number of significant DE genes obtained in MAIA is related to the net increase in enriched GO categories. This could be very helpful when analysing the contribution of groups of genes in specific biological processes.
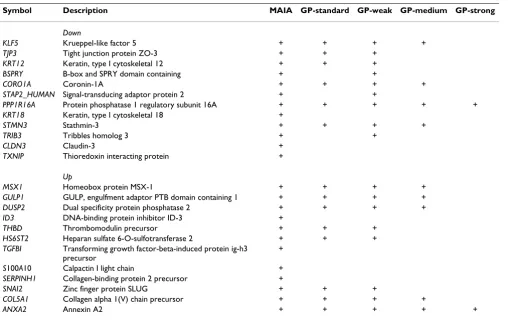
To compare various spot quality evaluation approaches using MAIA and GP, we established a list of bone fide DE genes. To do so, we first randomly selected about a hun-dred genes based on their differential expression behav-iour and their confirmed or potential function in EMT, as supported by literature search. This approach enabled us enriching the list for "true" DE genes. Out of this first list, we randomly selected 24 genes the differential expression of which was confirmed by the RT-PCR and qRT-PCR (Table 4). Then, we determined how many of these 24 confirmed genes were detected by various spot quality evaluation approaches. Summary of this comparison, including genes annotation and description, is presented in Table 4. 14 genes were detected using the GP-standard
conditions, 17, 9, 2 were included in the GP-weak,
GP-medium, GP-strong lists, respectively. All 24 genes were found in the MAIA DE gene list.
Conclusion
Altogether, our data indicate that MAIA is a robust micro-array image analysis program allowing a more accurate spot quantification and an improved collection of signifi-cant and relevant DE genes compared to GP. When
con-Table 3: p-values of selected GO categories resulted from the different conditions of analysis.
GO term MAIA GP-standard GP-weak GP-medium GP-strong
Kinase activity 0.000 0.002 0.000 0.088 0.849
Regulation of cell cycle 0.001 0.039 0.014 0.013 0.201
Hormone receptor binding 0.006 0.006 0.073 0.093 0.307
Wnt receptor activity 0.016 0.732 0.053 0.258 1.000
Actin cytoskeleton 0.063 0.088 0.134 0.164 0.102
Transcriptional repressor activity 0.003 0.007 0.000 0.017 0.029
Transcriptional activator activity 0.026 0.352 0.177 0.685 0.439
Vitamin D receptor binding 0.005 0.003 0.013 0.041 1.000
Regulation of cell growth 0.066 0.094 0.016 0.022 0.868
Several biological categories with a well-established role in epithelial to mesenchymal transition (EMT) were selected for comparison in terms of the p-values. p-values obtained for the GP-strong gene list have the weakest statistical meaning. Statistical results yielded from GP-standard, weak, and
[image:10.612.54.553.568.690.2]sidering GO categories potentially playing an important role in SNAI1 activity and EMT process, statistically enriched categories obtained by a GoMiner analysis had slightly lower p-values with MAIA dataset than those obtained with GP. Due to a larger number of significant DE genes, MAIA ensures a net increase in enriched GO cat-egories. This could be very helpful when looking for sub-tle contribution of some biological processes. More generally, this study showed that careful control of spot quality characteristics with advanced spot quality evalua-tion can significantly increase the amount of meaningful data yielding more confident and accurate biological con-clusions.
Competing interests
The authors declare that they have no competing interests.
Authors' contributions
MY developed the advanced spot quality evaluation pro-cedures in GP and MAIA and drafted the manuscript. EN assisted in improving spot quality analysis in MAIA and drafted the manuscript. GV carried out the whole-genome
microarray experiment, RT-PCR and qRT-RTP validation experiments. AM conducted the gene annotation mining and analysis. LV developed the control microarrays, con-tributed to gene-expression experiments, and drafted the manuscript. EF, LV, and EB conceived the study, partici-pated in its design and coordination. All authors read and approved the final manuscript.
Additional material
Additional file 1
Methodology for spot quality evaluation. Technical details of the image analysis procedures using semi-automatic pipeline in MAIA and analysis of the parameters and spot filtering in GP. A brief overview of freeware image analysis software is giving.
Click here for file
[http://www.biomedcentral.com/content/supplementary/1756-0500-1-80-S1.pdf]
Symbol Description MAIA GP-standard GP-weak GP-medium GP-strong
Down
KLF5 Krueppel-like factor 5 + + + +
TJP3 Tight junction protein ZO-3 + + +
KRT12 Keratin, type I cytoskeletal 12 + + +
BSPRY B-box and SPRY domain containing + +
CORO1A Coronin-1A + + + +
STAP2_HUMAN Signal-transducing adaptor protein 2 + +
PPP1R16A Protein phosphatase 1 regulatory subunit 16A + + + + +
KRT18 Keratin, type I cytoskeletal 18 +
STMN3 Stathmin-3 + + + +
TRIB3 Tribbles homolog 3 + +
CLDN3 Claudin-3 +
TXNIP Thioredoxin interacting protein +
Up
MSX1 Homeobox protein MSX-1 + + + +
GULP1 GULP, engulfment adaptor PTB domain containing 1 + + + +
DUSP2 Dual specificity protein phosphatase 2 + + + +
ID3 DNA-binding protein inhibitor ID-3 +
THBD Thrombomodulin precursor + + +
HS6ST2 Heparan sulfate 6-O-sulfotransferase 2 + + +
TGFBI Transforming growth factor-beta-induced protein ig-h3 precursor
+
S100A10 Calpactin I light chain +
SERPINH1 Collagen-binding protein 2 precursor +
SNAI2 Zinc finger protein SLUG + + +
COL5A1 Collagen alpha 1(V) chain precursor + + + +
ANXA2 Annexin A2 + + + + +
RT-PCR and qRT-PCR analysis of 24 selected genes was performed to validate microarray data. Then, the presence of these genes in lists of DE genes obtained in the whole-genome microarray experiment was determined using different spot quality evaluation approaches in MAIA and GP. Fourteen genes were detected using the GP-standard conditions, 17, 9, 2 were present in the GP-weak, GP-medium, GP-strong lists,
[image:11.612.56.564.98.418.2]Acknowledgements
This work was supported by the Luxembourg National Science Foundation, Project BIOSAN FNR/01/04/09, the Centre National de Recherche France, CNRS. Authors thanks Dr. André Mehlen and Mr. François Bernardin for their assistance in preparing microarrays. We thank the Institute for Genomic Research for providing the A. thaliana control spiking cRNA vec-tor set.
References
1. Hoheisel JD: Microarray technology: beyond transcript profil-ing and genotype analysis. Nat Rev Genet 2006, 7(3):200-210. 2. Muller J, Mehlen A, Vetter G, Yatskou M, Muller A, Chalmel F, Poch
O, Friederich E, Vallar L: Design and evaluation of Actichip, a thematic microarray for the study of the actin cytoskeleton.
BMC genomics 2007, 8:294.
3. Pelizzola M, Pavelka N, Foti M, Ricciardi-Castagnoli P: AMDA: an R package for the automated microarray data analysis. BMC Bioinformatics 2006, 7:335.
4. Demeter J, Beauheim C, Gollub J, Hernandez-Boussard T, Jin H, Maier D, Matese JC, Nitzberg M, Wymore F, Zachariah ZK, et al.: The Stanford Microarray Database: implementation of new anal-ysis tools and open source release of software. Nucleic Acids Res
2007:D766-770.
5. Shi L, Reid LH, Jones WD, Shippy R, Warrington JA, Baker SC, Collins PJ, de Longueville F, Kawasaki ES, Lee KY, et al.: The MicroArray Quality Control (MAQC) project shows inter- and
intraplat-form reproducibility of gene expression measurements. Nat Biotechnol 2006, 24(9):1151-1161.
6. Novikov E, Barillot E: An algorithm for automatic evaluation of the spot quality in two-color DNA microarray experiments.
BMC Bioinformatics 2005, 6:293.
7. Raffelsberger W, Dembele D, Neubauer MG, Gottardis MM, Grone-meyer H: Quality indicators increase the reliability of micro-array data. Genomics 2002, 80(4):385-394.
8. Tran PH, Peiffer DA, Shin Y, Meek LM, Brody JP, Cho KW: Microar-ray optimizations: increasing spot accuracy and automated identification of true microarray signals. Nucleic Acids Res 2002, 30(12):e54.
9. Wang D, Zhang CH, Soares MB, Huang J: Systematic approaches for incorporating control spots and data quality information to improve normalization of cDNA microarray data. J Biop-harm Stat 2007, 17(3):415-431.
10. Johansson P, Hakkinen J: Improving missing value imputation of microarray data by using spot quality weights. BMC Bioinfor-matics 2006, 7:306.
11. Sauer U, Preininger C, Hany-Schmatzberger R: Quick and simple: quality control of microarray data. Bioinformatics 2005, 21(8):1572-1578.
12. White AM, Daly DS, Willse AR, Protic M, Chandler DP: Automated Microarray Image Analysis Toolbox for MATLAB. Bioinfor-matics 2005, 21(17):3578-3579.
13. Wang X, Ghosh S, Guo SW: Quantitative quality control in microarray image processing and data acquisition. Nucleic Acids Res 2001, 29(15):E75-75.
14. Bylesjo M, Sjodin A, Eriksson D, Antti H, Moritz T, Jansson S, Trygg J: MASQOT-GUI: spot quality assessment for the two-channel microarray platform. Bioinformatics 2006, 22(20):2554-2555. 15. Saeed AI, Sharov V, White J, Li J, Liang W, Bhagabati N, Braisted J,
Klapa M, Currier T, Thiagarajan M, et al.: TM4: a free, open-source system for microarray data management and analysis. Bio-techniques 2003, 34(2):374-378.
16. Novikov E, Barillot E: Software package for automatic microar-ray image analysis (MAIA). Bioinformatics 2007, 23(5):639-640. 17. Verdnik D: Guide to microarray analysis. In Application Note
Axon Instruments Inc; 2004.
18. Wang HY, Malek RL, Kwitek AE, Greene AS, Luu TV, Behbahani B, Frank B, Quackenbush J, Lee NH: Assessing unmodified 70-mer oligonucleotide probe performance on glass-slide microar-rays. Genome Biol 2003, 4(1):R5.
19. Jia H, Lu L, Hng SC, Li J: Simulation study of ratio calculation formulae of two-colour cDNA microarray data. Appl Bioinfor-matics 2006, 5(4):255-266.
20. Novikov E, Barillot E: A robust algorithm for ratio estimation in two-color microarray experiments. J Bioinform Comput Biol
2005, 3(6):1411-1428.
21. Cano A, Perez-Moreno MA, Rodrigo I, Locascio A, Blanco MJ, del Bar-rio MG, Portillo F, Nieto MA: The transcription factor snail con-trols epithelial-mesenchymal transitions by repressing E-cadherin expression. Nat Cell Biol 2000, 2(2):76-83.
22. Peinado H, Olmeda D, Cano A: Snail, Zeb and bHLH factors in tumour progression: an alliance against the epithelial pheno-type? Nat Rev Cancer 2007, 7(6):415-428.
23. Roepman P, Wessels LF, Kettelarij N, Kemmeren P, Miles AJ, Lijnzaad P, Tilanus MG, Koole R, Hordijk GJ, Vliet PC van der, et al.: An expression profile for diagnosis of lymph node metastases from primary head and neck squamous cell carcinomas.
Nature genetics 2005, 37(2):182-186.
24. Chu G, Narasimhan B, Tibshirani R, Tusher V: Significance analysis of microarrays (sam) software. The Internet 2003 [http://www-stat.stanford.edu/~tibs/SAM/].
25. Zeeberg BR, Qin H, Narasimhan S, Sunshine M, Cao H, Kane DW, Reimers M, Stephens RM, Bryant D, Burt SK, et al.: High-Through-put GoMiner, an 'industrial-strength' integrative gene ontol-ogy tool for interpretation of multiple-microarray experiments, with application to studies of Common Varia-ble Immune Deficiency (CVID). BMC Bioinformatics 2005, 6:168. 26. Vega S, Morales AV, Ocana OH, Valdes F, Fabregat I, Nieto MA: Snail blocks the cell cycle and confers resistance to cell death.
Genes Dev 2004, 18(10):1131-1143.
27. Yook JI, Li XY, Ota I, Fearon ER, Weiss SJ: Wnt-dependent regu-lation of the E-cadherin repressor snail. J Biol Chem 2005, 280(12):11740-11748.
Additional file 2
Methods. Microarray fabrication, preparation of spiked RNA samples, microarray experiments, establishment of MCF-7 cell lines conditionally expressing SNAI1, RT-PCR and quantitative RT-PCR (qRT-PCR), statis-tical analysis of microarray data, software.
Click here for file
[http://www.biomedcentral.com/content/supplementary/1756-0500-1-80-S2.pdf]
Additional file 3
Summary of results obtained from the analysis of five control slides by MAIA and GP. The full version of Table 2 including p-values from the paired t-test and estimated errors for the Log2 ratio.
Click here for file
[http://www.biomedcentral.com/content/supplementary/1756-0500-1-80-S3.xls]
Additional file 4
Informative spots in the whole-genome microarray. Figure shows the images (left) and the Cy5/Cy3 scatter plots (right) of two typical inform-ative spots that were removed by any filtering in GP and saved in MAIA during analysis of the whole-genome microarray data obtained in the SNAI1 induction experiment. (A) – A spot affected by a relatively high saturation effect, (B) – A spot affected by a high background intensity effect.
Click here for file
[http://www.biomedcentral.com/content/supplementary/1756-0500-1-80-S4.pdf]
Additional file 5
Results of gene ontology analysis. Results of bio-categories and statistical scores obtained from the gene ontology analysis.
Click here for file
Publish with BioMed Central and every scientist can read your work free of charge "BioMed Central will be the most significant development for disseminating the results of biomedical researc h in our lifetime."
Sir Paul Nurse, Cancer Research UK
Your research papers will be:
available free of charge to the entire biomedical community
peer reviewed and published immediately upon acceptance
cited in PubMed and archived on PubMed Central
yours — you keep the copyright
Submit your manuscript here:
http://www.biomedcentral.com/info/publishing_adv.asp
BioMedcentral S, Puig I, Rodriguez R, de la Fuente R, Bernad A, et al.: The
transcrip-tion factor SNAIL represses vitamin D receptor expression and responsiveness in human colon cancer. Nat Med 2004, 10(9):917-919.