T E C H N I C A L N O T E
Open Access
Accelerating large-scale protein structure
alignments with graphics processing units
Bin Pang
1, Nan Zhao
1, Michela Becchi
2, Dmitry Korkin
1,3and Chi-Ren Shyu
1,3*Abstract
Background:Large-scale protein structure alignment, an indispensable tool to structural bioinformatics, poses a tremendous challenge on computational resources. To ensure structure alignment accuracy and efficiency, efforts have been made to parallelize traditional alignment algorithms in grid environments. However, these solutions are costly and of limited accessibility. Others trade alignment quality for speedup by using high-level characteristics of structure fragments for structure comparisons.
Findings:We presentppsAlign, a parallel protein structure Alignment framework designed and optimized to exploit the parallelism of Graphics Processing Units (GPUs). As a general-purpose GPU platform,ppsAligncould take many concurrent methods, such as TM-align and Fr-TM-align, into the parallelized algorithm design. We evaluated
ppsAlignon an NVIDIA Tesla C2050 GPU card, and compared it with existing software solutions running on an AMD dual-core CPU. We observed a 36-fold speedup over TM-align, a 65-fold speedup over Fr-TM-align, and a 40-fold speedup over MAMMOTH.
Conclusions:ppsAlignis a high-performance protein structure alignment tool designed to tackle the
computational complexity issues from protein structural data. The solution presented in this paper allows large-scale structure comparisons to be performed using massive parallel computing power of GPU.
Background
Large-scale protein structure comparison is becoming a more and more important approach to providing a bet-ter picture for understanding biological systems [1,2]. Given a database of protein structures, the main goal is either to find proteins that are structurally similar to a given protein (i.e., one-against-all comparison) or to build various connectivity among proteins by performing exhaustive comparisons on the whole database (i.e., all-against-all comparison). The results of structural com-parison are useful in discovering potential structural, evolutionary, and functional relationships among these proteins and have significant impact on structure-based drug design [3], protein-protein docking [4], and other biological findings [5]. Recently, the dramatic increase in protein structural data [6] has led to an ever increasing demand for structure alignment tools that can not only find accurate alignments at residue level but also
complete large-scale structure comparisons in a reason-able time.
Several approaches have been developed to address the limitations of traditional alignment methods and tackle the computational issues. The traditional align-ment methods [1,2,7], such as DALI [8], CE [9], TM-align [10], Fr-TM-TM-align [11], and MAMMOTH [12], are based on the comparison of residues or fragments to build initial alignments which are optimized by various procedures, such as Monte-Carlo, combinational search, and dynamic programming. These methods can provide accurate alignments at the residue level but are usually computationally expensive, which makes them infeasible in coping with very large datasets. To accelerate this process, one approach is to map the protein structures into 1D sequences and then use various sequence align-ment methods to align two structures [13,14]. Another
approach [15] utilizes a“bag of words” method, which
depends on frequency of specific structural patterns, to provide speedy structure match and filtering. These approaches significantly improve efficiency for large datasets; however, this is often achieved at the cost of * Correspondence: [email protected]
1Informatics Institute, University of Missouri, Columbia, MO, USA Full list of author information is available at the end of the article
loss of topological details, which could lead to lower accuracy than the traditional structural comparison methods or could be unsuitable to perform residue-level alignment. Another approach is to parallelize traditional algorithms using a cluster or grid environment consist-ing of thousands of computconsist-ing nodes [16,17]. These approaches can fulfill the desires of efficiency and accu-racy but require high-performance computing environ-ments which are energy-consuming and may not be accessible to the biologists.
With the increase in performance and programmabi-lity of many-core Graphic Processing Units (GPUs), more and more bioinformatics applications have been deployed on GPUs and have shown promising results in terms of speedup over their conventional CPU imple-mentations. Liu et al. [18] implemented a GPU-based Smith-Waterman algorithm [19] for pair-wise DNA sequence alignment. Later, the efficiency of sequence alignments has been continuously improved in [20-23]. Vouzis and Sahinidis developed GPU-BLAST (Basic Local Alignment Search Tool) [24] to accelerate NCBI-BLAST [25]. Hung et al. developed a method for calcu-lating RMSD (Root Mean Square Deviation) after super-position for ATI GPU card [26]. Stivala et al. utilized simulated annealing (SA) to develop a protein substruc-ture searching algorithm, SA Tableau Search, to find structural motif at level of secondary structure element (SSE) [27]. It is worth mentioning that from the litera-ture the SA Tableau Search is the first attempt to apply GPU in protein structure comparison at the SSE level. Other applications include protein-protein docking [28] and statistical phylogenetics [29].
In this paper, we presentppsAlign, aparallel protein structure Alignmentframework which is designed and optimized to exhaustively exploit the parallelism of the GPU architecture for residue-level structure compari-sons. Our experimental results (reported on a NVIDIA
Tesla C2050 GPU card) show thatppsAlignsignificantly
outperforms existing structural alignment tools in com-putational efficiency.
We believe that GPU’s massive parallel computing
power can unlock the door to a cost-effective and high-performance computing environment that can be bene-ficial to the structural biology community.
Findings
Overview
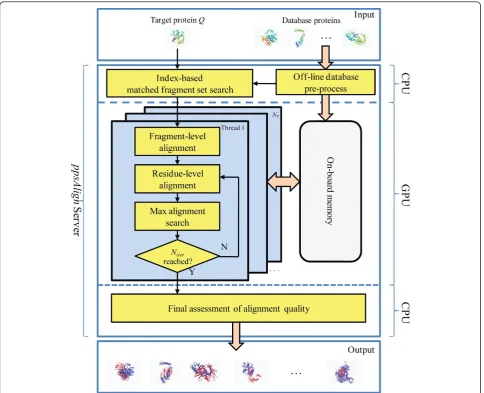
The framework of ppsAlignis shown in Figure 1. The
inputs include a target protein and a protein databaseΛ = {P1,P2, ...., Pn}. The outputs are structure alignments
between the target protein and each database protein. The online alignment starts with a generation of some initial sets of matched fragments and corresponding alignments. Then, the initial alignments are extended
and refined using Dynamic Programming to obtain the final results. Specifically, the ppsAlignalgorithm consists of 5 steps: 1) Index-based matched fragment set (MFS) search is utilized to find the maximal Nseedseed MFS’
between the target protein and each database protein; 2)
Fragment-level alignment is used to assemble the MFS’
and generate initial alignments; 3) Residue-level align-ment is used to refine the initial alignalign-ments to residue alignments; 4) Maximal alignment search is used to find a transformation that can best superimpose the entire target protein over each database protein based on the obtained residue alignments; 5) Final assessment is per-formed to calculate z-Score and evaluate statistical sig-nificance of alignments. Steps 1) and 5) are executed on the CPU core, while steps 2) ~ 4), the most
time-con-suming parts ofppsAlign, are implemented as GPU
ker-nels and iteratively executed on GPU for Niter times.
The GPU kernels are developed using CUDA (Compute Unified Device Architecture) programming model [30]. During the alignment, the protein structures and inter-mediate results from each GPU kernel are stored in
GPU’s on-board memory, such as read-only constant
memory, read-only texture memory, and read-write glo-bal memory. Generally, the constant and texture mem-ory have limited capacity but high access rate compared to the global memory. For an overview of GPU architec-ture and CUDA model, readers are referred to [30,31]. To facilitate the search of structurally similar fragments from the protein database,ppsAlignhas an off-line com-ponent that pre-processes substructures from the entire protein database and builds an indexing tree to allow fast retrievals.
Index-based matched fragment set search
The purpose of this CPU-based step is to quickly find
all possible matched fragment sets (MFS’) between the
target protein and each database protein for further refinement based on an information retrieval (IR) approach which goes beyond the capability of the
tradi-tional “bag of words” concept by introducing spatial
relationships among these fragments. Let
Q=q1,q2,. . .,qLQ
and P=p1,p2, ..., pLp
be a target protein with LQresidues and a database protein withLP
residues, respectively. Here,q andprepresent 3D coor-dinates of the Caatoms. A fragmentfis a set of Lf( =
8) continuous residues with the direction fromN
term-inal to Cterminal along the protein backbone. A MFS
includes two non-empty subsets, FQandFP, which
con-tain an order of fragments that conforms to some
cri-teria of structural similarity between Q and P,
respectively. The fragments in a MFS will then be used
to generate a rough alignment between QandP in the
The MFS search utilizes the substructure mapping method of the Index-based Substructure Alignment algorithm [32], developed by the authors, to retrieve similar fragments from the database proteins. In this method, substructures of the database proteins, extracted by a large set of pairs of windows along the backbones, are indexed off-line by an indexing tree in which similar substructures are clustered into same leaf node, denoted by tiΛ, and one substructure is selected as representative for each leaf node. Such representative structures preserve certain topological information, both locally and globally, from two disjoint substructures with various ranges of distances. Similarly, substructures
in the target proteinQare indexed by an indexing tree
in which each leaf node is denoted by tiQ. The
represen-tative substructure of each tQi is used to search the
indexing tree of database and a list of best matchedtΛis returned. For simplicity, we usetto denote tiQ andtΛ. The database proteins that have substructures intΛcan be found by an inverted index. Such a database protein,
P, can be represented by an order of substructures,
denoted by Ωt, occurring int. Likewise, the proteinQ
can be represented by an order of substructures,
denoted by ΩQ
t , occurring in t. As substructures
identi-fied by the same t are similar, they can be used as
“anchors” for rough alignments. For detailed explanation of the substructure mapping method, readers are referred to [32].
In ppsAlign, substructures are further projected into fragments as follows: if any residue of a substructure from ΩtP (or ΩQ
t ) is located in a fragment, the
[image:3.595.57.542.88.481.2]frag-ment is selected and added to FP(orFQ). The fragment
subsetsFPandFQare used to construct a MFS between
the protein Q and P. After searching all tQ, we can
obtain all possible MFS’ between Qand database
pro-teins, if any. In this step, if the algorithm cannot find any MFS for a database protein, all the fragments from
Qand the database protein are selected to form a MFS.
An example of MFS searching and construction is illu-strated in Additional file 1: Figure S1.
After searching MFS, a filtering process is called to
remove redundant MFS’. Then, the non-redundant MFS’
between Q and each database protein are ranked
according to scoring function SMFS and the top Nseed
sets are selected. The scoring function is defined as fol-lows:
SMFS= w1· NQ NQf + w2·
NP NPf + w3·
minNQ,NP
maxNQ,NP
whereNQandNP denote the cardinality ofFQandFP
in a MFS, respectively.
NfQ=LQ/Lf and NfP =LP/Lf are the numbers of
fragments in the target protein and a database protein, respectively. The third term of the above scoring
func-tion is used to favor MFS’ which have comparable NQ
and NP. The values w1, w2, andw3 are used to weight
the contributions from the three terms.
The data needed byppsAlignin order to compute the
alignments on GPU are: structures of the proteinQand
of the database proteins, and MFS’. To allow efficient processing, those data must be judiciously laid out on the GPU memories. Specifically, the database structures are transferred to the texture memory before execution.
The MFS’are transferred from CPU memory to GPU
global memory as inputs to the fragment-level alignment
(see Figure 1). Finally, the structure of protein Q is
stored in the constant memory, which has smaller capa-city but lower access latency compared to the texture memory.
Fragment-level alignment
In this step, the fragments in each MFS are assembled to obtain initial alignments using Dynamic Program-ming (DP). For a given MFS, the DP algorithm first
sorts the fragments from FQand FP according to their
locations inQ andP. Then, it computes the similarity
score Sf(i, j) of each fragment pair for 1≤i≤ NQ and 1
≤j≤NPusing the following recurrence:
sf
i,j= max ⎧ ⎨ ⎩ Sf
i−1,j−1+Sf
i,j Sf
i,j−1+Gf
Sf
i−1,j+Gf
,
whereGfis gap penalty andSfis based on the inverse
cosine distance of fragment’s feature vector. Given a
fragment pair,AandB, and their corresponding feature vectorsDAandDB, Sfis calculated as follows:
sf = 1−cos−1
D
A,DB
DA • DB
where <DA, DB> is the inner product ofDAandDB, || DA|| and ||DB|| are the norm of DA andDB,
respec-tively. In the current implementation, features only use Euclidean distance of each residue pair for fast calcula-tion. The main reason for using feature distance as an approximate measure of fragment similarity is the need for simple control paths due to the SIMT (Single Instruction, Multiple Thread) computing mode of the GPU [30]. Traditional methods usually calculate RMSD and find an optimal transformation using the Kabsh algorithm [33], which contains complex control flows and is therefore not suitable for the SIMT mode. This step provides a rough alignment result which will be refined by the residue-level alignment.
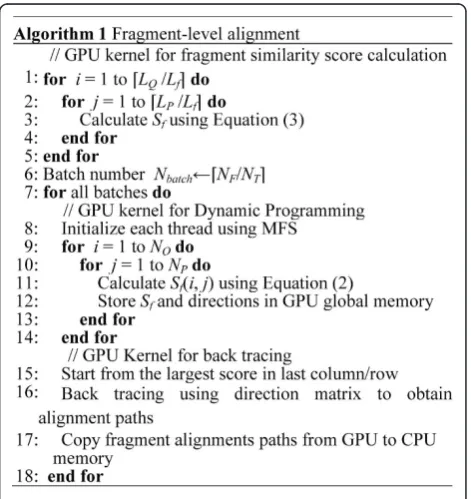
GPU computation for fragment-level alignment
The pseudo-code in Figure 2 describes the fragment-level alignment. The algorithm splits the computation into three GPU kernels. The first kernel performs the
computation of the fragment scores Sf by assigning a
[image:4.595.305.541.411.661.2]database protein to each thread. This kernel performs
all-against-all fragment comparisons and writes similar-ity scores into the GPU global memory.
The second GPU kernel implements the DP algo-rithm, whereas the third one performs back tracing. The
total number of threads NT that can run concurrently
on the GPU is mainly limited by the global memory capacity of the GPU (in this phase each thread requires approximately 10 kB of memory). Suppose that the total
number of MFS betweenQand all database proteins is
NF. If NF >NT, the overall MFS’ will be divided into Nbatch= ⌈NF/NT⌉batches. ppsAlign sequentially
sche-dules each batch to run on GPU. In each batch, the DP is first executed as a GPU kernel and each thread corre-sponds to a MFS. Then, the GPU kernel for the back tracing is called to obtain alignment paths for each
MFS. When a batch terminates, ppsAligntransfers the
output (i.e., alignment path for each MFS) from the GPU memory to CPU memory. After aggregating the outputs from all batches,ppsAlign first performs filter-ing to remove redundant alignments, and then assem-bles all the fragments along the alignment paths to form residue alignments which will be further refined by the residue-level alignment.
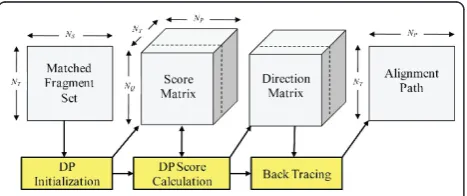
It is critically important to effectively utilize the lim-ited memory resources of the GPU. Our GPU memory
allocation scheme is exemplified in Figure 3. The MFS’
are stored in a 2D block of size (NT ×NS) whereNS is
the maximal size of all MFS’. Each thread of the DP ker-nel fetches a MFS to initialize its setting. The score and direction matrices are stored in a separate 3D memory block of size (NQ ×NP ×NT), whereNQandNP
repre-sent the maximal number of fragments from the target protein and all the database proteins, respectively. The alignment paths are then stored in a 2D block of size (NP×NT). InppsAlign, multiple GPU memory accesses
are coalesced into a single transaction whenever possi-ble. This fragment-level alignment process provides a selection of seed fragments which are likely to be suc-cessful in accurate alignment. Only approximately 1.6% of the total execution time is spent in this phase.
Residue-level alignment
The results of fragment-level alignment are then refined by a residue-level alignment process. Such a refined alignment result is an ordered set R= {(qi, pi) | qi∊Q’, pi∊P’}, where Q’ ⊆Q(target protein) andP’⊆P
(data-base protein).
In this step, a rigid-body transformation (rotation and translation)Tthat minimizes the RMSD ofRis first
cal-culated. Then, the transformation Tis used to
superim-pose all the residues from Q over P. Finally, the DP
algorithm is used to find an alignment path betweenQ
and P similar to the fragment-level alignment. In the
DP, the gap penaltyGr is set to 0 and the residue
simi-larity scoreSr uses the scoring function from TM-align
[10]. However, our framework can be configured to use any suitable residue-level scoring function [1].
As we mentioned previously, the complex control
flows present in the traditional method for computing T
(e.g., Kabsch algorithm [33]) make it unsuitable for the SIMT computing model of GPU. To address this issue, we implement and optimize a fast algorithm using qua-ternion-based characteristic polynomial (QCP) [34],
gRMSD-QCP, to determine the transformation T on
GPU. In the gRMSD-QCP kernel, coordinates of resi-dues from two protein structures are first written into the GPU global memory and origin of coordinate is moved to the center of coordinates for each protein. Then, the inner-product of two coordinate matrices is calculated, which is used by QCP for RMSD calculation. The work flow of gRMSD-QCP is relatively simple, and therefore amenable of efficient GPU implementation.
GPU computation for residue-level alignment
The GPU implementation of residue-level alignment starts with loading coordinates of residues fromRto the GPU global memory. Next, the gRMSD-QCP kernel is invoked to calculate the transformationTwhich is also written into the GPU global memory. Finally, a DP ker-nel is called to find residue alignments which are trans-ferred into the CPU memory after the kernel terminates. As in the fragment-level alignment phase, the residue-level alignments are divided into batches according to the memory requirement of the threads. After all the batches are executed,ppsAlignaggregates the outputs of residue alignmentR, which are used in the next step for searching the maximal alignment.
Maximal alignment search
The maximal alignment search is used to find the
lar-gest subset M ⊆ Rsuch that the score of the residue
alignmentR, denoted bySa, is maximized. Because
find-ing the largest subsetM is extremely time-consuming, a
heuristic and approximate algorithm, MaxSub [35], has
been developed to solve this problem. In ppsAlign, a
[image:5.595.58.292.587.685.2]variant of MaxSub, gMaxSub, is designed to parallelize
the search process on the GPU. In the current imple-mentation ofppsAlign, Sais defined using the TM-score
[10].
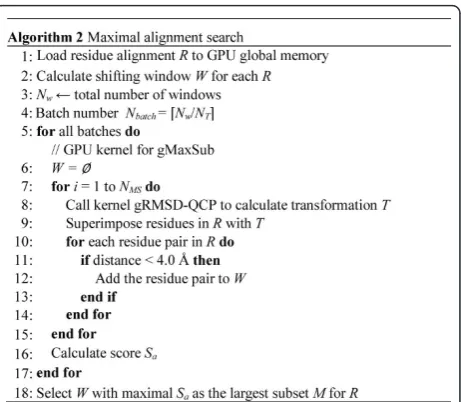
GPU computation for maximal alignment search
The input of this step is the alignment Rfrom the resi-due-level alignment which hasLRaligned residue pairs.
The original MaxSub algorithm on CPU searches the
largest subset M by shifting a window W of size LW
alongR (see Figure 4a). This results into (LR-LW + 1)
[image:6.595.308.539.87.288.2]shift operations which are candidates for parallelization. Then, gMaxSub searches the maximal alignment by concurrently dispatching each calculation ofWto differ-ent GPU threads (see Figure 4b).
Figure 5 describes a pseudo-code of gMaxSub. First, for each residue alignment RbetweenQandP, (LR-LW
+ 1) windows are generated. Second, the gRMSD-QCP
kernel is invoked to calculate the transformationT for
the residue pairs within eachWand then T is used to
superimpose residues fromQover PinR. Third, residue pair (qi, pi)∊Ris added intoWif its distance is below a
cutoff (4.0 Å) after the superimposition. The above two steps (i.e., gRMSD-QCP and window extension) are iteratively executed for NMStimes. Forth, the lastWis
assigned toM andSais calculated.
As in previous phases, the maximal alignment searches are divided into batches. After all the batches
are executed,ppsAlignaggregates the outputs of subset
and selects the one with the largest Sa as the largest
subset M. The transformationTassociated with the
lar-gest subset M is used to superimpose all the residues
fromQ overP and the residue pair whose distance is
below a cutoff (4.0Ǻ) is selected to form a new residue alignmentR.
After gMaxSub terminates, if the current iteration number <Niter, the residue alignmentRwill be first
fil-tered to remove redundant alignments from the same database protein and then sent to the residue-level
alignment for further refinement; otherwise,R will be
used as input for the next step of final assessment.
Final assessment of alignment quality
After structure alignments are computed on GPU, the
residue alignments Rare transferred from the GPU
memory to CPU memory. We use PSI (percentage of structural similarity), defined as the percentage of resi-due pairs fromRwith distance below 4.0 Å, to score the alignment quality. We also assess the statistical signifi-cance of the alignments through z-Score of the PSI, which is given as follows:
z - Score = PSI -µPSI σPSI
where μPSIandsPSI denote mean and standard
devia-tion of PSI for a given protein chain length, respectively.
The parameters μPSI and sPSI are obtained using a
method similar to [12], leading to the following settings:
μPSI = 375.64·k-0.5295andsPSI= 99.67·k-0.5885. Here,kis
the minimum chain length between target and database proteins.
Results
In this section, we compare ppsAlign’s performance to
concurrent methods in terms of alignment quality and
computational efficiency. We evaluateppsAlignusing an
NVIDIA Tesla C2050 GPU card equipped with 448 cores at 1.15 GHz and 3 GB global memory. The con-current methods include TM-align [10], Fr-TM-align [11], and MAMMOTH [12], which share similar
com-putational framework as ppsAlign. As DALI [8] and CE
[image:6.595.58.293.579.670.2][9] have been exhaustively evaluated elsewhere [10], we
Figure 4 Comparison of MaxSub and gMaxSub. The original MaxSub algorithm on CPU searches the largest subset by shifting a windowWalong the residue alignmentR. The gMaxSub searches the maximal alignment by concurrently dispatching each calculation ofWto different GPU threads.
Figure 5Algorithm of maximal alignment search. For each search, the gRMSD-QCP kernel is invoked to calculate the
do not include these approaches in our experiments. We download software packages of these methods from their official websites and evaluate the performance on a Linux personal computer with AMD Opetron dual-core 1000 series processor at 1.8 GHz and 8 GB RAM.
The main purpose of structure alignment is to
maxi-mize the number of aligned residues (Ne) while
mini-mizing the RMSD of the aligned residues, denoted by cRMSD. To eliminate the size dependence of cRMSD
on Ne, in this paper we use a normalized measure of
cRMSD, RMSD100, to evaluate the alignment quality.
RMSD100is calculated as follows [36]:
RSMD100 =
cRMSD
1 + ln
Ne
100 ,
which corresponds to the cRMSD value expected if the two protein structures were 100 residues long.
To evaluate efficiency, we measure the execution time on a dataset in which the protein’s chain length is in a range from 80 to 500 residues extracted from ASTRAL 1.75 database [37] with sequence identity < 40% (ASREAL40). The database protein chain length is determined by the global memory capacity on the GPU card. However, this limitation is not severe as 98.5% ASTRAL40 protein chains have less than 500 residues. We expect that the advancement of GPU technology will solve this memory limitation issue in
the near future so that the ppsAlign algorithm can
handle protein chains longer than 500 residues. Cur-rently we can handle structures larger than 500 resi-dues in one of the following two ways: 1) by sending the alignment tasks to our CPU-based algorithm and 2) if resource allows, by using another GPU card to align the remaining 1.5% of large structures. Although the algorithm can also handle small protein chains below 80 residues (~16% of ASTRAL40), we do not use them for our testing because they have relatively simple topologies [38].
To efficiently utilize global memory of GPU card, the entire database proteins are sorted according to the chain length and then divided into two small datasets: 1) D1, which includes 6, 569 proteins in the range [80,
250) residues selected from ASTRAL40 according to
the length distribution of proteins, and 2) D2, which
includes 1, 912 proteins in the range [251, 500) resi-dues. The target dataset includes 100 proteins which are randomly selected in the range [80, 250) from ASTRAL40. For each target protein, a one-against-all alignment is performed with all database proteins and totally 100 × (6, 569 + 1, 912) = 848, 100
non-homolo-gous protein pairs are compared during the
experiment.
Scalability ofppsAlign
There are two critical parameters for ppsAlign, namely
the maximal number of iteration (Niter) and the maximal
number of MFS (Nseed). Intuitively, when increasingNiter
or Nseed, ppsAlign will often obtain better alignment
quality but the execution time will be significantly lengthened. To verify this, we preliminarily investigate the performance of different settings using a small target
dataset of 17 proteins and the dataset D1 in terms of
RMSD100. The experimental results of RMSD100 with
Niter= {3, 5, 7} andNseed= {10, 30, 50, 70} are shown in
Figure 6, which illustrates that ppsAlignhas decreased
RMSD100whenNiterand/orNseedis increasing. This
fig-ure can be used as a guideline for parameter selection ofppsAlign. For a fair comparison of efficiency
improve-ment fromppsAlign to a concurrent method, we select
a combination of Niterand Nseed that achieves
compar-able alignment quality.
Speedup over TM-align and CPU-basedppsAlign
In this experiment, ppsAlign is executed with a
para-meter setting of Niter= 3 and Nseed= 20 which results
in a comparable RMSD100 to TM-align and the CPU
version ofppsAlign. Table 1 summarizes the alignment
quality, average execution time, and corresponding
speedup. ppsAlign achieves speedups of 23.8 and 35.9
compared to CPU-basedppsAlign and TM-align,
respec-tively. The detailed comparison of alignment quality of
ppsAlign and TM-align can be found in Additional file 1: Table S1.
Speedup over Fr-TM-align
Since Fr-TM-align performs more iterations to improve its alignment quality over TM-align, we increase both
iteration and seed numbers of ppsAlign algorithm to
achieve a comparable alignment quality with
Fr-TM-align. The experimental results of RMSD100, average
execution time, and corresponding speedup with Niter=
6 and Nseed = 30 are shown in Table 2. ppsAlign
achieves speedup 64.7 compared to Fr-TM-align with the same alignment quality. The detailed comparison of
alignment quality ofppsAlignand Fr-TM-align can be
found in Additional file 1: Table S2.
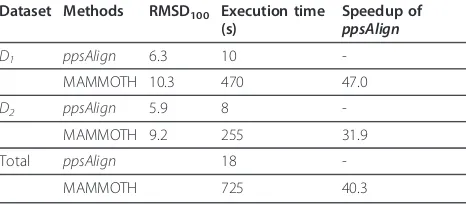
Speedup over MAMMOTH
In the last experiment, we use the same dataset to
com-pare the performance of ppsAlign and MAMMOTH.
Different from TM-align and Fr-TM-align, MAM-MOTH is originally developed for the purpose of large-scale comparisons with high efficiency at the cost of the reduction of alignment quality. Because of its high speed, MAMMOTH is used as a benchmark for maxi-mal speed on the CPU platform in [39]. The
corresponding speedup with Niter = 1 andNseed= 8 are
shown in Table 3.ppsAlignachieves speedup 40.3
com-pared to MAMMOTH and higher alignment quality.
The detailed comparison of alignment quality of
ppsA-lignand MAMMOTH can be found in Additional file 1:
Table S3.
Discussion
The framework of ppsAlign is a general-purpose GPU
[image:8.595.58.539.88.604.2]platform for protein structure alignment which could take many concurrent methods, such as TM-align [10] and Fr-TM-align [11], into the parallelized algorithm design. An important novelty in our approach is to
Figure 6Performance comparison ofppsAlignwith different settings ofNseedandNiter.ppsAlignis running on NVIDIA Tesla C2050 GPU card with a small target dataset of 17 proteins. The parameter settings ofppsAlignareNiter= {3, 5, 7} andNseed= {10, 30, 50, 70}. (A)Niter= 3. (B)
create a unique design to manage resources of the GPU architecture. First, an intelligent decomposition of the application in kernels characterized by different paralle-lization strategies is provided. In the existing methods for GPU-based sequence alignment mentioned pre-viously, a pair-wise comparison is either assigned to a thread (i.e., inter-task parallelization) or corporately per-formed by a block of threads (i.e., intra-task paralleliza-tion) [18,20]. However, as the workflow of structure alignment is more complicated than that of sequence alignment, neither the inter- nor the intra- task paralleli-zation can efficiently exploit the GPU computing power.
Therefore, ppsAlign utilizes a hybrid inter- and
intra-task parallel model. In particular, each intra-task (i.e., pair-wise structural comparison) is divided into several inde-pendent seed alignments. Each seed alignment is assigned to a different thread (inter-task parallelization), whereas each block executes one or more pair-wise
comparisons (intra-task parallelization). Second, a smart design of memory layout and memory access patterns are developed, the former allowing an effective use of the memory capacity at the different levels of the GPU memory hierarchy, and the latter minimizing the mem-ory bandwidth requirement of the application. Third, several efficient algorithms for avoiding complex control flow on GPU are proposed to take advantage of the SIMT nature of the GPU. For instance, a feature-based measure is used to compute similarity of fragment at the fragment-level alignment which can avoid time-con-suming RMSD calculation at the initial stage of struc-ture alignment.
One of the major ways in which ppsAlign differs to
[image:9.595.57.539.112.244.2]other methods is implementing protein structure align-mentat the residue levelon GPU. Recently, the GPU-enhanced algorithms are gaining an increasing attention in bioinformatics. One of the major steps was a GPU implementation of a one-against-all sequence compari-son using Smith-Waterman algorithm [20,21]. With these methods, a sequence database search can be per-formed resulting in a list of similarity scores, while these Table 1 Average execution time of TM-align, CPU-basedppsAlign, andppsAlignwith parameter settings (Niter= 3 and
Nseed= 20).
Dataset Methods RMSD100 Execution time (s) Speedup ofppsAlign
D1 ppsAlign 5.7 64
-CPU-basedppsAlign 5.7 1596 24.9
TM-Align 5.7 2170 33.9
D2 ppsAlign 5.3 41
-CPU-basedppsAlign 5.3 899 21.9
TM-Align 5.3 1597 39.0
Total ppsAlign 105
-CPU-basedppsAlign 2495 23.8
TM-Align 3767 35.9
RMSD100is the expected value of cRMSD if the two protein structures were 100 residues long.ppsAlignis running on NVIDIA Tesla C2050 GPU card and other
[image:9.595.56.293.559.687.2]methods (CPU-basedppsAlignand TM-align) are running on a computer with AMD Opetron dual-core 1000 series processor at 1.8 GHz and 8 GB RAM. The parameter settings ofppsAlignareNiter= 3 andNseed= 20
Table 2 Average execution time of Fr-TM-align and
ppsAlignwith parameter settings (Niter= 6 andNseed= 30).
Dataset Methods RMSD100 Execution time
(s)
Speedup of ppsAlign
D1 ppsAlign 5.4 326
- Fr-TM-align
5.4 19849 60.9
D2 ppsAlign 5.1 224
- Fr-TM-align
5.1 15729 70.2
Total ppsAlign 550
- Fr-TM-align
35578 64.7
RMSD100is the expected value of cRMSD if the two protein structures were
100 residues long.ppsAlignis running on NVIDIA Tesla C2050 GPU card and Fr-TM-align is running on a computer with AMD Opetron dual-core 1000 series processor at 1.8 GHz and 8 GB RAM. The parameter settings ofppsAlign
areNiter= 6 andNseed= 30
Table 3 Average execution time of MAMMOTH and
ppsAlignwith parameter settings (Niter= 1 andNseed= 8).
Dataset Methods RMSD100 Execution time
(s)
Speedup of ppsAlign
D1 ppsAlign 6.3 10
-MAMMOTH 10.3 470 47.0
D2 ppsAlign 5.9 8
-MAMMOTH 9.2 255 31.9
Total ppsAlign 18
-MAMMOTH 725 40.3
RMSD100is the expected value of cRMSD if the two protein structures were
100 residues long.ppsAlignis running on NVIDIA Tesla C2050 GPU card and MAMMOTH is running on a computer with AMD Opetron dual-core 1000 series processor at 1.8 GHz and 8 GB RAM. The parameter settings ofppsAlign
[image:9.595.305.538.586.688.2]methods do not provide the detailed alignment informa-tion of the best hits [23]. To provide detailed residue-residue correspondence, GPU-BLAST [24] was devel-oped, that allowed to accelerate the NCBI-BLAST search, achieving the speedup between 3 and 4 on an NVIDIA Tesla C2050 GPU card. In addition, another approach to protein sequence that uses backtracking on GPU to construct alignment of residues has been pro-posed [23]. Compared to the sequence alignments, the implementation of structure alignment on GPU is a more challenging task, because some routines (e.g., RMSD calculation) can cause severe divergence among GPU threads and decrease performance of GPU. One of the first structure comparison methods implemented on GPU, SA Tableau Search [27], aligns protein substruc-ture at the secondary strucsubstruc-ture level, that is by aligning secondary structure elements, while not aligning struc-tures at the residue level. To the best of our knowledge,
ppsAlignis the first protein structure comparison plat-form for GPU that provides the residue level structural alignment.
The substantial contribution of ppsAlign is to
pro-vide a high-performance computing platform for the research community. An alternative solution to accel-erate the protein structure alignment is to install more CPU computing cores in a single machine. However, using more CPU cores in a single machine need to upgrade main board and memory accordingly, which could decrease price/performance ratio. In contrast, installing a GPU card into a PCIe (Peripheral Compo-nent Interconnect Express) slot does not require extra cost and more GPU cards can be installed into one PCIe slot by a switch. In this paper, an NVIDIA Tesla C050 GPU card is utilized to evaluate performance, which has also been used in GPU-BLAST [24]. Though it is a high end product of NVIDIA, we expect its price will drop in the near future due to market demand in gaming industry.
Conclusions
This paper presents ppsAlign for large-scale protein
structure alignment using GPUs. ppsAlignemploys an
index-based search procedure to find seeds of matched fragment sets, and then iteratively refines the seeds with fragment- and residue- level alignments. We provide an
in-depth comparison ofppsAlignagainst several
concur-rent CPU-based methods. Our experimental results
show thatppsAligncan achieve significant speedup over
its CPU implementation, TM-align, Fr-TM-align, and MAMMOTH on a single NVIDIA Tesla C2050 GPU.
We emphasize that the framework ofppsAlign is not
designed as a replacement for the existing structural alignment tools, but as a general-purpose platform for protein structure alignments on GPU. With this
platform, we can parallelize the existing algorithms (e.g., TM-align and Fr-TM-align) on GPU and utilize the massive parallel computing power of GPU to achieve high-throughput structural comparisons without sacrifi-cing alignment quality.
Availability and requirements
•Project name:ppsAlign
•Project home page: http://proteindbs.rnet.missouri.
edu/ppsalign/ppsalign.html
•Operating system(s): Linux
•Programming language: CUDA, JAVA, and PHP
•License: none
Availability of supporting data
The data sets supporting the results of this article are available in the Worldwide Protein Data Bank reposi-tory, http://www.wwpdb.org/.
Additional material
Additional file 1: Figure S1. In this example, one leaf nodetQ j from the indexing tree of the target proteinQis used to search the indexing tree of entire protein databaseΛandmbest matched nodes are
returned. In this example,tQj node is represented by a representative
cQj which is a“structure medium”from three similar substructures {uj, 1,
uj, 2, uj, 3} fromQ. A search ofcQj on the indexing tree ofΛreturns two
database leaf nodes,tΛ
i andtΛk ·tΛi node, represented by cΛi , has two groups of similar substructures {di, 1, 1, di, 1, 2} and {di, 2, 1, di, 2, 2, di, 2,
3} which are from database proteinsP1andP2, respectively.tkΛ node,
represented bycΛ
k , has two groups of similar substructures {dk, 1, 1, dk, 1, 2} and {dk, 3, 1, dk, 3, 2, dk, 3, 3} from database proteinsP1andP3,
respectively. The RMSD of
cQj ,cΛi and
cQj ,cΛkis below a cutoff
(4.5Ǻ). After substructure searching, the target proteinQcan be
represented by ΩQ
t = {uj, 1, uj, 2, uj, 3}. The database proteinsP1, P2, and P3can be represented byP1
t = {di, 1, 1, di, 1, 2, dk, 1, 1, dk1, 2},Pt2= {di,
2, 1, di, 2, 2, di, 2, 3}, andtP3= {dk, 3, 1, dk, 3, 2, dk, 3, 3}, respectively. After
projecting the substructures to fragments, we have three MFS’for nodei
of the indexing tree ofQforP1, P2, andP3. Table S1. Comparison of
alignment quality (RMSD100) ofppsAlignand TM-align. The table compares the alignment quality measured in RMSD100of the 100 target proteins usingppsAlignand TM-align. Table S2. Comparison of alignment quality (RMSD100) ofppsAlignand Fr-TM-align. The table compares the alignment quality measured in RMSD100of the 100 target proteins using ppsAlignand Fr-TM-align. Table S3. Comparison of alignment quality (RMSD100) ofppsAlignand MAMMOTH.The table compares the alignment quality measured in RMSD100of the 100 target proteins usingppsAlign and MAMMOTH.
Abbreviations
fragment set; PCIe: Peripheral Component Interconnect Express; RMSD: Root mean square deviation; SA. simulated annealing; SIMT: Single Instruction: Multiple Thread; SSE: secondary structure element.
Acknowledgements
The authors would like to thank the NVIDIA CUDA Professor Partner Program for the donation of the Tesla C2050 GPU card used in our experiments and the Tesla S1070 server used in the initial phase of the algorithm design. This work was supported by the Shumaker Endowment in Bioinformatics.
Author details
1Informatics Institute, University of Missouri, Columbia, MO, USA. 2
Department of Electrical and Computer Engineering, University of, Columbia, MO, USA.3Department of Computer Science, University of Missouri, Columbia, 65211, MO, USA.
Authors’contributions
BP developed the software and wrote the manuscript. NZ analyzed results and contributed to the discussion. MB and DK contributed to discussion, analyzed the results, and revised the manuscript. CRS coordinated the study and contributed to writing the manuscript. All authors read and approved the final manuscript.
Competing interests
The authors declare that they have no competing interests.
Received: 1 September 2011 Accepted: 22 February 2012 Published: 22 February 2012
References
1. Hasegawa H, Holm L:Advances and pitfalls of protein structural alignment.Curr Opin Struct Biol2009,19(3):341-348.
2. Mayr G, Domingues FS, Lackner P:Comparative analysis of protein structure alignments.BMC Struct Biol2007,7:50.
3. Zhang C, Lai L:Towards structure-based protein drug design.Biochem Soc Trans2011,39(5):1382-1386, suppl 1381 p following 1386. 4. Halperin I, Ma B, Wolfson H, Nussinov R:Principles of docking: An
overview of search algorithms and a guide to scoring functions.Proteins
2002,47(4):409-443.
5. Shin D, Hou J, Chandonia J-M, Das D, Choi I-G, Kim R, Kim S-H: Structure-based inference of molecular functions of proteins of unknown function from Berkeley Structural Genomics Center.J Struct Funct Genomics2007,
8(2):99-105.
6. Henrick K, Feng Z, Bluhm WF, Dimitropoulos D, Doreleijers JF, Dutta S, Flippen-Anderson JL, Ionides J, Kamada C, Krissinel E,et al:Remediation of the protein data bank archive.Nucleic Acids Res2008,36:D426-433, Database issue.
7. Kolodny R, Koehl P, Levitt M:Comprehensive evaluation of protein structure alignment methods: scoring by geometric measures.J Mol Biol
2005,346(4):1173-1188.
8. Holm L, Sander C:Protein structure comparison by alignment of distance matrices.J Mol Biol1993,233(1):123-138.
9. Shindyalov IN, Bourne PE:Protein structure alignment by incremental combinatorial extension (CE) of the optimal path.Protein Eng1998,
11(9):739-747.
10. Zhang Y, Skolnick J:TM-align: a protein structure alignment algorithm based on the TM-score.Nucleic Acids Res2005,33(7):2302-2309. 11. Pandit SB, Skolnick J:Fr-TM-align: a new protein structural alignment
method based on fragment alignments and the TM-score.BMC
Bioinforma2008,9:531.
12. Ortiz AR, Strauss CE, Olmea O:MAMMOTH (matching molecular models obtained from theory): an automated method for model comparison.
Protein Sci2002,11(11):2606-2621.
13. Carpentier M, Brouillet S, Pothier J:YAKUSA: a fast structural database scanning method.Proteins2005,61(1):137-151.
14. Yang JM, Tung CH:Protein structure database search and evolutionary classification.Nucleic Acids Res2006,34(13):3646-3659.
15. Budowski-Tal I, Nov Y, Kolodny R:FragBag, an accurate representation of protein structure, retrieves structural neighbors from the entire PDB quickly and accurately.Proc Natl Acad Sci USA2010,107(8):3481-3486.
16. Pekurovsky D, Shindyalov IN, Bourne PE:A case study of high-throughput biological data processing on parallel platforms.Bioinformatics2004,
20(12):1940-1947.
17. Shah AA, Folino G, Krasnogor N:Toward High-Throughput, Multicriteria Protein-Structure Comparison and Analysis.NanoBioscience, IEEE Transactions on2010,9(2):144-155.
18. Liu W, Schmidt B, Voss G, Muller-Wittig W:Streaming Algorithms for Biological Sequence Alignment on GPUs.Parallel and Distributed Systems, IEEE Transactions on2007,18(9):1270-1281.
19. Smith TF, Waterman MS:Identification of common molecular subsequences.J Mol Biol1981,147(1):195-197.
20. Liu Y, Maskell DL, Schmidt B:CUDASW++: optimizing Smith-Waterman sequence database searches for CUDA-enabled graphics processing units.BMC Res Notes2009,2:73.
21. Manavski SA, Valle G:CUDA compatible GPU cards as efficient hardware
accelerators for Smith-Waterman sequence alignment.BMC Bioinforma
2008,9(Suppl 2):S10.
22. Schatz MC, Trapnell C, Delcher AL, Varshney A:High-throughput sequence alignment using Graphics Processing Units.BMC Bioinforma2007,8:474. 23. Blazewicz J, Frohmberg W, Kierzynka M, Pesch E, Wojciechowski P:Protein alignment algorithms with an efficient backtracking routine on multiple GPUs.BMC Bioinforma2011,12(1):181.
24. Vouzis PD, Sahinidis NV:GPU-BLAST: using graphics processors to accelerate protein sequence alignment.Bioinformatics2011,27(2):182-188. 25. Altschul SF, Madden TL, Schaffer AA, Zhang J, Zhang Z, Miller W,
Lipman DJ:Gapped BLAST and PSI-BLAST: a new generation of protein database search programs.Nucleic Acids Res1997,25(17):3389-3402. 26. Hung LH, Guerquin M, Samudrala R:GPU-Q-J, a fast method for
calculating root mean square deviation (RMSD) after optimal superposition.BMC Res Notes2011,4:97.
27. Stivala AD, Stuckey PJ, Wirth AI:Fast and accurate protein substructure
searching with simulated annealing and GPUs.BMC Bioinforma2010,
11:446.
28. Ritchie DW, Venkatraman V:Ultra-fast FFT protein docking on graphics processors.Bioinformatics2010,26(19):2398-2405.
29. Suchard MA, Rambaut A:Many-core algorithms for statistical phylogenetics.Bioinformatics2009,25(11):1370-1376.
30. Nickolls J, Buck I, Garland M, Skadron K:Scalable Parallel Programming with CUDA.Queue2008,6(2):40-53.
31. Lindholm E, Nickolls J, Oberman S, Montrym J:NVIDIA Tesla: A Unified Graphics and Computing Architecture.Micro, IEEE2008,28(2):39-55. 32. Chi PH, Pang B, Korkin D, Shyu CR:Efficient SCOP-fold classification and
retrieval using index-based protein substructure alignments.
Bioinformatics2009,25(19):2559-2565.
33. Kabsch W:A solution for the best rotation to relate two sets of vectors.
Acta Crystallographica Section A1976,32(5):922-923.
34. Theobald DL:Rapid calculation of RMSDs using a quaternion-based characteristic polynomial.Acta Crystallogr A2005,61(Pt 4):478-480. 35. Siew N, Elofsson A, Rychlewski L, Fischer D:MaxSub: an automated measure for the assessment of protein structure prediction quality.
Bioinformatics2000,16(9):776-785.
36. Carugo O, Pongor S:A normalized root-mean-square distance for comparing protein three-dimensional structures.Protein Sci2001,
10(7):1470-1473.
37. Chandonia JM, Walker NS, Lo Conte L, Koehl P, Levitt M, Brenner SE:
ASTRAL compendium enhancements.Nucleic Acids Res2002,
30(1):260-263.
38. Xu J-R, Zhang Y:How significant is a protein structure similarity with TM-score = 0.5?Bioinformatics2010,26(7):889-895.
39. Teichert F, Bastolla U, Porto M:SABERTOOTH: protein structural alignment based on a vectorial structure representation.BMC Bioinforma2007,
8:425.
doi:10.1186/1756-0500-5-116
Cite this article as:Panget al.:Accelerating large-scale protein structure alignments with graphics processing units.BMC Research Notes2012