R E S E A R C H A R T I C L E
Open Access
How well does the minimum data set
measure healthcare use? a validation study
Malcolm B. Doupe
1,2*, Jeff Poss
3, Peter G. Norton
4, Allan Garland
5, Natalia Dik
2, Shauna Zinnick
6and Lisa M. Lix
1Abstract
Background:To improve care, planners require accurate information about nursing home (NH) residents and their healthcare use. We evaluated how accurately measures of resident user status and healthcare use were captured in the Minimum Data Set (MDS) versus administrative data.
Methods:This retrospective observational cohort study was conducted on all NH residents (N= 8832) from Winnipeg, Manitoba, Canada, between April 1, 2011 and March 31, 2013. Six study measures exist. NH user status (newly admitted NH residents, those who transferred from one NH to another, and those who died) was measured using both MDS and administrative data. Rates of in-patient hospitalizations, emergency department (ED) visits without subsequent hospitalization, and physician examinations were also measured in each data source. We calculated the sensitivity, specificity, positive and negative predictive values (PPV, NPV), and overall agreement (kappa,κ) of each measure as captured by MDS using administrative data as the reference source. Also for each measure, logistic regression tested if the level of disagreement between data systems was associated with resident age and sex plus NH owner-operator status.
Results:MDS accurately identified newly admitted residents (κ= 0.97), those who transferred between NHs (κ= 0. 90), and those who died (κ= 0.95). Measures of healthcare use were captured less accurately by MDS, with high levels of both under-reporting and false positives (e.g., for in-patient hospitalizations sensitivity = 0.58, PPV = 0.45), and moderate overall agreement levels (e.g.,κ= 0.39 for ED visits). Disagreement was sometimes greater for younger males, and for residents living in for-profit NHs.
Conclusions:MDS can be used as a stand-alone tool to accurately capture basic measures of NH use (admission, transfer, and death), and by proxy NH length of stay. As compared to administrative data, MDS does not accurately capture NH resident healthcare use. Research investigating these and other healthcare transitions by NH residents requires a combination of the MDS and administrative data systems.
Keywords:Nursing homes, Healthcare use, MDS records, Validation
Background
Nursing homes (NHs) have become increasingly com-plex care environments and are in growing demand. The number of 75+ year olds living in both Canada [1] and the United States [2] is expected to double by 2030, and in any given year 1.4 million U.S. citizens [3] and
225,000 Canadians [4] reside in a NH. NH use patterns have also changed dramatically in recent years, with many residents now admitted later in life and with more com-plex needs [5–7]. Presently, about half of all newly admit-ted NH residents require weight-bearing help to complete activities of daily living [8], and many are afflicted with co-morbid diseases plus a range of cognitive, behavior, and continence challenges [7,9,10]. Rates of healthcare use (e. g., emergency department [ED] visits, hospitalizations) by NH residents have also increased considerably [11, 12], and better management of these transitions has become a major reform focus [13,14].
* Correspondence:[email protected]
1Department of Community Health Sciences, Max Rady College of Medicine, Rady Faculty of Health Sciences, University of Manitoba, 408-727 McDermot Avenue, Winnipeg, MB R3E 3P5, Canada
2Manitoba Centre for Health Policy, University of Manitoba, 408-727 McDermot Avenue, Winnipeg, MB R3E 3P5, Canada
Full list of author information is available at the end of the article
Continued research into these and related areas re-quires high quality data systems. While some authors report challenges using administrative data to meas-ure patient health status and adverse events (e.g., hos-pital acquired pressure ulcers) [15], several have shown that these records accurately capture many types of healthcare use without recall bias or loss to follow-up [16–19]. In some instances, however, the breadth of administrative records available and access to them for research varies by geography. Conversely, standardized comprehensive assessments using the interRAI family of instruments is mandated widely across North America [20, 21]. Amongst these, the Resident Assessment Instrument 2.0 (RAI 2.0) exists for NH residents in most Canadian provinces and is comprised of assessment forms (called the Minimum Data Set; MDS), a standard operating manual (pro-vides definitions and assessment guidelines), and Clin-ical Assessment Protocols (CAPs, used to help develop resident care plans) [20]. MDS assessments richly define NH residents by (for example) their functional dependence, cognitive impairment, and use of healthcare services including prescription drug use. Validation has been conducted on various MDS scales that measure cognitive performance [22], pain [23], and depression [24]. Authors have also examined the accuracy of MDS quality care metrics [25], plus spe-cific MDS items that capture resident prescription drug use [26, 27] and chronic disease [28, 29]. With some exceptions [30], the accuracy with which MDS captures resident healthcare use is understudied. The present research helps to fill this gap by linking MDS to administrative data for a population of NH resi-dents from Winnipeg, Manitoba. The objective of our study is to assess the accuracy of MDS for capturing: i) NH resident admission, transfers between NHs, and death; and ii) hospital use, ED transfers, and ambula-tory care physician visits. These study results define the extent to which MDS data can be used as a stand-alone tool for providing key NH use and healthcare transition information pertinent to guiding NH care reform.
Methods
Research environment and study cohort
Manitoba is one of 10 Canadian provinces and has a population of 1.3 million people dispersed across five geographically diverse regions responsible for delivering healthcare. Four of these regions are rural or remote and the Winnipeg Health Region (WHR, the city of Winnipeg) is the only large metropolitan area (popula-tion 725,000). About two-thirds of Manitoba’s total NH beds (N= 9586) are located in Winnipeg (N= 5636
beds across 38 facilities) [31]. This study was con-ducted on the population of Manitobans who resided in a Winnipeg NH for a least 1 day between April 1, 2011 and March 31, 2013.
Data sources
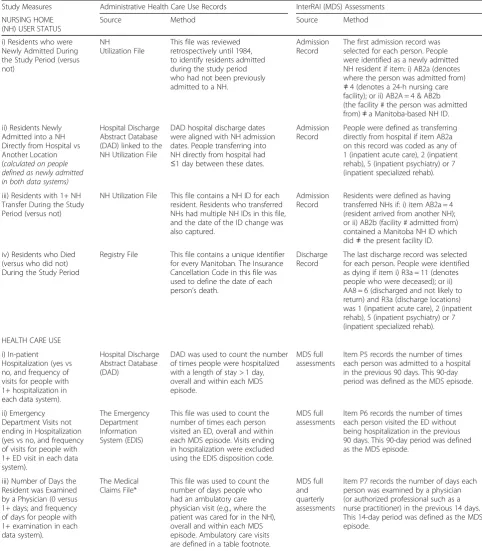
The data sources used to conduct this research are de-scribed in Table 1. The national standard for reporting MDS data has been established by the Canadian Institute of Health Information, CIHI; https://www.cihi.ca/en). All NH residents are required to have an MDS admission (provides an admission date and an‘admission from’ loca-tion) and discharge (provides the reason and date of dis-charge) record. A full-length assessment is also required for each resident at NH admission and annually thereafter, interspersed by abbreviated quarterly assessments. Each full assessment contains responses to about 400 standard-ized items that profile residents by various clinical (e.g., cognitive performance) and healthcare use (e.g., emer-gency department use) domains. Each assessment is com-pleted by a trained assessor (usually a nurse) using all available information including clinical charts and obser-vations made by the family, staff, physicians, and volunteers.
Administrative data have been available in Winnipeg since 1984, although some data sources originate before this date. The Registry File contains a unique identifier for every Manitoban including their birth and death date, and is used for linkage to all other files. The NH Use File contains the dates of admission and discharge for every NH resident in Manitoba, while the Hospital Discharge Abstract Database (DAD) provides the dates of hospital admission and discharge plus reasons for hospitalization. The Emergency Department Information System (EDIS) provides the dates of ED visits plus details about the care provided during each visit, and the Medical Claims File provides the dates and types of physician visits as well as the primary reason for the visit.
Both MDS and administrative data are housed at the Manitoba Centre for Health Policy, Max Rady College of Medicine, University of Manitoba. Unique,
[image:3.595.55.538.99.651.2]person-level and time-stamped identifiers exist in each of these files, enabling researchers to link them when studying system-level patterns of healthcare use. Table 1Data Sources and Methods Used to Create Study Measures
Study Measures Administrative Health Care Use Records InterRAI (MDS) Assessments
NURSING HOME (NH) USER STATUS
Source Method Source Method
i) Residents who were Newly Admitted During the Study Period (versus not)
NH
Utilization File
This file was reviewed retrospectively until 1984, to identify residents admitted during the study period who had not been previously admitted to a NH.
Admission Record
The first admission record was selected for each person. People were identified as a newly admitted NH resident if item: i) AB2a (denotes where the person was admitted from)
≠4 (denotes a 24-h nursing care facility); or ii) AB2A = 4 & AB2b (the facility # the person was admitted from)≠a Manitoba-based NH ID.
ii) Residents Newly Admitted into a NH Directly from Hospital vs Another Location (calculated on people defined as newly admitted in both data systems)
Hospital Discharge Abstract Database (DAD) linked to the NH Utilization File
DAD hospital discharge dates were aligned with NH admission dates. People transferring into NH directly from hospital had
≤1 day between these dates.
Admission Record
People were defined as transferring directly from hospital if item AB2a on this record was coded as any of 1 (inpatient acute care), 2 (inpatient rehab), 5 (inpatient psychiatry) or 7 (inpatient specialized rehab).
iii) Residents with 1+ NH Transfer During the Study Period (versus not)
NH Utilization File This file contains a NH ID for each resident. Residents who transferred NHs had multiple NH IDs in this file, and the date of the ID change was also captured.
Admission Record
Residents were defined as having transferred NHs if: i) item AB2a = 4 (resident arrived from another NH); or ii) AB2b (facility # admitted from) contained a Manitoba NH ID which did≠the present facility ID.
iv) Residents who Died (versus who did not) During the Study Period
Registry File This file contains a unique identifier for every Manitoban. The Insurance Cancellation Code in this file was used to define the date of each person’s death.
Discharge Record
The last discharge record was selected for each person. People were identified as dying if item i) R3a = 11 (denotes people who were deceased); or ii) AA8 = 6 (discharged and not likely to return) and R3a (discharge locations) was 1 (inpatient acute care), 2 (inpatient rehab), 5 (inpatient psychiatry) or 7 (inpatient specialized rehab).
HEALTH CARE USE
i) In-patient Hospitalization (yes vs no, and frequency of visits for people with 1+ hospitalization in each data system).
Hospital Discharge Abstract Database (DAD)
DAD was used to count the number of times people were hospitalized with a length of stay > 1 day, overall and within each MDS episode.
MDS full assessments
Item P5 records the number of times each person was admitted to a hospital in the previous 90 days. This 90-day period was defined as the MDS episode.
ii) Emergency Department Visits not ending in Hospitalization (yes vs no, and frequency of visits for people with 1+ ED visit in each data system).
The Emergency Department Information System (EDIS)
This file was used to count the number of times each person visited an ED, overall and within each MDS episode. Visits ending in hospitalization were excluded using the EDIS disposition code.
MDS full assessments
Item P6 records the number of times each person visited the ED without being hospitalization in the previous 90 days. This 90-day period was defined as the MDS episode.
iii) Number of Days the Resident was Examined by a Physician (0 versus 1+ days; and frequency of days for people with 1+ examination in each data system).
The Medical Claims File*
This file was used to count the number of days people who had an ambulatory care physician visit (e.g., where the patient was cared for in the NH), overall and within each MDS episode. Ambulatory care visits are defined in a table footnote.
MDS full and quarterly assessments
Item P7 records the number of days each person was examined by a physician (or authorized professional such as a nurse practitioner) in the previous 14 days. This 14-day period was defined as the MDS episode.
Further details about general data linkage processes are available elsewhere [17, 18].
Measures of NH user status and healthcare use
The study measures are described in Table1. Measures of NH user status include being newly (i.e., first time) admit-ted into the NH system, having transferred between NH facilities one or more times, and having died during the study period. For residents defined as newly admitted in both data systems, we also measured whether they were admitted directly from hospital or another location.
Measures of healthcare use include in-patient hospital-izations, ED visits not resulting in hospitalization, and ambulatory care physician visits. These measures were assessed during specific times (episodes) as predicated by the MDS assessment (called ‘look-back’ episodes in this manuscript). During each full MDS assessment, as-sessors are asked to record the number of times the resi-dent was admitted to a hospital in the last 90 days, and to curtail this look-back episode if a previous full assess-ment occurred during this time. Based on these criteria, the equivalent date-stamped episodes were created using DAD (with 2 days of overlap to account for data record-ing errors), and the number of hospital discharges dur-ing each episode was compared between data systems. Also, some of these look-back episodes include days pre-ceding a resident’s NH admission date. Comparisons of hospital use across data systems were therefore made separately on assessments completed within the first 90 days of NH admission (i.e., where at least some of the ‘look-back’ episode preceded the resident’s stay in a given NH), and all others.
This same strategy was used to identify ED visits not resulting in hospitalization (Table 1). Counts of these visits are recorded during full MDS assessments only. Assessors are asked to record the number of these visits in the last 90 days, curtailed if previous full assessments occurred during this time. The equivalent time-stamped episodes (plus or minus 2 days to account for error) were created using EDIS. Counts of ED visits were com-pared across data systems during each episode, stratified by assessments completed within or following each resi-dent’s first 90 days of NH stay.
Physician visits are captured in MDS during both full and quarterly assessments. Assessors recorded how often residents were examined by a physician (or a related care provider such as a nurse practitioner or dentist with additional training) in the past 2 weeks. Tariff codes from the Medical Claims file were used to identify a subset of physician visits (i.e., ambulatory care or examinations in the NH) that occurred during each MDS look-back episode, and a list of the major tariff codes used to identify ambulatory care physician visits is provided in Table 1. Comparisons across data
systems identify the number of residents who were examined during zero versus one or more days during each look-back episode.
Statistical analysis
The study cohort was first described by the number of different MDS records (i.e., assessment and discharge re-cords, full and quarterly assessments) that existed; and then by resident age (< 65, 65–74, 75–84, 85+ years), sex, and whether people lived in a NH that was not-for-profit, for not-for-profit, or a combination of these ownership types during the study period. Measures of NH user sta-tus and healthcare use were then compared between the MDS and administrative data systems, using the latter as the reference data source. The unit of analysis for NH user status measures is the person, while the unit of ana-lysis for measures of health care use is the MDS look-back episode.
The accuracy of each study measure was calculated. Sensitivity was defined as proportion of true cases cor-rectly identified by MDS, while specificity was defined as the proportion of true negatives correctly identified by MDS. Positive predictive value (PPV) was defined as the proportion of all cases defined by MDS that were truly positive, while negative predictive value (NPV) was de-fined as the proportion of all non-cases in MDS that were truly negative. Cohen’s kappa coefficient (κ) [34] was used to measure overall agreement between these data sources. As recommended by Cohen, kappa values can be categorized as: i) < 0.20 (poor); ii) 0.20 to 0.39 (fair); iii) 0.40 to 0.59 (moderate); iv) 0.60 to 0.79 (good); and v) 0.80 to 1.0 (very good).
Results
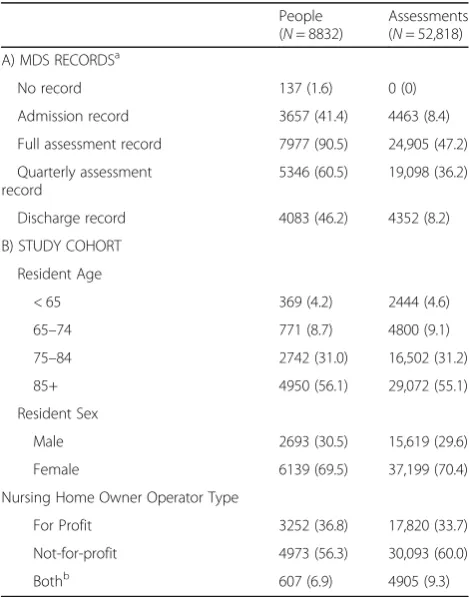
The study cohort included 8832 NH residents with 52,818 MDS records (Table 2). A small number of resi-dents (N= 137) had no MDS data, while just under half had at least one admission (41.4%) and discharge (46. 2%) record. Full MDS assessments were completed on 90.5% of residents, and 60.5% of residents had one or more quarterly assessments.
The distribution of MDS records was similar by resi-dent age and sex (Table 2); 56.1% of the study cohort was 85+ years old and 55.1% of MDS records were com-pleted on these residents. Similarly, 4.2% of the study co-hort was younger than 65 years old and 4.6% of MDS records were completed on these people. Also, 69.5% of the study cohort was female and 70.4% of MDS records were completed for females. Similar results exist for NH owner-operator status (e.g., 36.8% of the study cohort re-sided in a for-profit NH during the study period and 33. 7% of all MDS assessments were completed on residents who resided in these NHs).
Administrative data revealed that 37.5% of NH resi-dents were newly admitted during the study period, while MDS revealed that 36.9% of residents were newly
admitted during this time (Fig. 1; contingency tables showing denominators are provided in Additional file1). Similarly, 37.1 and 35.4% of residents were reported to have died during the study period, using administrative and MDS data, respectively. Administrative data re-vealed that 14.0% of residents transferred between NHs at least once during the study period, versus 12.2% of residents as defined using MDS.
Counts of healthcare use between data systems are also reported (Fig. 1). Residents were reported to have not been hospitalized during 95.9 and 94.8% of look-back episodes, using the administrative and MDS data, respectively. Similarly, administrative data revealed that residents did not have ED visits ending in hospitalization during 92.4% of look-back episodes, versus 95.5% of look-back episodes reported by MDS. Residents were not examined by a physician during 51.6 and 60.0% of look-back episodes, as reported using administrative and MDS data, respectively. MDS also underreported the fre-quency of physician examinations during these times (i. e., residents were examined by physician on multiple days during 8.0 and 4.2% of all look-back periods, using administrative and MDS data, respectively).
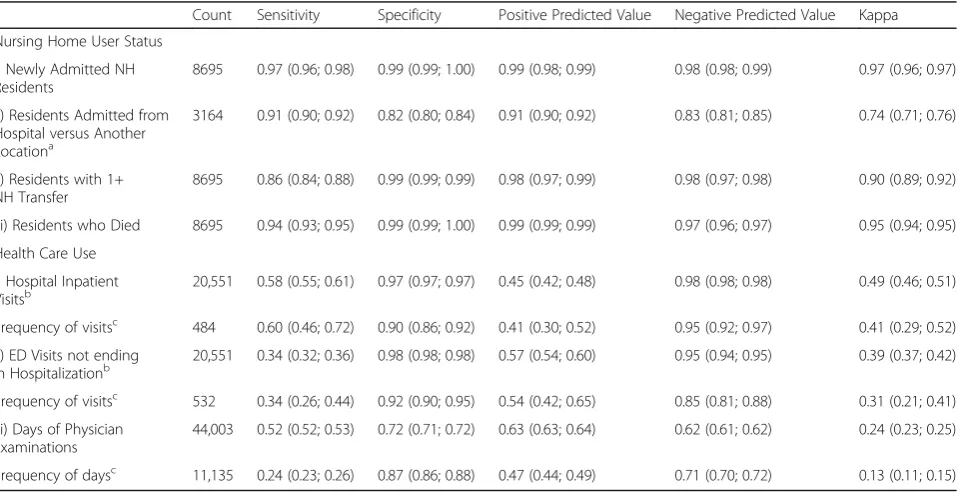
Comparisons of these study outcomes were examined in more detail (Table 3; Additional file 1). Measures of sensitivity, specificity, PPV, and NPV values were all above 0.86 for measures of NH user status, and in most instances these values were greater than 0.96. Kappa (κ) values ranged from 0.90 (NH transfers) to 0.97 (newly admitted residents), indicating very high levels of overall agreement. For residents identified as newly admitted in both systems, MDS also accurately defined residents who transferred into NH from hospital versus from other locations (e.g., κ=0.74). The median (10th, 90th percentile) difference in time between NH admission dates in these systems was 0 (0, 7) days (data not shown). Similarly, for residents who were reported as dying in both systems, the median (10th, 90th percentile) difference in time between death dates was 0 (0, 0) days (data not shown).
[image:5.595.56.291.399.698.2]As compared to administrative data, measures of healthcare use in MDS are characterized by high levels of specificity (e.g., 0.97 for hospitalizations) and NPV (e. g., 0.97 for ED visits not ending in hospitalization). However, considerable underreporting and false positives in MDS occurred (Table 3; Additional file 1). MDS cor-rectly identified hospitalizations during only 58% of the look-back episodes (i.e., sensitivity = 0.58) and con-versely, often over-reported hospitalizations (PPV = 0. 45). Similarly, during periods where agreement between data systems was found, MDS both underestimated (sen-sitivity = 0.60) and over-reported (PPV = 0.41) how often multiple hospitalizations occurred. This same pattern of results exists for non-hospitalized ED visits (sensitivity = Table 2Counts of MDS Records and Characteristics of the
Study Cohort
People (N= 8832)
Assessments (N= 52,818)
A) MDS RECORDSa
No record 137 (1.6) 0 (0)
Admission record 3657 (41.4) 4463 (8.4)
Full assessment record 7977 (90.5) 24,905 (47.2)
Quarterly assessment record
5346 (60.5) 19,098 (36.2)
Discharge record 4083 (46.2) 4352 (8.2)
B) STUDY COHORT
Resident Age
< 65 369 (4.2) 2444 (4.6)
65–74 771 (8.7) 4800 (9.1)
75–84 2742 (31.0) 16,502 (31.2)
85+ 4950 (56.1) 29,072 (55.1)
Resident Sex
Male 2693 (30.5) 15,619 (29.6)
Female 6139 (69.5) 37,199 (70.4)
Nursing Home Owner Operator Type
For Profit 3252 (36.8) 17,820 (33.7)
Not-for-profit 4973 (56.3) 30,093 (60.0)
Bothb 607 (6.9) 4905 (9.3)
a
People had multiple MDS records. Counts of people by assessment type therefore exceed the total cohort size
b
Fig. 1Nursing Home User Status and Episodes of Healthcare Use, by Data Source
Table 3Levels of Agreement Between MDS and Administrative Health Care Use Records; Value (95% Confidence Limits)
Count Sensitivity Specificity Positive Predicted Value Negative Predicted Value Kappa
Nursing Home User Status
i) Newly Admitted NH Residents
8695 0.97 (0.96; 0.98) 0.99 (0.99; 1.00) 0.99 (0.98; 0.99) 0.98 (0.98; 0.99) 0.97 (0.96; 0.97)
ii) Residents Admitted from Hospital versus Another Locationa
3164 0.91 (0.90; 0.92) 0.82 (0.80; 0.84) 0.91 (0.90; 0.92) 0.83 (0.81; 0.85) 0.74 (0.71; 0.76)
ii) Residents with 1+ NH Transfer
8695 0.86 (0.84; 0.88) 0.99 (0.99; 0.99) 0.98 (0.97; 0.99) 0.98 (0.97; 0.98) 0.90 (0.89; 0.92)
iii) Residents who Died 8695 0.94 (0.93; 0.95) 0.99 (0.99; 1.00) 0.99 (0.99; 0.99) 0.97 (0.96; 0.97) 0.95 (0.94; 0.95)
Health Care Use
i) Hospital Inpatient
Visitsb 20,551 0.58 (0.55; 0.61) 0.97 (0.97; 0.97) 0.45 (0.42; 0.48) 0.98 (0.98; 0.98) 0.49 (0.46; 0.51)
Frequency of visitsc 484 0.60 (0.46; 0.72) 0.90 (0.86; 0.92) 0.41 (0.30; 0.52) 0.95 (0.92; 0.97) 0.41 (0.29; 0.52)
ii) ED Visits not ending in Hospitalizationb
20,551 0.34 (0.32; 0.36) 0.98 (0.98; 0.98) 0.57 (0.54; 0.60) 0.95 (0.94; 0.95) 0.39 (0.37; 0.42)
Frequency of visitsc 532 0.34 (0.26; 0.44) 0.92 (0.90; 0.95) 0.54 (0.42; 0.65) 0.85 (0.81; 0.88) 0.31 (0.21; 0.41)
iii) Days of Physician Examinations
44,003 0.52 (0.52; 0.53) 0.72 (0.71; 0.72) 0.63 (0.63; 0.64) 0.62 (0.61; 0.62) 0.24 (0.23; 0.25)
Frequency of daysc 11,135 0.24 (0.23; 0.26) 0.87 (0.86; 0.88) 0.47 (0.44; 0.49) 0.71 (0.70; 0.72) 0.13 (0.11; 0.15)
a
Conducted on residents defined as newly admitted in both data systems
b
Results exclude MDS assessments completed within 90 days of any NH admission (N= 4354)
c
[image:6.595.60.539.461.708.2]0.34, PPV = 0.57) and days of physician examinations (sensitivity = 0.51, PPV = 0.71). Kappa values were cor-respondingly low for all of these measures, ranging from 0.24 for days of physician examinations to 0.49 for in-patient hospitalizations. These results for hospitaliza-tions and ED visits exclude assessments (N= 4354) com-pleted within the first 90 days of NH admission. Outcomes on this subset of assessments were marginally worse than those reported in Table 4 (hospital admis-sions: Sens = .41, Spec = .96, PPV = .59, NPV = .93,κ=.43; ED visits without hospitalization: Sens = .29, Spec = .97, PPV = .49, NPV = .93,κ=.32).
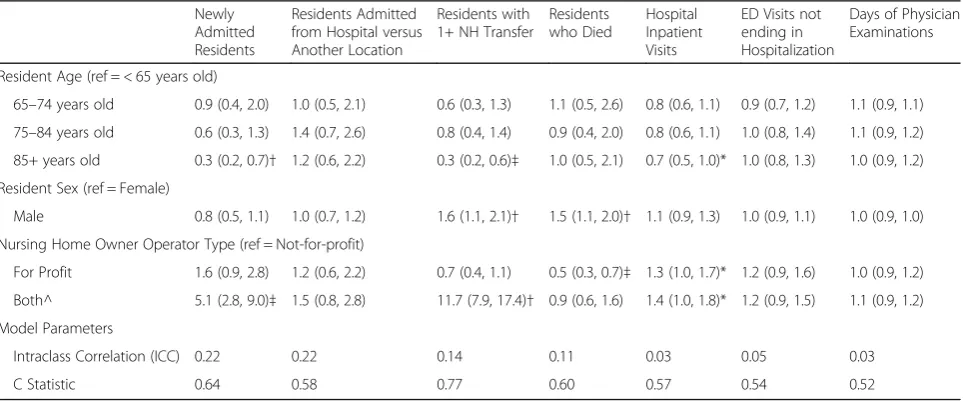
AORs (Table 4) show that the odds of disagreement between data systems was consistent for some but not all residents. Disagreement was significantly lower for residents 85+ years versus < 65 years when defining newly admitted residents (AOR = 0.3; 95% CL = 0.2, 0.7), residents with one or more NH transfers (AOR = 0.3; 95% CL = 0.2, 0.6), and hospitalizations (AOR = 0.7; 95% CL = 0.5, 1.0). The odds of disagreement was signifi-cantly higher for males when measuring NH transfers (AOR = 1.6; 95% CL = 1.1, 2.1) and resident death (AOR = 1.5; 95% CL = 1.1, 2.0). In some instances (new admis-sion, NH transfers, in-patient hospitalization), disagree-ment between data systems was significantly higher for residents who resided in a for-profit versus not-for-profit NH at some time during the study period. ICC values ranged from 0.03 (days of physician examination and hospital inpatient visits) to 0.22 (newly admitted resi-dents and their transfer from location). C-statistic values were 0.60 and lower for all outcomes except when defin-ing newly admitted residents and those with one or more NH transfer, indicating that model covariates did
not effectively discriminate between agreement categories.
Discussion
This study investigates how accurately key measures of NH user status and healthcare use were captured in the InterRAI Minimum Data Set (MDS) assessment instru-ment. Our results show that MDS accurately defined NH residents by their admission and death dates (and therefore length of stay), and also accurately identified newly admitted NH residents who transitioned from hospital and who transferred between NH facilities. However, as compared to administrative data, MDS both undercounted the true rate of healthcare use and pro-vided false positives. Using Cohen’s agreement criteria [34], kappa values for these time specific comparisons were fair when measuring physician visits and non-hospitalized ED visits, and moderate when measuring in-patient hospitalizations.
[image:7.595.58.540.515.716.2]These results are supported by some existing litera-ture. Mor et al. (2011) report that MDS accurately de-fines resident death (sensitivity = 0.84, PPV = 0.95) as compared to administrative data [30], but show that 20% of hospitalizations reported in MDS were not found in administrative records. Similarly, Lix et al. (2015) show that MDS records accurately defined anti-psychotic and anti-depressant drug users, but observed only moderate agreement with administrative data (k = 0.40) when iden-tifying anti-anxiety or hypnotic drug users [27]. Lix et al. (2014) also report that MDS records (versus administra-tive data) accurately define NH residents with some (i.e., those with diabetes) but not all types (e.g., congestive heart failure, COPD, stroke) of chronic disease, and
Table 4Adjusted Odds Ratios (95% Confidence Limits) Comparing the Disagreement between MDS and Administrative Data
Newly Admitted Residents
Residents Admitted from Hospital versus Another Location
Residents with 1+ NH Transfer
Residents who Died
Hospital Inpatient Visits
ED Visits not ending in Hospitalization
Days of Physician Examinations
Resident Age (ref = < 65 years old)
65–74 years old 0.9 (0.4, 2.0) 1.0 (0.5, 2.1) 0.6 (0.3, 1.3) 1.1 (0.5, 2.6) 0.8 (0.6, 1.1) 0.9 (0.7, 1.2) 1.1 (0.9, 1.1)
75–84 years old 0.6 (0.3, 1.3) 1.4 (0.7, 2.6) 0.8 (0.4, 1.4) 0.9 (0.4, 2.0) 0.8 (0.6, 1.1) 1.0 (0.8, 1.4) 1.1 (0.9, 1.2)
85+ years old 0.3 (0.2, 0.7)† 1.2 (0.6, 2.2) 0.3 (0.2, 0.6)‡ 1.0 (0.5, 2.1) 0.7 (0.5, 1.0)* 1.0 (0.8, 1.3) 1.0 (0.9, 1.2)
Resident Sex (ref = Female)
Male 0.8 (0.5, 1.1) 1.0 (0.7, 1.2) 1.6 (1.1, 2.1)† 1.5 (1.1, 2.0)† 1.1 (0.9, 1.3) 1.0 (0.9, 1.1) 1.0 (0.9, 1.0)
Nursing Home Owner Operator Type (ref = Not-for-profit)
For Profit 1.6 (0.9, 2.8) 1.2 (0.6, 2.2) 0.7 (0.4, 1.1) 0.5 (0.3, 0.7)‡ 1.3 (1.0, 1.7)* 1.2 (0.9, 1.6) 1.0 (0.9, 1.2)
Both^ 5.1 (2.8, 9.0)‡ 1.5 (0.8, 2.8) 11.7 (7.9, 17.4)† 0.9 (0.6, 1.6) 1.4 (1.0, 1.8)* 1.2 (0.9, 1.5) 1.1 (0.9, 1.2)
Model Parameters
Intraclass Correlation (ICC) 0.22 0.22 0.14 0.11 0.03 0.05 0.03
C Statistic 0.64 0.58 0.77 0.60 0.57 0.54 0.52
*p< .05;†p< .01;‡p< .001
often with high rates of both under-reporting and false positives [28]. In their literature review, Hutchinson et al. (2010) report that MDS quality indicators are cap-tured with varying degrees of accuracy, also with under-reporting noted for some metrics and over-under-reporting noted for others [25]. The present research supports and extends these findings from the existing literature, by showing that MDS can be used to accurately measure NH user status at the population-level, but not necessar-ily to measure these residents’ healthcare use. As noted by Hirdes et al. (2013), MDS assessments completed using some software systems may be ‘auto-populated’ with responses from the previous assessment, and failure to amend these automatic updates may propagate false positive responses [20].
Accurate data systems are needed to inform NH care innovations. Several authors have investigated the conse-quences of transferring into NH from hospital [36, 37], have profiled the care needs of newly admitted NH resi-dents [8, 38], and have studied how community-based housing options have impacted NH use [39]. Continued research in these and related areas is feasible using MDS as a stand-alone data source, and have value especially when combining the clinical with user status data avail-able in this tool. Similarly, some authors have defined the extent to which NH bed supply varies by geography [40], and MDS can be used to investigate some of the key consequences (e.g., differences in resident profiles, length of NH stay) of these difference healthcare ap-proaches. Additional research needed to support innovation includes measuring the rate and type of emergency department visits made by NH residents [41], comparing these transition rates to assisted living dents, and defining hospitalizations preceding NH resi-dent death [11, 42]. Continued research in these and related areas requires a combination of the MDS and ad-ministrative data systems.
While population-based, the present research was con-ducted using data from a single urban health region. Just as NH use patterns and resident clinical profiles vary across Canada [7], so too may the results of the present research. In addition to housing MDS records, the CIHI national repository houses administrative data capturing some measures of healthcare use defined in this re-search. We recommend that the present study be repli-cated more broadly using CIHI and with jurisdictional comparisons.
Our study results for healthcare use do not account for the nested nature of assessments within residents, and hence the confidence limits for these measures may be too narrow. To partially test this hypothesis, ED use was compared between data sources using one full MDS assessment selected per resident. Results were similar to that shown in the present study (data not shown). Also,
while we recognize that the definition of physician visits is broader in MDS (which includes examinations pro-vided by nurse practitioners and dentists with additional training) than in Medical Claims (ambulatory physician only), during the time of this study few nurse practi-tioners worked in Winnipeg NHs, and dentists do not provide regular NH care in this region. Lastly, our com-parisons of healthcare use are confined to the MDS look-back episodes as defined in this research. While MDS collects healthcare use data intermittently, admin-istrative data captures these records continuously. Given these different approaches, MDS considerably underesti-mates the overall (i.e., daily) measures of healthcare use during the study period; 45.4% versus 17.6% of residents were hospitalized at least once according to the adminis-trative and MDS data, respectively; 51.6% versus 12.3% of residents had one or more ED visits not ending in hospitalization; and 97.6% versus 77.3% of residents were examined by a physician (data not shown).
Conclusions
This study examines how accurately measures of NH user status and healthcare use are captured in the MDS instrument as compared to administrative data. Our re-sults show that MDS accurately defined key NH user characteristics. However, as compared to administrative data, MDS records both undercounted the true rate of key healthcare use measures and often provided false positives. Future studies measuring these healthcare use patterns require MDS linkage to administrative data.
Additional file
Additional file 1:Study Outcome Contingency Tables. Data compare the counts of different nursing homes users (e.g., newly admitted residents, those who transferred between nursing homes, people who died) and measures of healthcare use (e.g., hospital inpatient visits, emergency department visits, physician examinations) between the Minimum Data Set system and administrative files. (DOCX 23 kb)
Abbreviations
AORs:Adjusted odds ratios; CIHI: Canadian Institute of Health Information; CLs: Confidence limits CLs; COPD: Chronic Obstructive Pulmonary Disease; DAD: Hospital Discharge Abstract Database; ED: Emergency department; EDIS: Emergency Department Information System; ICC: Intraclass correlation coefficient; MDS: Minimum Data Set; NH: Nursing home; NPV: Negative predictive values; PPV: Positive predictive values; WHR: Winnipeg health region
Acknowledgments
Funding
This research was supported by a peer reviewed operating grant provided by Research Manitoba. This organization had no input into any of: i) the design of the study; ii) the collection, analysis, and interpretation of data, and; iii) writing of the manuscript.
Availability of data and materials
Data used in this article was derived from administrative health and social data as a secondary use. The data was provided under specific data sharing agreements only for approved use at Manitoba Centre for Health Policy (MCHP). The original source data is not owned by the researchers or MCHP and as such cannot be provided to a public repository. The original data source and approval for use has been noted in the ethics approval and acknowledgment sections of the article. Where necessary, source data specific to this article may be reviewed at MCHP with the consent of the original data providers, along with the required privacy and ethical review bodies.
Authors’contributions
MBD conceived the project, developed and supervised the data analysis plan, and drafted the manuscript. LML assisted with drafting the manuscript. LML, JP, PGN, AG, and SZ critically reviewed the manuscript. ND conducted the data extraction and carried out the data analyses. All authors read and approved the final manuscript.
Ethics approval and consent to participate
Approval to conduct the research was provided by the University of Manitoba Health Research Ethics Board (file #: HS14151) and by the Provincial Health Information Privacy Committee (file #: 2011/2012–26).
Competing interests
The authors declare that they have no competing interests.
Publisher’s Note
Springer Nature remains neutral with regard to jurisdictional claims in published maps and institutional affiliations.
Author details
1Department of Community Health Sciences, Max Rady College of Medicine, Rady Faculty of Health Sciences, University of Manitoba, 408-727 McDermot Avenue, Winnipeg, MB R3E 3P5, Canada.2Manitoba Centre for Health Policy, University of Manitoba, 408-727 McDermot Avenue, Winnipeg, MB R3E 3P5, Canada.3School of Public Health and Health Systems, University of Waterloo, 200 University Avenue W, Waterloo, ON N2L 3G1, Canada.4University of Calgary, 2500 University Dr NW, Calgary, AB T2N 1N4, Canada.5Faculty of Health Sciences, University of Manitoba, 820 Sherbrook St, Winnipeg, MB R3A 1R9, Canada.6George & Fay Yee Centre for Healthcare Innovation, University of Manitoba, 4th floor, 753 McDermot Avenue, Winnipeg, MB R3E 0T6, Canada.
Received: 27 July 2017 Accepted: 3 April 2018
References
1. Statistics Canada. Table 052–0005 - Projected population, by projection scenario, age and sex, as of July 1, Canada, provinces and territories, annual (persons X1,000). 2014http://www5.statcan.gc.ca/cansim/a26?lang=eng&id= 520005Accessed 11 Jul 2017.
2. Vincent GK, Velkoff VA. The next four decades: The older population in the United States, 2010–2050. 2010.https://www.census.gov/prod/2010pubs/ p25-1138.pdfAccessed 17 Jul 2017.
3. Harris-Kojetin L, Sengupta M, Park-Lee E, Valverde R. Long-term Care Services in the United States: 2013 overview. Vital Health Stat 3. 2013:1–107. 4. Statistics Canada. Living arrangements of seniors - families, households and
marital status structural type of dwelling collectives, 2011 census of Population 2012 Sep.http://www12.statcan.gc.ca/census-recensement/ 2011/as-sa/98-312-x/98-312-x2011003_4-eng.pdfAccessed 11 Jul 2017. 5. Berta W, Laporte A, Zarnett D, Valdmanis V, Anderson G. A pan-Canadian
perspective on institutional long-term care. Health Policy. 2006;79:175–94. 6. Doupe M, Fransoo R, Chateau D, Dik N, Burchill C, Soodeen R-A, et al.
Population aging and the continuum of older adult Care in Manitoba.
Winnipeg: Manitoba Centre for Health Policy; 2011.http://mchp-appserv. cpe.umanitoba.ca/reference/LOC_Report_WEB.pdfAccessed 29 May 2013 7. Hirdes JP, Mitchell L, Maxwell CJ, White N. Beyond the“iron lungs of
gerontology”: using evidence to shape the future of nursing homes in Canada. Can J Aging. 2011;30:371–90.
8. Doupe M, St John P, Chateau D, Strang D, Smele S, Bozat-Emre S, et al. Profiling the multidimensional needs of new nursing home residents: evidence to support planning. J Am Med Dir Assoc. 2012;13:487.e9–17. 9. Doupe M, Brownell M, St John P, Strang DG, Chateau D, Dik N. Nursing home adverse events: further insight into highest risk periods. J Am Med Dir Assoc. 2011;12:467–74.
10. Gruber-Baldini AL, Stuart B, Zuckerman IH, Hsu VD, Boockvar KS, Zimmerman S, et al. Sensitivity of nursing home cost comparisons to method of dementia diagnosis ascertainment. Int J Alzheimers Dis. 2009;2009:1–10.
11. Grabowski DC, Stewart KA, Broderick SM, Coots LA. Predictors of nursing home hospitalization: a review of the literature. Med Care Res Rev. 2008;65:3–39. 12. Carron P-N, Mabire C, Yersin B, Bula C. Nursing home residents at the
emergency department: a 6-year retrospective analysis in a Swiss academic hospital. Intern Emerg Med. 2017;12:229–37.
13. Jansen I. Residential long-term care: public solutions to access and quality problems. Healthc Pap. 2011;10:8–22.
14. Kessler C, Williams MC, Moustoukas JN, Pappas C. Transitions of care for the geriatric patient in the emergency department. Clin Geriatr Med. 2013;29:49–69. 15. Meddings J. Using administrative discharge diagnoses to track
hospital-acquired pressure ulcer incidence–limitations, links, and leaps. Jt Comm J Qual Patient Saf. 2015;41:243–5.
16. Roos LL, Gupta S, Soodeen R-A, Jebamani L. Data quality in an information-rich environment: Canada as an example. Can J Aging. 2005;24(Suppl 1):153–70. 17. Roos LL, Menec V, Currie RJ. Policy analysis in an information-rich
environment. Soc Sci Med. 2004;58:2231–41.
18. Jutte DP, Roos LL, Brownell MD. Administrative record linkage as a tool for public health research. Annu Rev Public Health. 2011;32:91–108. 19. Brownell MD, Jutte DP. Administrative data linkage as a tool for child
maltreatment research. Child Abuse Negl. 2013;37:120–4.
20. Hirdes JP, Poss JW, Caldarelli H, Fries BE, Morris JN, Teare GF, et al. An evaluation of data quality in Canada’s continuing care reporting system (CCRS): secondary analyses of Ontario data submitted between 1996 and 2011. BMC Med Inform Decis Mak. 2013;13:27.
21. Zinn J, Feng Z, Mor V, Intrator O, Grabowski D. Restructuring in response to case mix reimbursement in nursing homes: a contingency approach. Health Care Manag Rev. 2008;33:113–23.
22. Hartmaier SL, Sloane PD, Guess HA, Koch GG, Mitchell CM, Phillips CD. Validation of the minimum data set cognitive performance scale: agreement with the mini-mental state examination. J Gerontol A Biol Sci Med Sci. 1995;50:M128–33.
23. Fries BE, Simon SE, Morris JN, Flodstrom C, Bookstein FL. Pain in U.S. nursing homes: validating a pain scale for the minimum data set. Gerontologist. 2001;41:173–9.
24. Burrows AB, Morris JN, Simon SE, Hirdes JP, Phillips C. Development of a minimum data set-based depression rating scale for use in nursing homes. Age Ageing. 2000;29:165–72.
25. Hutchinson AM, Milke DL, Maisey S, Johnson C, Squires JE, Teare G, et al. The resident assessment instrument-minimum data set 2.0 quality indicators: a systematic review. BMC Health Serv Res. 2010;10:166. 26. Gambassi G, Landi F, Peng L, Brostrup-Jensen C, Calore K, Hiris J, et al.
Validity of diagnostic and drug data in standardized nursing home resident assessments: potential for geriatric pharmacoepidemiology. Med Care. 1998; 36:167–79.
27. Lix LM, Yan L, Blackburn D, Hu N, Schneider-Lindner V, Shevchuk Y, et al. Agreement between administrative data and the resident assessment instrument minimum dataset (RAI-MDS) for medication use in long-term care facilities: a population-based study. BMC Geriatr. 2015;15:24. 28. Lix LM, Yan L, Blackburn D, Hu N, Schneider-Lindner V, Teare GF. Validity of
the RAI-MDS for ascertaining diabetes and comorbid conditions in long-term care facility residents. BMC Health Serv Res. 2014;14:17.
29. Wodchis WP, Naglie G, Teare GF. Validating diagnostic information on the minimum data set in Ontario hospital-based long-term care. Med Care. 2008;46:882–7.
31. Doupe M, Finlayson G, Khan S, Yogendran M, McDougall C, Kulbaba C. Supportive Housing For seniors: reform implications for Manitoba’s older adult continuum of care. Winnipeg: Manitoba Centre for Health Policy; 2016.http://mchp-appserv.cpe.umanitoba.ca/reference//
Supportive%20Housing_report_web.pdf. Accessed 6 Sep 2016 32. Canadian Institute for Health Information. CIHI Data Quality Study of the
2005–2006 Discharge Abstract Database. Ottawa; 2009.https://secure.cihi. ca/free_products/DAD_DQ_study_2005_2006_August_2009_e.pdfAccessed 11 Jul 2017.
33. Doupe M, Chateau D, Derksen S, Sarkar J, Lobato de Faria R, S T, et al. Factors affecting emergency department waiting room times in Winnipeg. Winnipeg: Manitoba Centre for Health Policy; 2017.http://mchp-appserv. cpe.umanitoba.ca/reference//ER2011_report_Web.pdfAccessed 8 Apr 2017 34. Cohen S, Syme L. No TitleIssues in the study and application of social
support. In: Cohen S, Syme L, editors. Soc. Support Heal. New York: Academic Press; 1985. p. 3–22.
35. Ene M, Leighton EA, Blue GL, Bell BA, University of South Carolina. Multilevel Models for Categorical Data Using SAS® PROC GLIMMIX: The Basics. 2014. https://support.sas.com/resources/papers/proceedings15/3430-2015.pdf Accessed 17 Jul 2017.
36. Doupe MB, Day S, McGregor MJ, John PS, Chateau D, Puchniak J, et al. Pressure ulcers among newly admitted nursing home residents: measuring the impact of transferring from hospital. Med Care. 2016;54:584–91. 37. Baumgarten M, Margolis D, Gruber-Baldini AL, Zimmerman S, German P,
Hebel JR, et al. Pressure ulcers and the transition to long-term care. Adv Skin Wound Care. 2003;16:299–304.
38. Young Y. Factors associated with permanent transition from independent living to nursing home in a continuing care retirement community. J Am Med Dir Assoc. 2009;10(7):491.
39. Grabowski DC, Stevenson DG, Cornell PY. Assisted living expansion and the market for nursing home care. Health Serv Res. 2012;47:2296–315. 40. Sivananthan SN, Doupe M, McGregor MJ. Exploring the ecology of
Canada’s publicly funded residential long-term care bed supply. Can J Aging. 2015;34:60–74.
41. Gruneir A, Bell CM, Bronskill SE, Schull M, Anderson GM, Rochon PA. Frequency and pattern of emergency department visits by long-term care residents–a population-based study. J Am Geriatr Soc. 2010;58:510–7. 42. Menec VH, Nowicki S, Blandford A, Veselyuk D. Hospitalizations at the end