This is a repository copy of
A semantic-driven model for ranking digital learning objects
based on diversity in the user comments
.
White Rose Research Online URL for this paper:
http://eprints.whiterose.ac.uk/102039/
Version: Accepted Version
Proceedings Paper:
Abolkasim, E, Lau, LMS orcid.org/0000-0003-1062-9059 and Dimitrova, V (2016) A
semantic-driven model for ranking digital learning objects based on diversity in the user
comments. In: Adaptive and Adaptable Learning (Lecture Notes in Computer Science).
11th European Conference on Technology Enhanced Learning, 13-16 Sep 2016, Lyon,
France. Springer Verlag , pp. 3-15.
https://doi.org/10.1007/978-3-319-45153-4_1
© Springer International Publishing Switzerland 2016. This is an author produced version
of a proceedings paper published in Lecture Notes in Computer Science. Uploaded in
accordance with the publisher's self-archiving policy. The final publication is available at
Springer via http://dx.doi.org/10.1007/978-3-319-45153-4_1.
[email protected] https://eprints.whiterose.ac.uk/
Reuse
Unless indicated otherwise, fulltext items are protected by copyright with all rights reserved. The copyright exception in section 29 of the Copyright, Designs and Patents Act 1988 allows the making of a single copy solely for the purpose of non-commercial research or private study within the limits of fair dealing. The publisher or other rights-holder may allow further reproduction and re-use of this version - refer to the White Rose Research Online record for this item. Where records identify the publisher as the copyright holder, users can verify any specific terms of use on the publisher’s website.
Takedown
If you consider content in White Rose Research Online to be in breach of UK law, please notify us by
A Semantic-driven Model for Ranking Digital Learning
Objects Based on Diversity in the User Comments
Entisar Abolkasim, Lydia Lau, Vania Dimitrova
{sc10ena, L.M.S.Lau, V.G.Dimitrova}@Leeds.ac.uk
University of Leeds, Leeds, LS2 9JT, UK
Abstract. This paper presents a computational model for measuring diversity in
terms of variety, balance and disparity. This model is informed by the Stirling’s
framework for understanding diversity from social science and underpinned by semantic techniques from computer science. A case study in learning is used to illustrate the application of the model. It is driven by the desire to broaden learners’ perspectives in an increasingly diverse and inclusive society. For example, interpreting body language in a job interview may be influenced by the different background of observers. With the explosion of digital objects on social platforms, selecting the appropriate ones for learning can be challenging and time consuming. The case study uses over 2000 annotated comments from 51 YouTube videos on job interviews. Diversity indicators are produced based on the comments for each video, which in turn facilitate the ranking of the videos according to the degree of diversity in the comments for the selected domain.
Keywords: diversity model for learning, semantics, user comments analytics, video rating.
1 Introduction
Videos are considered one of the main resources for learning. For instance, YouTube was ranked the second most popular social resource that has been used for informal learning by students [1]. One of the challenges that faces the learners and tutors is the tremendous amount of videos available in social environments (e.g. 300 hours of video are uploaded to YouTube every minute1). Finding the right videos can be time consuming, especially if the learner is seeking knowledge in ill-defined domains such as culture or body language.
Social interactions around videos (e.g. user’s textual comments, likes, dislikes, etc.) offer a rich source of information about the video itself, the users, and the subject domain. These interactions can provide access to diverse perspectives on the subject domain and users can learn from each other vicariously.
In “The Wisdom of Crowds”, Surowiecki argues that one of the elements to have a wise crowd is to have a diverse crowd [2]. A diverse crowd could provide different
perspectives or expertise by users from different backgrounds. This research aims to analyse the social cloud (e.g. YouTube videos with associated user comments, user profiles and other metadata) for the identification and ranking of suitable videos. Combining social computing and semantic techniques, this paper attempts to answer the following research questions:
Q1:What metrics can be used to measure diversity in user comments? Q2: How to rank videos based on diversity in user comments?
The rest of the paper is structured as follows: Section 2 positions this research in related techniques used to analyse user comments and introduces a diversity framework that informed the development of the model for this paper. Section 3 introduces the proposed semantic-driven diversity model and the steps to operationalise the model. Implementation of the model as the Semantic-Driven Diversity Analytic Tool (SeDDAT) is presented in section 4. Section 5 shows the results from the application of SeDDAT in a study with YouTube videos. Section 6 concludes and presents future directions.
2 Related Work
Techniques for Classification and Ranking of Videos. Data mining techniques have been used to exploit the richness of user interactions around videos, especially user comments, for various purposes. For example, a mechanism for filtering comments was proposed by Serbanoiu & Rebedea to identify relevant comments on YouTube videos using classifications and ranking approaches [3]. Similarly, using classification techniques a study by Siersdorfer et al. shows that community feedback on already rated comments can help to filter and predict ratings for possibly useful and unrated comments [4]. Using the state-of-the-art in learning to rank approaches, the user interactions or “social features” were shown to be a promising approach for improving the video retrieval performance in the work introduced by [5]. For improving video categorisation, a text-based approach was conducted to assign relevant categories to videos, where the users’ comments among all the other features gave significant results for predicting video categorisation [6]. Underpinned by data mining techniques, Ammari et al. used user comments on YouTube videos to derive group profiles to facilitate the design of learning simulated environments [7]. Galli et al. conducted a study that used different data mining techniques to analyse user comments to introduce a re-ranking method which produced a new ordered list of videos that is originally provided by the YouTube recommender [8].
interpretation and analysis of social web data with a strong focus on cultural differences - for example, a comparison between Twitter and Sina Weibo [11]. Likewise, recent work has also shown how data analytics can benefit the workforce engagement in enterprise contexts[12].
Framework for Understanding Diversity. An extensive study by Andy Stirling on measures for diversity shows how diversity has gained interest in different disciplines such as ecology, economics and policy [13]. His study shows that diversity has been measured based on three different dimensions, using Stilring’s terminology, variety, balance and disparity. These dimensions have been used in three different ways to indicate the level of diversity: one concept diversity (e.g. variety only as in ecology); or dual concept diversity by combining two dimensions (e.g. variety and balance as used in economics), or triple concept diversity as a combination of variety, balance and disparity (e.g. as an aggregated value of the three dimensions as proposed by Stirling). The Stirling framework has been used in different domains, such as cultural diversity for policy and regulation [14], cultural diversity in the cinema, television and book industries [15], [16], [17], and spread of subjects in interdisciplinary research [18]).
Informed by the Stirling diversity framework, this research uses the semantic annotations of user comments on videos to facilitate video ranking according to diversity.
3 A Semantic-driven Diversity Model
The diversity dimensions, variety, balance and disparity are defined as follow [19, p.709]:
- Variety is “the number of categories into which system elements are apportioned”.
- Balance is “a function of the pattern of apportionment of elements across categories”.
- Disparity is “the manner and degree in which the elements may be distinguished”.
3.1 Preliminaries
Basic Components. The main input of the proposed model for measuring diversity is a set oftextual comments which have been created by users
while interacting with a set of digitalobjects .
Social Cloud Components. Every digital object has a set of users
who commented on where every user has written at least one comment on .
Every comment is associated with a user and a digital object
where has made while interacting with in a social space. The textual
comments created by a user are denoted with ; it is
assumed that . Similarly, the textual comments associated with a digital object are denoted with
It is assumed that some data are available to characterise the digital objects and the users. A digital object can have some metadata that represents key features, e.g. title, author, media type (e.g. video, text, and image), and date. These metadata
are presented as a vector . Similarly, it is assumed that
for every user some profile data is collected, e.g. user age, gender, nationality,
expertise. This is captured in a user profile vector .
Semantic Underpinning. As the starting point for the semantic-driven analytics pipeline, the textual comments would be semantically annotated using an ontology representing the domain of interest. The set of annotated comments will be used for the diversity analysis.
Domain Ontology. The ontology is structured as , where: is a set of ontology entities , where C is a set of classes that represent the domain categories, I is a set of instances representing the individuals which belonging to the classes, and .
H is a set of hierarchical relationships between entities H
subClassOf instanceOf , where defines
that is a subclass of ; and defines that is
an instance of class .
Semantic Annotation. Every comment is tagged with a set of entities , where . The set of ontology entities associated with all
comments in is denoted as .
3.2 Metrics for Domain Diversity
used in annotating the user comments. The categories in which system elements can be apportioned are - domain ontology classes. Therefore, the diversity dimensions - variety, balance and disparity of domain diversity of the digital objects, are defined as follows:
Variety .The number of ontology super classes (i.e. domain categories) into which the entities from annotation (i.e. system elements) are apportioned.
|
(1)
Balance . The proportions of entities from annotation across the ontology super classes that are identified for variety . Shannon Entropy index is used for this research. An alternative, Shannon Evenness, is not used as it will give infinity results when variety is equal to one.
ln , where (2)
Disparity . The manner and degree in which the entities from annotations may be distinguished. This investigates how scattered/dispersed the entities from annotations are within their super classes, which could be referred to as disparity within categories. An internal validation index Ball-Hall [20], based on clustering, is adapted to measure the dispersion dis(c) within each super class where a semantic distance measure (shortest path [21]) is used to calculate the distances between entities for each super class.
, where
min , and
is the medoid2 of category
(3)
2 A medoid is the most centrally located item in a cluster that has minimal average distances to
4 An Overview of SeDDAT- Semantic-driven Diversity Analytics
Tool
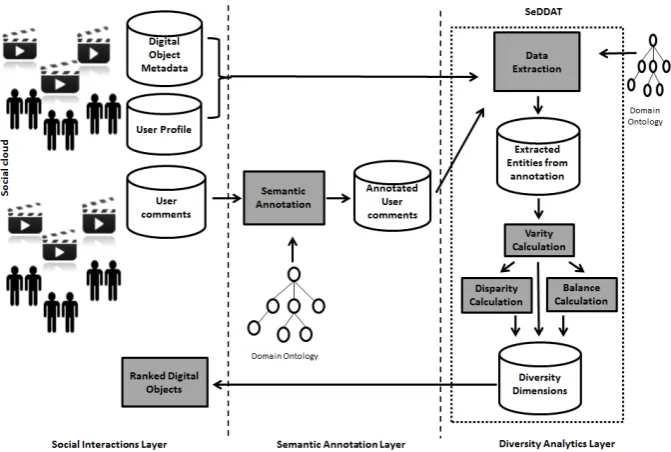
Implementation: The semantically-driven model is operationalised using Java, Jena APIs and SPARQL queries resulting in the semantic-driven diversity analytics tool, SeDDAT. It is depicted on the right hand side of figure 1.
Input: SeDDAT takes as an input the annotated user comments, ontology that represents the domain of interest and used for annotating the comments, user profile and digital object metadata. To calculate domain diversity, SeDDAT retrieves the entities from an xml file and then uses the extracted entities for further calculations.
Output: Given the domain ontology, the algorithms of this tool calculate a vector of the three diversity dimensions (variety, balance and disparity) for each digital object.
Figure 1 shows how SeDDAT is used for measuring the diversity in user comments. The process goes through three layers: the social interactions layer, where the social cloud (user comments, user profile, and digital object metadata) is collected; the semantic layer, where a selected domain ontology is used to annotate the user comments; and the diversity analytics layer, where SeDDAT extracts the entities used in the annotations of the user comments, calculates the diversity of these entities that are mapped against the domain ontology, and ranks the digital objects according to the selected metrics.
Fig. 1. The process of producing ranked digital objects according to diversity in user
[image:7.595.128.464.407.633.2]5 A Case Study- Application of SeDDAT on Video Ranking
In order to test the proposed diversity model, SeDDAT was used on a set of videos about job interviews. Apart from the verbal communications, body language is one of the aspects that may influence the outcome of the interaction between the interviewer and interviewee. In an increasingly inclusive and diverse society, it is important to understand the different possible interpretations of the body language signals to avoid misunderstanding. This study aimed to test the usefulness of the diversity metrics in the selection of videos that contain the most diverse range of comments relating to body language in job interview. There is an assumption that the higher the diversity, the higher the potential of a video for broadening and deepening the learners’ awareness.
5.1 Input Dataset
The input dataset was an xml file, obtained from a previous study by Despotakis [23]. It contains a) videos metadata: video ID, URIs of the YouTube videos on job interviews with associated title, category, author, duration, b) user profiles: nickname, age, gender, location, and occupation, and c) annotated comments: comments with associated ontology entities and their URIs . A body language ontology was used to semantically annotate the comments (an automated process).
The assumption for SeDDAT is that the ontology and the semantic annotations of the comments are sound. Only a subset of the data was used for this study:
- 51 videos were randomly selected from over 200 videos.
- 2949 associated comments were extracted.
- 1223 unique entities from annotations were extracted.
5.2 The Domain Ontology
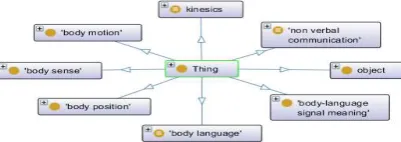
Body language3ontology, which was used to semantically annotate the comments and assist the process of calculating the diversity dimensions, has eight domain categories (top super classes): body motion; body position; body language; body language signal meaning; body sense function; object; kinesics; and nonverbal communication (see figure 2).
Fig. 2.A protégé snapshot of the domain categories (top super classes) of the selected domain
ontology.
[image:8.595.202.403.568.639.2]
5.3 Results
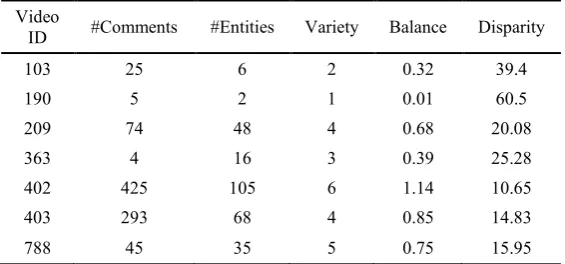
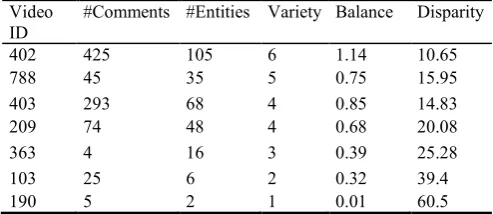
[image:9.595.157.440.274.406.2]The extracted entities from annotations were passed through the three algorithms designed to calculate the diversity dimensions as shown in figure1. The results (data associated with each video as well as diversity dimensions) were saved in a spreadsheet for further analysis. Table 1 shows the diversity dimensions of a sample of seven YouTube videos with some of the associated data: video ID and number of comments and entities from annotations.
Table 1. Sample results of seven YouTube videos sorted by video IDs (smallest to largest).
Video
ID #Comments #Entities Variety Balance Disparity
103 25 6 2 0.32 39.4
190 5 2 1 0.01 60.5
209 74 48 4 0.68 20.08
363 4 16 3 0.39 25.28
402 425 105 6 1.14 10.65
403 293 68 4 0.85 14.83
788 45 35 5 0.75 15.95
5.4 Analyses and Discussion
A combination of quantitative and qualitative analysis of the results was conducted to acquire a deeper understanding on the nature of diversity highlighted. Inspired by Rafols et al. [18], this study used more than one indicator for diversity in user comments. Each diversity dimension was used separately to rank the videos and then in combination. Answers to the following questions were sought:
Q1: What does it mean to be ranked top or bottom based on variety? Q2: What does it mean to be ranked top or bottom based on balance? Q3: What does it mean to be ranked top or bottom based on disparity?
Q4: What if the three diversity dimensions are used in combination for ranking?
Table 2. The sample videos ordered top to bottom according to variety.
Video
ID #Comments #Entities Variety Balance Disparity
402 425 105 6 1.14 10.65
788 45 35 5 0.75 15.95
209 74 48 4 0.68 20.08
403 293 68 4 0.85 14.83
363 4 16 3 0.39 25.28
103 25 6 2 0.32 39.4
190 5 2 1 0.01 60.5
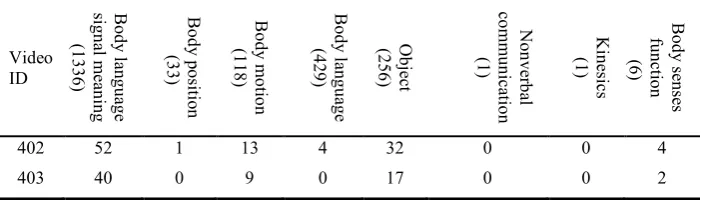
[image:10.595.159.436.427.549.2]2) Ranking Based on Balance. Videos with a high value in balance mean that comments covered evenly the aspects of the domain (i.e. the entities from annotations are well proportioned across domain categories). See table 3 for the list of videos sorted based on balance. The video 402 was ranked top, because the proportions of its entities are higher compared to the other videos. Table 4 shows the proportions, as defined in formula 2 in section 3.2, of the two top videos 402 and 403. For example, body language signal meaning has a total of 1336 entities (classes and instances), and the proportions of videos 402 and 403 are 52 and 40 respectively.
Table 3. The sample videos ordered top to bottom according to balance.
Video
ID #Comments #Entities Variety Balance Disparity
402 425 105 6 1.14 10.65
403 293 68 4 0.85 14.83
788 45 35 5 0.75 15.95
209 74 48 4 0.68 20.08
363 4 16 3 0.39 25.28
103 25 6 2 0.32 39.4
190 5 2 1 0.01 60.5
Table 4. The proportions of videos 402 and 403 across the eight domain categories.
Video ID Bo d y la n g u ag e si g n al m ea n in g (1 3 3 6 ) Bo d y p o si tio n (3 3 ) Bo d y m o tio n (1 1 8 ) Bo d y la n g u ag e (4 2 9 ) O b je ct (2 5 6 ) N o n v er b al co m m u n ic at io n (1 ) K in es ic s (1 ) Bo d y s en se s fu n ct io n (6 )
402 52 1 13 4 32 0 0 4
[image:10.595.123.474.585.685.2]3) Ranking Based on Disparity. Videos with high disparity indicate that the comments cover distinctive aspects within the domain categories (i.e. the entities from annotating the comments are widely scattered within their domain categories). Therefore, to identify videos that triggered distinct domain aspects around their content, the videos can be order largest to smallest according to their disparity value as can be seen in table 5.
Table 5. The sample videos ordered top to bottom according to disparity.
Video
ID #Comments #Entities Variety Balance Disparity
190 5 2 1 0.01 60.5
103 25 6 2 0.32 39.4
363 4 16 3 0.39 25.28
209 74 48 4 0.68 20.08
788 45 35 5 0.75 15.95
403 293 68 4 0.85 14.83
402 425 105 6 1.14 10.65
Ranking based on disparity shifted the top videos (e.g. videos 402 and 403) that were ranked based on variety or balance to the bottom. Similarly, the video 190 that was ranked bottom for variety and balance came top here.
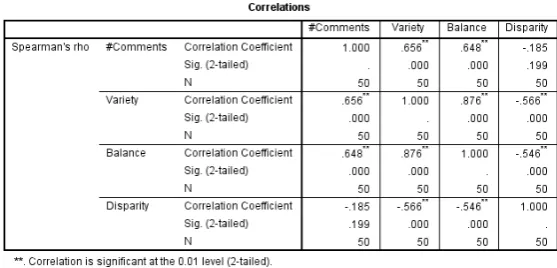
To investigate this further, the ranked videos were inspected closely using the a) video content, b) number of comments, c) number of entities from annotations, and d) samples of user comments. Also, a correlation between the number of user comments and the diversity dimensions was conducted.
Table 6. The correlation between the number of comments and diversity dimensions.
[image:11.595.157.436.498.632.2]domain aspects related to body language (highest variety), and more evenly compared to other videos (highest balance). On closer inspection, the majority of the comments converged around ‘racial’ theme triggered by watching the video or by discussing the company’s policy, which might be the cause of the low disparity value.
A high number of domain-related comments is likely to result in a high number of entities from annotations, but what is important is that the entities from annotating the comments must be: apportioned to many domain categories to be ranked high based on variety, or well proportioned across the domain categories to be ranked high based on balance, or widely dispersed within the domain categories to be ranked high based on disparity.
A visual inspection of the coverage of domain categories by entities was conducted. Figure 3 shows two snapshots of the dispersion of the entities from annotations of videos 190 and 402 within the domain category body language signal meaning. The snapshots are obtained using the framework ViewS4 implemented by Despotakis [23]. As can be seen in figure 3 on the left side, the two entities of video 190 are widely scattered within the domain category (i.e. the semantic distance between the entities is high). On the other hand, the entities on video 402 are closely distributed within the domain category (i.e. the semantic distance is low).
Fig. 3.The dispersion of the entities within the domain category body language signal meaning for the videos 190 and 402.
4) Ranking Based on a Combination of Diversity Dimensions. One way of ranking based on the combined diversity dimensions is to rank based on variety first, then balance and then disparity (e.g. largest to smallest). This was raised by the question
“How to differentiate videos with the same variety index?” such as, videos 403 and 209 in table 5.
4 A graph in ViewS shows the entities (classes and instances) of a domain category (super
[image:12.595.138.453.373.487.2]Table 5. The sample videos are ordered top to bottom according to variety, balance and then disparity.
Video ID
#Comments #Entities Variety Balance Disparity
402 425 105 6 1.14 10.65
788 45 35 5 0.75 15.95
403 293 68 4 0.85 14.83
209 74 48 4 0.68 20.08
363 4 16 3 0.39 25.28
103 25 6 2 0.32 39.4
190 5 2 1 0.01 60.5
6 Conclusion and Future Work
Combining social computing and semantic annotation techniques, this paper presented a novel mechanism to rank videos based on the diversity in user comments of these videos. The proposed ranking tool harvests and utilises the richness of the social cloud, specifically the comments, to benefit tutors and learners by identifying the videos that have the potential to diversify the learner’s perspectives.
In the future, this research will extend to the other components of the social cloud, such as user profiles and videos’ metadata, to a) better understand the diversity of the learners and the users who commented on the videos, and b) enhance the ranking and recommendation. For example, the user profile can help to understand the user/commenter diversity, which in turn can be used with the user’s own comments on videos that he/she has previously watched to nudge him/her to videos that diversify the current knowledge.
Moreover, the effectiveness of using the Stirling diversity index[19] , calculated by aggregating the three diversity dimensions (variety, balance, and disparity), will be investigated, where other indexes for measuring the diversity dimensions will be explored as appropriate.
References
[1] I. Yakin and I. E. Gencel, “The Utilization of Social Media Tools for Informal Learning Activities : A Survey Study,” Mevlana Int. J. Educ., vol. 3, no. 4, pp. 108–117, 2013.
[2] J. Surowiecki, The Wisdom of Crowds. Random House, 2004.
[4] S. Siersdorfer, S. Chelaru, W. Nejdl, and J. San Pedro, “How Useful are Your Comments? - Analyzing and Predicting YouTube Comments and Comment Ratings,” in Proceedings of the 19th international conference on World Wide Web, 2010, vol. 15, pp. 891–900.
[5] S. Chelaru, C. Orellana-Rodriguez, and I. S. Altingovde, “How useful is social feedback for learning to rank YouTube videos?,” World Wide Web, vol. 17, no. 5. pp. 997–1025, 2014.
[6] K. Filippova and K. B. Hall, “Improved video categorization from text metadata and user comments,” Proceedings of the 34th international ACM SIGIR conference on Research and development in Information - SIGIR ’11. p. 835, 2011.
[7] A. Ammari, L. Lau, and V. Dimitrova, “Deriving group profiles from social media to facilitate the design of simulated environments for learning,” Proc. 2nd Int. Conf. Learn. Anal. Knowl. - LAK ’12, no. May, p. 198, 2012.
[8] M. Galli, D. F. Gurini, F. Gasparetti, A. Micarelli, and G. Sansonetti, “Analysis of user-generated content for improving youtube video recommendation,” in CEUR Workshop Proceedings, 2015, vol. 1441.
[9] D. Despotakis, V. Dimitrova, L. Lau, and D. Thakker, “Semantic Aggregation and Zooming of User Viewpoints in Social Media Content,” User Model. Adapt. Pers., vol. 7899, pp. 51–63, 2013.
[10] R. Denaux, V. Dimitrova, L. Lau, P. Brna, D. Thakker, and C. Steiner, “Employing Linked Data and Dialogue for Modelling Cultural Awareness of a User,” in IUI ’14 Proceedings of the 19th international conference on Intelligent User Interfaces, 2014, pp. 241–246.
[11] Q. Gao, F. Abel, G.-J. Houben, and Y. Yu, “A Comparative Study of Users’ Microblogging Behavior on Sina Weibo and Twitter,” User Model. Adapt. Pers., vol. 7379, pp. 88–101, 2012.
[12] A. Bozzon, H. Efstathiades, G.-J. Houben, and R.-J. Sips, “A study of the online profile of enterprise users in professional social networks,” in WWW
’14 Companion Proceedings of the 23rd International Conference on World
Wide Web, pp. 487–492.
[13] A. Stirling, “On the economics and analysis of diversity,” 28, 1998.
[15] J. Farchy and H. Ranaivoson, “Do Public Television Channels Provide More Diversity than Private Ones,” J. Cult. Manag. Policy, 2011.
[16] F. Benhamou and S. Peltier, “APPLICATION OF THE STIRLING MODEL
TO ASSESS DIVERSITY USING UIS CINEMA DATA,” UNESCO Inst.
Stat., pp. 1–73, 2010.
[17] F. Benhamou and S. Peltier, “How should cultural diversity be measured? An application using the French publishing industry,” J. Cult. Econ., vol. 31, pp. 85–107, 2007.
[18] I. Rafols, L. Leydesdorff, A. O’Hare, P. Nightingale, and A. Stirling, “How journal rankings can suppress interdisciplinary research: A comparison between Innovation Studies and Business & Management,” Research Policy, vol. 41, no. 7. pp. 1262–1282, 2012.
[19] A. Stirling, “A general framework for analysing diversity in science, technology and society.,” J. R. Soc. Interface, vol. 4, no. February, pp. 707– 719, 2007.