Foreign trade
Commerce extérieur
eurostat
OFICINA ESTADÍSTICA DE LAS COMUNIDADES EUROPEAS DE EUROPÆISKE FÆLLESSKABERS STATISTISKE KONTOR STATISTISCHESAMT DER EUROPÄISCHEN GEMEINSCHAFTEN ΣΤΑΤΙΣΤΙΚΗ ΥΠΗΡΕΣΙΑ ΤΩΝ ΕΥΡΩΠΑΪΚΩΝ ΚΟΙΝΟΤΗΤΩΝ STATISTICAL OFFICE OF THE EUROPEAN COMMUNITIES OFFICE STATISTIQUE DES COMMUNAUTÉS EUROPÉENNES ISTITUTO STATISTICO DELLE COMUNITÀ EUROPEE
BUREAU VOOR DE STATISTIEK DER EUROPESE GEMEENSCHAPPEN SERVIÇO DE ESTATÍSTICA DAS COMUNIDADES EUROPEIAS
L2920 Luxembourg Tél. 43011 Télex: Comeur Lu 3423
B1049 Bruxelles, bâtiment Berlaymont, rue de la Loi 200 (bureau de liaison) — Tél. 2351111
Las publicaciones de Eurostat están clasificadas por temas y por series. La clasificación se encuentra al final de la obra. Para mayor información sobre las publicaciones, rogamos se pongan en contacto con Eurostat.
Para los pedidos, diríjanse a las oficinas de venta cuyas direcciones figuran en la página interior de la contracubierta.
Eurostats publikationer er klassificeret efter emne og serie. En oversigt herover findes bag i hæftet. Yderligere oplysninger om publikationerne kan fås ved henvendelse til Eurostat.
Bestilling kan afgives til de salgssteder, der er anført på omslagets side 3.
Die Veröffentlichungen von Eurostat sind nach Themenkreisen und Reihen gegliedert. Die Gliederung ist hinten in jedem Band aufgeführt. Genauere Auskünfte über die Veröffentlichungen erteilt Eurostat. Ihre Bestellungen richten Sie bitte an die Verkaufsbüros, deren Anschriften jeweils auf der dritten Umschlagseite der Veröffentlichungen zu finden sind.
Οι εκδόσεις της Eurostat ταξινομούνται κατά θέμα και κατά σειρά. Η ακριβής ταξινόμηση αναφέρεται στο τέλος κάθε έκδοσης. Για λεπτομερέστερες πληροφορίες σχετικά με τις εκδόσεις, μπορείτε να απευθύνεσθε στην Eurostat.
Για τις παραγγελίες μπορείτε να απευθύνεσθε στα γραφεία πώλησης, των οποίων οι διευθύνσεις αναγράφονται στη σελίδα 3 του εξωφύλλου.
Eurostat's publications are classified according to themes and series. This classification is indicated at the end of the publication. For more detailed information on publications, contact Eurostat.
Orders are obtainable from the sales offices mentioned on the inside back cover.
Les publications de l'Eurostat sont classées par thème et par série. Cette classification est précisée à la fin de l'ouvrage. Pour des informations plus détaillées sur les publications, contactez l'Eurostat.
Pour les commandes, adressez-vous aux bureaux de vente dont les adresses sont indiquées à la page 3 de la couverture.
Le pubblicazioni dell'Eurostat sono classificate per tema e per serie. Tale classificazione è precisata alla fine dell'opera. Per informazioni più dettagliate sulle pubblicazioni rivolgersi all'Eurostat.
Per eventuali ordinazioni rivolgersi a uno degli uffici di vendita ¡ cui indirizzi figurano nella 3a pagina della copertina.
De publikaties van Eurostat zíjn ingedeeld naar onderwerp en serie. Deze indeling ¡s achter in het boek opgenomen. Voor nadere informatie over de publikaties kunt u zich wenden tot Eurostat.
Gelieve bestellingen op te geven bij de verkoopbureaus, waarvan de adressen op bladzijde 3 van de omslag zíjn vermeld.
As publicações do Eurostat estão classificadas por tema e por série. Esta classificação está indicada no fim da obra. Para mais informações sobre as publicações é favor contactar Eurostat.
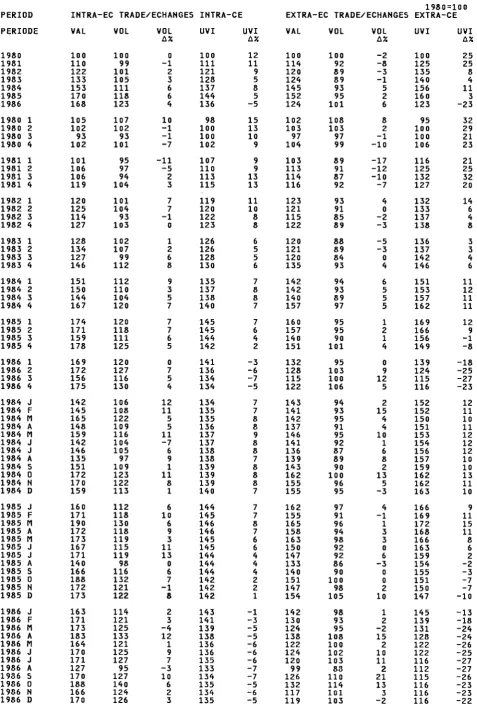
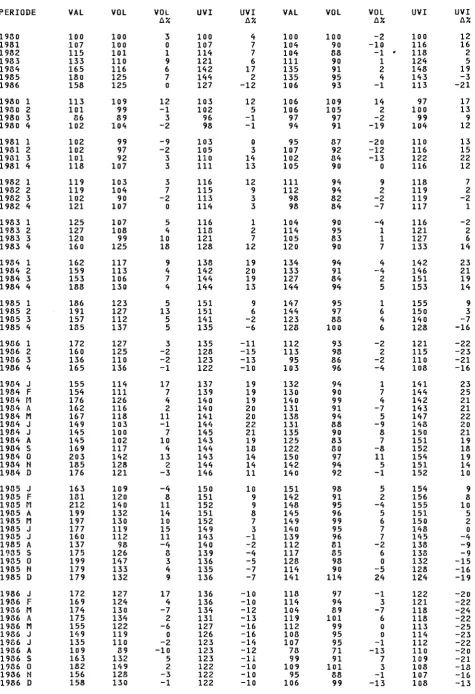
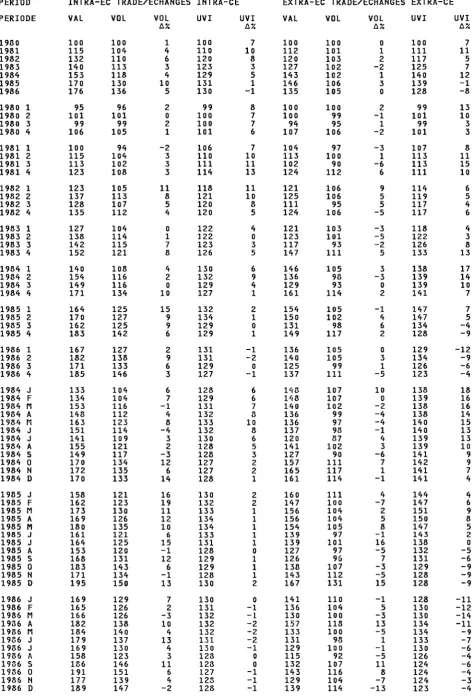
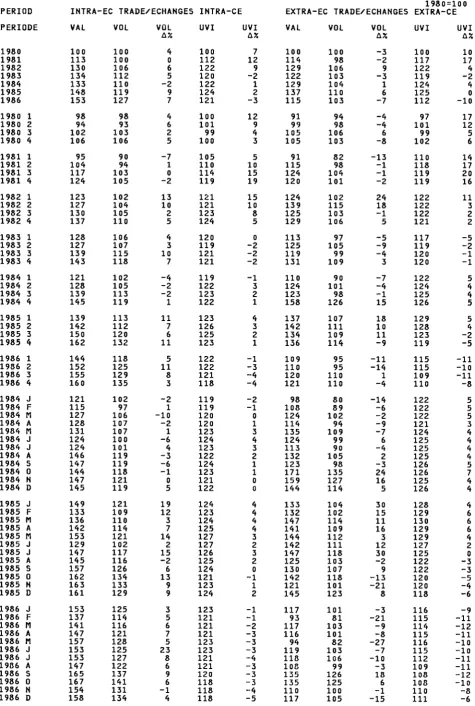
EC EXTERNAL TRADE INDICES
1980-1986
Cataloguing data can be found at the end of this publication. Une fiche bibliographique figure à la fin de l'ouvrage.
Luxembourg: Office des publications officielles des Communautés européennes, 1988
ISBN 92-825-7787-2
Cat.: CA-47-86-470-2A-C
© CECA-CEE-CEEA, Bruxelles·Luxembourg, 1988
Reproduction is authorized, except for commercial purposes, provided the source ¡s acknowledged. Reproduction autorisée, sauf à des fins commerciales, moyennant mention de la source.
Table of contents
Introduction V Methodology and sources VII
Symbols and abbreviations used XI
Listofgraphs XII Ustoftables ". XIII
Graphs XLI Tables 1
Introduction
1. The Statistical Office of the European Communities pre-sents in this volume a selection of the indices ¡t calculates for the external trade of the European Community. The indices give a breakdown of the trend in the value of trade into volume and price components. They provide essential information to anyone wishing to analyse and comprehend the fast changing patterns involved. The evolution of the value of trade over time is affected by changes in prices and exchange rates, and by changes in the quantities transacted. Indices are used to disentangle these two sets of effects. Usually an index system is chosen so that the change in the volume index multiplied by that of the price index gives the value change between two periods.
2. In principle there are two ways of obtaining price informa-tion. One is by means of direct price surveys of importers and exporters, and the other is to use the value and quantity data collected by customs. Only the latter is available for all Member States. Therefore Eurostat's price indices are calcu-lated from unit values, customs values (in ECU) divided by customs quantities. Unit value indices have the advantage of being cheap to produce, since they use data collected for other purposes. In addition unit values are available for most items that are traded, and they refer to those that are actually passing through customs thus avoiding problems of fictitious list prices and time lags.
3. On the other hand the customs data, especially the quantities, may be subject to error from rounding, estimation, or the unavailability of the most appropriate units. Moreover unit values can be calculated only for the product categories distinguished by customs, and thus may be the average price of several distinct products. This is especially true for manufactured products. A change in the composition of a category will cause its unit value to change independently of any real price movements. In the short run, random variations in composition about a stable underlying market share will add to the 'noise' in the index.
4. However it might be expected, other things being equal, that the variability of an index due to this cause would decrease as the number of transactions covered by the index increases. It would therefore be a lesser problem for EC wide indices. Nevertheless, in order to maximize the quality of the indices, two guiding principles are followed. The first is to use the most disaggregated data available, namely the detailed harmonized data received by Eurostat for each Member State's trade with each of its individual partner countries. The second principle is to remember that the aim is for a decomposition into price and volume. Individual unit value changes which move in a way that would imply an implausi-ble underlying price movement are not used, but are replaced by an estimate. These matters are treated in more detail in the section on methodology.
5. The tables are divided into four sections, one for each of the product classifications presented. Inevitably there is a small amount of overlap. It should be noted that similarly named product categories in different classifications are in fact defined differently, and will have somewhat different index values. The first section deals with indices on the UN's SITC revision 2 product classification, one used extensively for comparative analyses of trade. Here will be found indices for total trade and the major groupings such as manufactured goods or fuels. Indices for SITC sections (1-digit codes) and divisions (2-digit codes) are also featured.
6. The second section gives indices classified by the UN broad economic categories. Their headings are given in the list of tables and are described in detail in UN Statistical Paper Series M, No 53 Rev 1. The definition of consumption goods, capital goods and intermediate goods are those suggested by the UN, except that passenger motor cars are allocated to the first of these three categories, rather than being left as a separate one.
7. The third section presents indices following Eurostat's NACE-CLIO (R 44) classification of industrial branches. This ¡s used in Eurostat's publications on national accounts, input-output tables, and industrial statistics. Of course the bran-ches covering service industries cannot be represented here, as their external transactions do not fall into the customs net.
8. The final section covers the Community's Nimexe product classification. This is the classification used for the basic trade data received by Eurostat and contains some 8 000 detailed positions. The indices ¡n this section are those for Nimexe chapters (2-digit codes), and trade in primary agricultural products.
9. The advantage of calculating indices for the European Community as a whole is that the flows involved encompass a large number of transactions. For this reason we have felt able to provide a greater level of product detail than is normally found. Nevertheless tabulations for some categ-ories of products have had to be omitted where the level of trade is low, where the products traded are not homogeneous (such as works of art), or where an index is still judged to be in need of improvement. Systematic long run trends in the quality of a few product groups, often due to technical innovation, do distort their unit value indices. These quality changes are difficult to quantify unambiguously, and pure price indices suffer from the same problem if no quality adjustment can made.
10. Occasionally there ¡s an asterisk next to an index in the tables, which indicates that the coverage of the index (i.e. the number of the ¡terns used to calculate it) was rather low (25-50 % by value). The method used to measure coverage is described in the section on methodology.
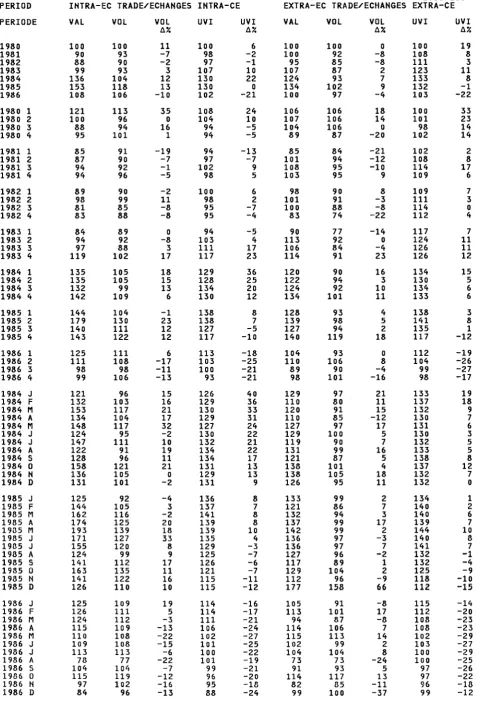
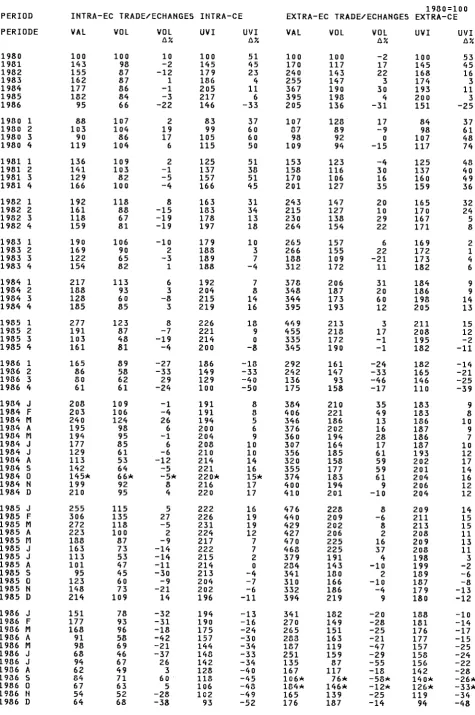
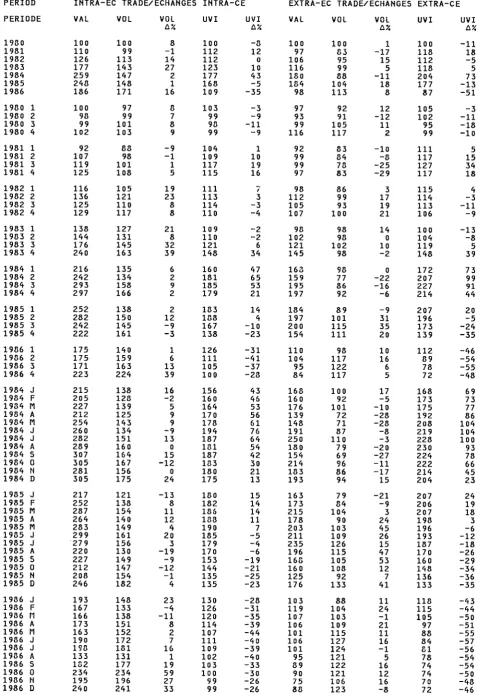
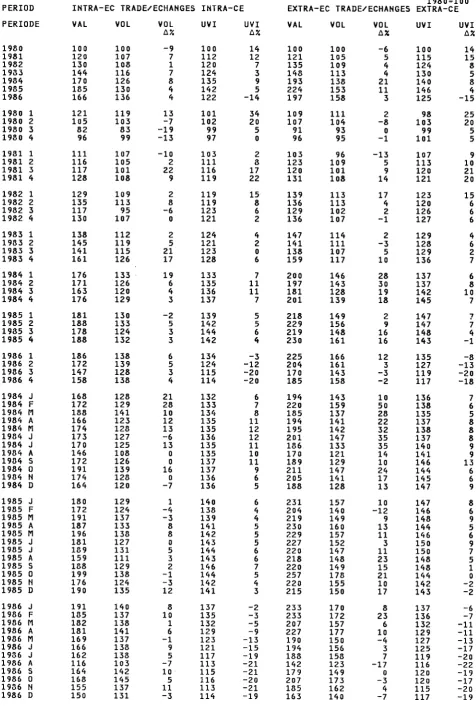
11. Each table gives the value, volume and unit value indi- import based one is generally considered to be the more ces for imports or exports of a particular product with two reliable,
partner country zones, intra-EC (i.e. Member States) and
extra-EC (i.e. third countries). The import index for intra-EC 12. A selection of indices is published in Eurostat's External trade is calculated from a different set of data from the trade monthly statistics bulletin and ¡n its External trade corresponding export index, even though they notionally statistical yearbook. They are also available to internal users refer to the same flow. In practice the figure will differ a on data banks and on magnetic tape. Further information can little because of time lags, changes in export destination be obtained from the Statistical Office from the address given etc., and ¡f a single intra-EC indicator is required, the in the inside front cover.
Methodology and sources
1. Fixed base versus chained indices 2. The choice of index formula
1.1. This note sets out how Eurostat's new indices are calculated. They are chained Fisher indices. In other words the base year is revised each year. The 1981 indices have 1980 as base year, the 1982 indices have 1981 as base year, and so on. Each index is expressed in terms of 1980 as reference year (i.e. 1980 = 100) by chaining all the links back to 1980.
1.2. Chain indices have a number of attractive properties. Firstly, the index weights used to construct the index will be derived from recent values and quantities traded, and will therefore be responsive to the changing patterns of world trade. To take a concrete example, suppose that fuel prices have decreased dramatically between the start of the decade and last year, but between last year and this all prices have been static. A rise in fuel imports and a fall in nonfuel imports compared with last year which kept the total value of imports unchanged would be recorded by a chain index as no change in volume or price, which seems intuitively reasonable. A Laspeyres volume index with a fixed base year at the start of the decade would indicate a rise in volume between last year and this year, and the corresponding Paasche unit value index would register a fall.
1.3. A second advantage of chain indices ¡s that they are more robust in the face of an abnormal event such as a temporary peak in commodity prices. If this occurs in the base year, ¡t can distort the weighting of a fixed base index until it is rebased.
1.4. Thirdly, since the Nimexe nomenclature changes each year due to the subdivision and regrouping of headings, better quality comparisons are made by focusing on year to year changes. The alternative ¡s to find groupings of products which are stable over several years, and these are neces sarily defined over a wider range of products.
1.5. There was a particular interest in obtaining good indi cators of shortterm trends expressed by users of external trade indices within the Commission. Few would deny the superiority of chain indices for this purpose, and this was a major factor in their favour. Though there is more controversy about their advantages as medium and longterm indicators, many recent writers on the subject ' prefer them.
2.1. Member States use various formulae for external trade indices. Four countries use a Fisher formula for unit value indices, four use Paasche and one uses Laspeyres. Users within the Commission expressed a preference for indices of the Fisher type. Over the longer term, chain Laspeyres and Paasche indices drift apart. There does not appear to be any reason to believe that one gives a 'truer' result than the other. On the other hand, the chain Fisher index, a geometric average of the two, closely approximates the TömqvistTheil approximation to the Divisia index, which has a number of advocates.
2.2. The conventional index formulae are used for calculat ing the links between year y, month m and the average of the previous year, y1. These are :
Laspeyres unit value link
n u (y, m, i)
(1)
See for example Koves P. Index theory and economic reality Akademiai Kiado, Budapest 1983 or Hansen B., Lucas E. 'On the accuracy of index numbers', Review of income and wealth, March 1984.
i = 1
n
Σ
i=1
ν i y i , ¡ι
V ( y i , i )
Paasche unit value link
η
Σ
i = 1
η
Σ
i=1
Value link
η
Σ
¡ = 1
η
Σ
i=1
ν (y, m, i)
v(y, m, i) / /
V (y, m, i)
V ( y 1 , i )
Laspeyres volume link
Value link
U ( y 1 , i )
/ u(y, m, i) 1
U ( y - 1 , i)
(2)
(3)
Paasche unit value link (4)
Value link Laspeyres unit value link
Fisher link
Geometrie average of Laspeyres and Paasche links
(5)
(6) where:
ν (y, m, i) = value of trade ¡η item i for month m of year y 12
V ( y 1. ' ) = 7¿ Σ ν ( y 1 , m, i) m=1
u (y, m, i) = unit value of item i for month m of year y U ( y 1 , i) = average unit value of item i for year y 1 , calculated as total value divided by total quantity.
3. Data sources
3.1. The primary source of data are the Nimexe trade statistics supplied to Eurostat by Member States. For the following groups of products, unit values calculated from trade data give an unsatisfactory indication of price perform ance :
SITC 524 Radioactive and associated materials
SITC 667 Pearls, precious and semiprecious stones, unworked or worked
SITC 792 Aircraft and associated equipment and parts thereof
SITC 793 Ships, boats and floating structures
SITC 883 Cinematograph film, exposed and developed SITC 896 Works of art, collectors pieces and antiques SITC 897 Jewellery, goldsmiths' and silversmiths' wares,
etc.
At present the unit value index of each of these groups is imputed from some other unit value series. If suitable price indices became available some time ¡n the future, these would be used instead.
3.2. The raw data is classified by reporting country, flow (i.e. export or import), Nimexe 6digit product code and partner country. Eurostat's approach is to work with the data at this disaggregated level. Most countries calculate their indices after the data has been summed over partner countries. This has certain apparent advantages. In addition to reducing the dimensionality of the data, the number of discontinuities is also reduced. Trade with a particular partner may be recorded for only a few months of the year, whereas there is trade with some partners in most months. On the other hand, even a cursory examination of unit value series broken down by partner show that the hypothesis of a common unit value is very often unrealistic. This is because either identical goods are priced differently for different partners or because the Nimexe 6digit category covers a number of qualities or types of product and different partners demand or supply different proportions of these individual products. Therefore unit values calculated after aggregation over partners may fluctuate because of the instability of the partner breakdown of trade. In all events, information on the partner is a means of stratifying unit values into more homogeneous product
calculated from the original data without aggregation over partners or products. A system of imputation is used to deal with the problem of no trade in particular product/partner combinations when calculating Laspeyres indices. This ¡s described ¡n section 4.6.
3.3. One exception to the rule of no aggregation is when there is a change in the Nimexe nomenclature between two years. In this case products are combined to produce an aggregate with the same definition in both years. Changes in the geographical definition of partner countries are much less frequent, and are usually insignificant. In this case the most appropriate match between pairs of countries ¡s made. 3.4. For most Nimexe codes there is information on value, weight, and sometimes a second, supplementary quantity unit, such as number of items. In this case two types of unit value (value per tonne and value per supplementary unit) are available. Unit value based on supplementary unit (for example, value per car) is not necessarily a better measure of price than value per tonne. If there are many products covered by a Nimexe code, and if their price ¡s perfectly correlated with their weight, then value per tonne will be unaffected by fluctuations in product composition. The reliability with which weight is measured compared with the reliability of supplementary unit data is also a factor. For European data, evidence from indirect tests suggests that weight seems to have been measured more reliably than supplementary units in the recent past, and so average value per tonne is generally used. Over the longer run, technical change can cause substantial biases in both types of unit value.
3.5. One of the ways in which confidentiality is treated in the Nimexe data is to allocate trade in a product to a special geographic code, in order to disguise the true origin or destination. There are some product categories where this is an important factor, and the proportion of the declared value of trade to the actual value for a particular geographic zone (such as extraEC) may fluctuate from month to month. No attempt is made at present to adjust the volume indices to compensate for these fluctuations.
3.6. Nimexe data records the value of trade in thousands of ECUs. All Eurostat's unit value indices are expressed ¡n ECU terms. Conversion to other currency units is straightforward. 3.7. The EC data is also broken down by statistical regime, so that, for example, goods imported for intermediate proces sing before reexport to their country of origin, are dis tinguished from normal imports. Only normal trade ¡s used to calculate unit value indices, though total trade is used for the value indices from which the volume indices are calculated. 3.8 Especially in the early part of the period, there were errors in the monthly value data for which no corrections were available. However there are corrected annual figures. These are used for calculating the annual volume links which are chained back to the reference year, 1980. Where they occur, the errors in the monthly data may distort the monthly and quarterly volume figures. Thus, for the more detailed indices, there are occasional discrepancies between the annual average of the monthly and quarterly volume indices and the annual index. A large revision in the annual figure is signalled by an 'R' in the tables.
4. Dealing with extreme values
4.1. Administrative procedures for validating trade data vary between Member States. Since the monthly data used by Eurostat to calculate indices ¡s the first release of this data, and there are often substantial revisions made subsequently, it is an unfortunate fact that extremely large unit value movements are not at all unusual. In one sample of data, a unit value 700 times greater than that of the previous year was found. In generalwe would expect underlying prices to move fairly smoothly. These extremes are therefore due either to recording errors of one sort or another or due to data inhomogeneity. Whatever the cause, a wide tailed distribu-tion of unit value changes can lead to the usual index formulae giving unreliable results. Eurostat's method for dealing with wide tailed distributions ¡s to use the robust regression technique first described by Hinich and Talwar. '
4.2. The method starts from the observation that whereas the levels of unit values across partner countries may differ, the changes in levels are very similar not only across partner countries but also across related products, compared with the background level of noise in unit value data. A study by Eurostat however show significant variation across reporting countries (related to exchange rate fluctuations etc.). Euro-stat has therefore divided the raw data into some 200 blocks of data for each reporting country and flow. Each block contains data for a particular set of Nimexe 6-digit product codes and partner countries. The assumption is that within a block, every data item can be described by the stochastic model :
log u (y, m, i)
= c (y, m) + e (y, m, i) (7) u (y, m - 1 , i)
where u (y, m, i) = unit value of ítem i for month m of year y c (y, m) = underlying price change for the biock e (y, m, i) = a random error term symmetrically distri-buted about zero, whose variability depends on the item in question.
Equation (7) can be thought of as a regression model with observations running over items ¡ within a block. It would be a rather trivial one if the random error term had constant variance for all i. However it seems more appropriate in an index context to carry out weighted regression with the value of trade of each item as weight. This is tantamount to assuming that the variance of the logarithm of a unit value ratio is inversely proportional to the value of trade. There are both theoretical reasons why this can be so, and empirical evidence which shows that this ¡s often the case. To transform equation (7) into a homoskedastic form, we rewrite ¡t as :
V V ( y - 1 , i )
W ( y - 1 , i) c (y, m) + e* (y, m, i) log u (y, m, ¡)
u (y, m - 1 , i)
(8)
4.3. Judgemental procedures ware used in setting up the blocks. At present the blocks have been defined at the SITC 3-digit level, amalgamating those whose level of trade ¡s low, and splitting some by partner or by product where this seems desirable.
Hinich M.J., Talwar P.P. 'A simple method for robust regression', Journal of the American Statistical Association, March 1975.
4.4. Hinich and Talwar give a method for robust estimation which, unlike the majority of other methods developed in recent years, is practicable to carry out on a large scale. In the one regressor variable case :
y¡ = Xiß + e¡
the method reduces to :
(¡) find ßm, the median value of y¡/x¡ (ii) writing e¡ = y¡ - x^m
ê (72) - ê (28)
(9)
calculate s =
1.654
where ê (72) is the 72nd percentile of the e¡ and ê (28) is the 28th percentile.
(iii) Carry out an ordinary least squares regression on (9) but drop observations for which
le¡l > 4s
Applying this procedure to equation (8), and after a little algebraic manipulation, the method becomes :
(a) find ßm, the median of the monthly unit value ratios over all ¡terns ¡n the block for which a unit value change can be calculated;
(b) accept a unit value ratio as reasonable if : 1_ g. u (y, m, i) / ßm s; f¡
f, u (y, m - 1 , i) /
where f¡ (rejection factor for i) 4s
(10)
= exp
V V ( y - 1 , i ) (11)
and s is the variability measure, calculated as in step (ii) above.
It should be noted that once the rejection factors are calculated they do not need to be revised frequently if they are fairly stable. Eurostat's current practice ¡s to take the largest value of s over a 12-month period to calculate rejection factors.
4.5. Thus step (b) above is to accept all items whose unit value change relative to the median is within certain bounds (for example, plus or minus 10 %) and provisionally to reject the others. Provisional rejection of an item may be because the month m-1 unit value is of doubtful quality, or is not available. Therefore these items are tested for a second pair of months. The change between months m and m+1 is used if available. In this case the item is accepted if it passes the second test. In the normal production situation, month m+1 will not be available and so the second test is based on the change between months m and the latest previous month available. These rules were derived from a simple probabili-stic model for the frequency of high and low outliers. Though they weed out unsuitable observations in the current month, they do not give any protection against outliers ¡n the base year unit values. One solution would be to calculate the annual figure only from monthly data where the item was accepted. However for technical reasons this is not done at present. Instead an item is also rejected if the ratio of the unit value in the current month to that of the base year is outside the range (0.2, 5.0). This range was set after examination of the typical price variations found in seasonal and non-seasonal goods, and can be changed in unusual circum-stances.
4.6. The above rejection procedure has the virtue of identify-ing a unit value ratio as extreme relative to the general movement in its class from month to month. This is likely to be more satisfactory than setting an arbitrary range for absolute fluctuations. The next step ¡s simply to calculate Laspeyres and Paasche links for the current month (with last year as base year) using only the accepted items. These are then used as an estimate of the unit value change for items whose unit values have either been rejected or are missing because of zero trade. The definitions of the blocks are independent of the final indices that may be required and the data ¡n them may be used by more than one final index. For each index a record is kept of the current month value and the base year value of items with non-zero trade which are accepted by the above tests. Current weighted and base period weighted coverage ratios are then calculated (i.e. accepted value as a percentage of total value), and a compromise figure is found by taking a geometric average. The tables flag items with coverage between 25 and 50 % with an asterisk. Items with a coverage below 25 % are not printed.
4.7. The value links for indices are calculated using all items and not just accepted ones. The implied assumption is that doubtful unit values are due to errors in quantities alone. Typically some 11 % of the current value of items is rejected on average.
4.8. The exclusion of items with a small value of trade in the previous year has been found to make virtually no impact on the index links which are weighted by value. However there is a considerable saving ¡n computational effort since there are large numbers of such items. Currently items with an annual value less than about 100 000 ECU are not considered when calculating indices, though this threshold can be lowered in special cases. The effect is to ignore items which on average account for about 3 % of the total value of trade, but over 70 % of all items by number.
5. Calculation of the monthly index links
5.1. At the start of each year, Nimexe codes for the previous year and the coming year are related to blocks and to indices. The cumulative annual data for the previous year is proces-sed, retaining items defined by flow/product/reporter/partner which are above the threshold for each block. Changes in the Nimexe nomenclature are dealt with by creating product aggregates with the same constituents in both years. There are also a small number of seasonal Nimexe codes which are combined to give a product aggregate which covers the whole year. The rejection factor for each retained item is established at this stage.
5.2. Each month, the 'isolated' monthly Nimexe data for retained items is processed, block by block, to give Las-peyres and Paasche numerators and denominators for all the primary indices that are required. This information is stored, and used by a further stage of processing to produce index links at a higher level of product or zone aggregation. In addition external price information may be combined with the unit value indices at this stage.
5.3. Sets of indices are calculated for several product nomenclatures. Higher levels of product class (e.g. SITC 1-digit section) are found by aggregation over constituent
indices. Sometimes a constituent index for a small country is missing for one month. Either its trade ¡s zero, or its coverage ratio is judged too low to give a reliable unit value index. It has been found that it is not satisfactory to calculate the larger index simply by aggregating those constituent indices that happen to be available, since if the missing index has a large weight and has a level different from the others, the aggre-gate index will jump about as the index comes in and out. Eurostat's solution is to estimate the level of the missing unit value index, and (in the case of zero trade) the index weight for the Paasche index.
5.4. Indices for the EC as reporting unit are found by combining the country indices. Laspeyres unit value and volume index links for the EC are calculated by weighting the Laspeyres index links for each individual reporting country by the value of trade for the previous year (before elimination of items under a threshold). A Community value link is found by combining the value links for individual reporters with the same weights, and the Paasche links for the EC are found by division.
5.5. Nimexe data is usually not available for new Member States in the years before they joined the Community. For this reason, the EC index is calculated without Greece as reporting country up until December 1981 and refers to the Community without Spain and Portugal up until December 1985. Thus a 1986 index is calculated by splicing the change for EUR 12 between 1985 and 1986 into the 1985 level of the index for EUR 10.
6. Chaining the links
6.1. The monthly Laspeyres and Paasche volume links give an index of volume for the current month relative to the average of the previous year. Quarterly volume links are calculated by summing the monthly links over the quarter and dividing by three. Annual links are found by summing the quarterly links and dividing by four. Similarly the quarterly and annual value links are found by averaging the monthly links. The quarterly and annual unit value links are found as follows :
Laspeyres (quarterly or annual) unit value link
Value link Paasche volume link
Paasche (quarterly or annual) unit value link Value link
Laspeyres volume link
(12)
(13)
6.2. Once the annual links have been found, the indices are chained backwards to 1980 in the usual way :
Index for month m of year y with base 1980 = 100
= 100 χ (Annual link for 1981, base 1980) χ (Annual link for 1982, base 1981) χ ...
x (Annual link for year y - 1, base y - 2) χ (Monthly link for month m, year y, base y
Symbols and abbreviations used
BEC Broad economic categories
NACE CLIO General industrial classification of economic activities in the European Communities used in the input/output tables
Nimexe Nomenclature of goods for the external trade statistics of the Community and statistics of trade between Member States
SITC Standard international trade classification, revision 2 ECU European currency unit
Eurostat Statistical Office of the European Communities UVI Unit value indices (denominated in ECU) VAL Value indices (denominated in ECU) VOL Volume indices
Δ% Percentage change from the corresponding period of the year before * Index with a low coverage ratio
R Index for which the annual value data has been substantially revised nes Not elsewhere specified
List of graphs
1. EC import and export indices for total trade XLI 2. Food, beverages and tobacco (SITC 0+1) XLII 3. Crude materials other than fuels; animal and vegetable oils, fats and waxes (SITC 2+4) XLIV
4. Mineral fuels, lubricants and related materials (SITC 3) XLVI
5. Manufactured goods (SITC 5-8) XLVIII 6. Consumption goods, including passenger motor cars (BEC) L
7. Capital goods (BEC) LII 8. Intermediate goods (BEC) LIV 9. Ferrous and non-ferrous ores and metals (NACE-CLIO R 4413) LVI
10. Chemical products (NACE-CLIO R 44 17) LVIII 11. Agricultural and industrial machinery (NACE-CLIO R 44 21) LX
12. Motor vehicles (NACE-CLIO R 44 27) LXII 13. Textiles and clothing (NACE-CLIO R 44 41) LXIV
List of tables
Section 1: Indices by SITC revision 2 sections and divisions
EC import indices
1.1 1.2 1.3 1.4 1.5 1.6 1.7 1.8 1.9 1.10 1.11 1.12 1.13 1.14 1.15 1.16 1.17 1.18 1.19 1.20 1.21 1.22 1.23 1.24 1.25 1.26 1.27 1.28 1.29 1.30 1.31 1.32 1.33 1.34 1.35 1.36 1.37 1.38 1.39 1.40 1.41 1.42 1.43 1.44 1.45 1.46 1.47 1.48 1.49 1.50
SITC SITC SITC
0-8 0-2, 4-8 0+1 SITC 2+4 SITC SITC SITC SITC SITC SITC SITC SITC SITC SITC SITC SITC SITC SITC SITC SITC SITC
5-8 0 1 2 3 4 5 6 7 8 01 02 03 04 05 06 07 SITC 08 SITC SITC SITC SITC SITC
09 11 21 22 23 SITC 24 SITC SITC
25 26 SITC 27 SITC SITC SITC SITC SITC SITC
28 29 33 34 41 42 SITC 43 SITC SITC SITC SITC SITC SITC SITC SITC SITC SITC SITC SITC
51 52 53 54 55 56 58 59 61 62 63 64
Total, excluding goods not classified by kind 2 Total, excluding fuels and goods not classified by kind 3
Food, beverages and tobacco 4 Crude materials other than fuels; animal and vegetable oils, fats and waxes 5
Manufactured goods 6 Food and live animals chiefly for food 7
Beverages and tobacco 8 Crude materials other than fuels 9 Mineral fuels, lubricants and related materials 10
Animal and vegetable oils, fats and waxes 11
Chemicals 12 Manufactured goods classified chiefly by material 13
Machinery and transport equipment 14 Miscellaneous manufactured articles 15 Meat and meat preparations 16 Dairy products; eggs 17 Fish, crustaceans and molluscs 18
Cereals and cereal preparations 19
Vegetables and fruit 20 Sugar, sugar preparations and honey 21
Coffee, tea, cocoa, spices 22 Feedingstuffs for animals 23 Miscellaneous edible products 24
Beverages 25 Hides, skins and furskins, raw 26
Oil seeds and oleaginous fruit 27
Crude rubber 28 Cork and wood 29 Pulp and waste paper 30
Textile fibres 31 Crude fertilizers and crude minerals 32
Metalliferous ores and metal scrap 33 Crude animal and vegetable materials nes 34 Petroleum, petroleum products and related materials 35
Gas, natural and manufactured 36
Animal oils and fats 37 Fixed vegetable oils and fats 38
Animal and vegetable oils and fats, processed, and waxes 39
Organic chemicals 40 Inorganic chemicals 41 Dyeing, tanning and colouring materials 42
Medicinal and pharmaceutical products 43 Essential oils and perfume materials; toilet, polishing and cleansing preparations 44
Fertilizers, manufactured 45 Artificial resins and plastic materials, and cellulose esters and ethers 46
Chemical materials and products nes 47 Leather, leather manufactures nes and dressed furskins 48
Rubber manufactures nes 49 Cork and wood manufactures (excluding furniture) 50
Paper, paperboard and articles of paper pulp, of paper or of paperboard 51
1.51 1.52 1.53 1.54 1.55 1.56 1.57 1.58 1.59 1.60 1.61 1.62 1.63 1.64 1.65 1.66 1.67
SITC 65 SITC 66 SITC 67 SiTC 68 SITC 69 SITC 72 SITC 73 SITC 74 SITC 76 SITC 77 SITC 78 SITC 81 SITC 82 SITC 83 SITC 84 SITC 85 SITC 89
EC export indices
1.68 1.69 1.70 1.71 1.72 1.73 1.74 1.75 1.76 1.77 1.78 1.79 1.80 1.81 1.82 1.83 1.84 1.85 1.86 1.87 1.88 1.89 1.90 1.91 1.92 1.93 1.94 1.95 1.96 1.97 1.98 1.99 1.100 1.101 1.102 1.103 1.104 1.105 1.106 1.107 1.108 1.109 1.110 1.111 1.112
SITC 0-8 SITC 0-2, SITC 0+1 SITC 2+4 SITC 5-8 SITC 0 SITC 1 SITC 2 SITC 3 SITC 4 SITC 5 SITC 6 SITC 7 SITC 8 SITC 01 SITC 02 SITC 03 SITC 04 SITC 05 SITC 06 SITC 07 SITC 08 SITC 09 SITC 11 SITC 21 SITC 22 SITC 23 SITC 24 SITC 25 SITC 26 SITC 27 SITC 28 SITC 29 SITC 33 SITC 42 SITC 43 SITC 51 SITC 52 SITC 53 SITC 54 SITC 55 SITC 58 SITC 59 SITC 61 SITC 62
Textile yarn, fabrics, make-up articles nes 52 Non-metallic mineral manufactures nes 53
Iron and steel 54 Non-ferrous metals 55 Manufactures of metals nes 56 Machinery specialized for particular industries 57
Metalworking machinery 58 General industrial machinery and equipment nes 59
Telecommunications and sound recording and reproducing apparatus 60
Electrical machinery, apparatus and appliances nes 61
Road vehicles 62 Sanitary, plumbing, heating and lighting fixtures and fittings nes 63
Furniture and parts thereof 64 Travel goods, handbags and similar containers 65
Articles of apparel and clothing accessories 66
Footwear 67 Miscellaneous manufactured articles nes 68
Total, excluding goods not classified by kind 69 4-8 Total, excluding fuels and goods not classified by kind 70
Food, beverages and tobacco 71 Crude materials other than fuels; animal and vegetable oils, fats and waxes 72
Manufactured goods 73 Food and live animals chiefly for food 74
Beverages and tobacco 75 Crude materials other than fuels 76 Mineral fuels, lubricants and related materials 77
Animal and vegetable oils, fats and waxes 78
Chemicals 79 Manufactured goods classified chiefly by material 80
Machinery and transport equipment 81 Miscellaneous manufactured articles 82 Meat and meat preparations 83 Dairy products; eggs 84 Fish, crustaceans and molluscs 85
Cereals and cereal preparations 86
Vegetables and fruit 87 Sugar, sugar preparations and honey 88
Coffee, tea, cocoa, spices 89 Feedingstuffs for animals 90 Miscellaneous edible products 91
Beverages 92 Hides, skins and furskins, raw 93
Oil seeds and oleaginous fruit 94
Crude rubber 95 Cork and wood 96 Pulp and waste paper 97
Textile fibres 98 Crude fertilizers and crude minerals 99
Metalliferous ores and metal scrap 100 Crude animal and vegetable materials nes 101 Petroleum, petroleum products and related materials 102
Fixed vegetable oils and fats 103 Animal and vegetable oils and fats, processed, and waxes 104
Organic chemicals 105 Inorganic chemicals 106 Dyeing, tanning and colouring materials 107
Medicinal and pharmaceutical products 108 Essential oils and perfume materials; toilet, polishing and cleansing preparations 109
Artificial resins and plastic materials, and cellulose esters and ethers 110
Chemical materials and products nes 111 Leather, leather manufactures nes and dressed furskins 112
Rubber manufactures nes 113
1.113 1.114 1.115 1.116 1.117 1.118 1.119 1.120 1.121 1.122 1.123 1.124 1.125 1.126 1.127 1.128 1.129 1.130 1.131
SITC 63 SITC 64 SITC 65 SITC 66 SITC 67 SITC 68 SITC 69 SITC 72 SITC 73 SITC 74 SITC 76 SITC 77 SITC 78 SITC 81 SITC 82 SITC 83 SITC 84 SITC 85 SITC 89
Cork and wood manufactures (excluding furniture) 114 Paper, paperboard and articles of paper pulp, of paper or of paperboard 115
Textile yarn, fabrics, make-up articles nes 116 Non-metallic mineral manufactures, nes 117
Iron and steel 118 Non-ferrous metals 119 Manufactures of metals nes 120 Machinery specialized for particular industries 121
Metalworking machinery 122 General industrial machinery and equipment nes 123
Telecommunications and sound recording and reproducing apparatus 124
Electrical machinery, apparatus and appliances nes 125
Road vehicles 126 Sanitary, plumbing, heating and lighting fixtures and fittings nes 127
Furniture and parts thereof 128 Travel goods, handbags and similar containers 129
Articles of apparel and clothing accessories 130
Footwear 131 Miscellaneous manufactured articles nes 132
Section 2: Indices by UN broad economic category
EC import indices
2.1 2.2 2.3 2.4 2.5 2.6 2.7 2.8 2.9 2.10 2.11 2.12 2.13 2.14 2.15 2.16 2.17 2.18 2.19 2.20 2.21 2.22 2.23 2.24 2.25 2.26 2.27 2.28
BEC 1 BEC 11 BEC 111 BEC 112 BEC 12 BEC 121 BEC 122 BEC 2 BEC 21 BEC 22 BEC 3 BEC 31 BEC 32 BEC 321 BEC 322 BEC 4 BEC 41 BEC 42 BEC 5 BEC 51 BEC 53 BEC 6 BEC 61 BEC 62 BEC 63
Consumption goods, including passenger motorcars 134
Capital goods 135 Intermediate goods 136 Food and beverages 137
— Primary 138 — Mainly for industry 139
— Mainly for household consumption 140
— Processed 141 — Mainly for industry 142
— Mainly for household consumption 143
Industrial supplies nes 144
— Primary 145 — Processed 146 Fuels and lubricants 147
— Primary 148 — Processed 149
— Motor spirit 150 — Other 151 Capital goods, and parts and accessories 152
— Capital goods (except transport equipment) 153
— Parts and accessories 154 Transport equipment and parts and accessories 155
— Passenger motor cars 156 — Parts and accessories 157 Consumer goods nes 158
— Durable 159 — Semi-durable 160 — Non-durable 161
EC export indices
2.29 2.30 2.31 2.32 2.33 2.34 2.35
BEC 1 BEC 11 BEC 111 BEC 112
Consumption goods, including passenger motor cars 162
Capital goods 163 Intermediate goods 164 Food and beverages 165
— Primary 166 — Mainly for industry 167
— Mainly for household consumption 168
2.36 2.37 2.38 2.39 2.40 2.41 2.42 2.43 2.44 2.45 2.46 2.47 2.48 2.49 2.50 2.51 2.52 2.53 2.54 2.55 2.56
BEC 12 BEC 121 BEC 122 BEC 2 BEC 21 BEC 22 BEC 3 BEC 31 BEC 32 BEC 321 BEC 322 BEC 4 BEC 41 BEC 42 BEC 5 BEC 51 BEC 53 BEC 6 BEC 61 BEC 62 BEC 63
— Processed 169 — Mainly for industry 170
— Mainly for household consumption 171
Industrial supplies nes 172
— Primary 173 — Processed 174 Fuels and lubricants 175
— Primary 176 — Processed 177
— Motor spirit 178 — Other 179 Capital goods, and parts and accessories 180
— Capital goods (except transport equipment) 181
— Parts and accessories 182 Transport equipment and parts and accessories 183
— Passenger motor cars 184 — Parts and accessories 185 Consumer goods nes 186
— Durable 187 — Semi-durable 188 — Non-durable 189
Section 3: Indices by NACE-CLIO (R44) branch
EC import indices
3.1 3.2 3.3 3.4 3.5 3.6 3.7 3.8 3.9 3.10 3.11 3.12 3.13 3.14 3.15 3.16 3.17
R44 01 R44 07 R44 13 R44 15 R44 17 R44 19 R44 21 R44 27 R44 31 R44 33 R44 35 R44 37 R44 41 R44 43 R44 45 R44 47 R44 49
Agricultural, forestry and fishery products 192 Crude petroleum, natural gas and petroleum products 193
Ferrous and non-ferrous ores and metals 194
Non-metallic mineral products 195
Chemical products 196 Metal products except machinery and transport equipment 197
Agricultural and industrial machinery 198 Motor vehicles ? 199
Meats, meat preparations and preserves, other products from slaughtered animals 200
Milk and dairy products 201 Other food products 202
Beverages 203 Textiles and clothing 204
Leathers, leather and skin goods, footwear 205 Timber, wooden products and furniture 206
Paper and printing products 207 Rubber and plastic products 208
EC export indices
3.18 3.19 3.20 3.21 3.22 3.23 3.24 3.25 3.26 3.27 3.28 3.29 3.30 3.31 3.32 3.33 3.34
R44 01 R44 07 R44 13 R44 15 R44 17 R44 19 R44 21 R44 27 R44 31 R44 33 R44 35 R44 37 R44 41 R44 43 R44 45 R44 47 R44 49
Agricultural, forestry and fishery products
Crude petroleum, natural gas and petroleum products Ferrous and non-ferrous ores and metals
Non-metallic mineral products Chemical products
Metal products except machinery and transport equipment Agricultural and industrial machinery
Motor vehicles
Meats, meat preparations and preserves, other products from slaughtered animals Milk and dairy products
Other food products Beverages
Textiles and clothing
Leathers, leather and skin goods, footwear Timber, wooden products and furniture Paper and printing products
Rubber and plastic products
209 210 211 212 213 214 215 216 217 218 219 220 221 222 223 224 225
Section 4: Indices by Nimexe chapter
EC import indices
4.1 4.2 4.3 4.4 4.5 4.6 4.7 4.8 4.9 4.10 4.11 4.12 4.13 4.14 4.15 4.16 4.17 4.18 4.19 4.20 4.21 4.22 4.23 4.24 4.25 4.26 4.27 4.28 4.29 4.30 4.31 4.32 4.33 4.34 4.35 4.36 4.37 4.38 4.39 4.40 4.41 4.42 4.43 4.44 4.45 4.46 4.47 4.48 4.49 4.50 4.51 4.52 4.53 4.54 4.55 4.56 4.57 4.58 4.59 4.60 4.61 4.62
Nimexe Nimexe Nimexe Nimexe Nimexe Nimexe Nimexe Nimexe Nimexe Nimexe Nimexe Nimexe Nimexe Nimexe Nimexe Nimexe Nimexe Nimexe Nimexe Nimexe Nimexe Nimexe Nimexe Nimexe Nimexe Nimexe Nimexe Nimexe Nimexe Nimexe Nimexe Nimexe Nimexe Nimexe Nimexe Nimexe Nimexe Nimexe Nimexe Nimexe Nimexe Nimexe Nimexe Nimexe Nimexe Nimexe Nimexe Nimexe Nimexe Nimexe Nimexe Nimexe Nimexe Nimexe Nimexe Nimexe Nimexe Nimexe Nimexe Nimexe Nimexe Nimexe
01-24 02 03 04 05 06 07 08 09 10 11 12 15 16 17 18 19 20 22 23 25 26 27 28 29 30 31 32 33 34 35 37 38 39 40 41 42 44 47 48 51 53 54 55 56 57 58 59 60 61 62 63 64 68 69 70 73 74 75 76 77 78
Primary agricultural products .. Meat and edible meat offals Fish, crustaceans and molluscs Dairy produce; eggs; honey Products of animal origin nes .. Live trees and other plants Edible vegetables Edible fruit and nuts
Coffee, tea, maté and spices . . . Cereals
Products of the milling industry Oil seeds and oleaginous fruit Animal and vegetable fats and oils Preparations of meat, fish, etc Sugar and sugar confectionery Cocoa and cocoa preparations Preparations of cereals, flour or starch Preparations of vegetables, fruit, etc Beverages, spirits and vinegar
Residues and waste from the food industries
Salt; sulphur; earths and stone, plastering materials, lime and cement Metallic ores, slag and ash
Mineral fuels, etc
Inorganic chemicals; organic and inorganic compounds of precious metals, etc. Organic chemicals
Pharmaceutical products Fertilizers
Tanning and dyeing extracts; dyes, colours, paints, etc
Essential oils and resinoids; perfumery, cosmetic or toilet preparations Soap, etc
Albuminoidal substances; glues; enzymes Photographic and cinematographic goods Miscellaneous chemical products
Artificial resins and plastic materials, cellulose esters and ethers, etc. .. Rubber, synthetic rubber, factice and articles thereof
Raw hides and skins and leather Articles of leather, etc
Wood and articles of wood; wood charcoal Paper making material
Paper and paperboard; articles of paper pulp, of paper or of paperboard Man-made fibres (continuous)
Wool and other animal hair Flax and ramie
Cotton
Man-made fibres (discontinuous) Other vegetable textile materials Carpets, etc
Wadding and felt; twine, cordage, ropes and cables, etc Knitted and crocheted goods
Articles of apparel and clothing accessories of textile fabric Other made up textile articles
Old clothing and other textile articles; rags Footwear, etc
Articles of stone, of plaster, of cement, of asbestos, of mica, etc Ceramic products
Glass and glassware
Iron and steel and articles thereof Copper and articles thereof Nickel and articles thereof Aluminium and articles thereof
Magnesium and beryllium and articles thereof Lead and articles thereof
228 229 230 231 223 233 234 235 236 237 238 239 240 241 242 243 244 245 246 247 248 249 250 251 252 253 254 255 256 257 258 259 260 261 262 263 264 265 266 267 268 269 270 271 272 273 274 275 276 277 278 279 280 281 282 283 284 285 286 287 288 289
4.63 Nimexe 79 Zinc and articles thereof 290 4.64 Nimexe 80 Tin and articles thereof 291 4.65 Nimexe 81 Other base metals employed in metallurgy and articles thereof 292
4.66 Nimexe 83 Miscellaneous articles of base metal 293 4.67 Nimexe 84 Boilers, machinery and mechanical appliances; parts thereof 294
4.68 Nimexe 85 Electrical machinery and equipment; parts thereof 295 4.69 Nimexe 87 Vehicles, other than railway or tramway rolling-stock, and parts thereof 296
4.70 Nimexe 92 Musical instruments; sound recorders, etc.; television ¡mage recorders, etc 297
4.71 Nimexe 94 Furniture; bedding, etc 298 4.72 Nimexe 96 Brooms, brushes, powder puffs and sieves 299
4.73 Nimexe 97 Toys, games and sports requisites, parts thereof 300
4.74 Nimexe 98 Miscellaneous manufactured articles 301
EC export indices
4.75 4.76 4.77 4.78 4.79 4.80 4.81 4.82 4.83 4.84 4.85 4.86 4.87 4.88 4.89 4.90 4.91 4.92 4.93 4.94 4.95 4.96 4.97 4.98 4.99 4.100 4.101 4.102 4.103 4.104 4.105 4.106 4.107 4.108 4.109 4.110 4.111 4.112 4.113 4.114 4.115 4.116 4.117 4.118 4.119 4.120 4.121 4.122 4.123 4.124
Nimexe Nimexe Nimexe Nimexe Nimexe Nimexe Nimexe Nimexe Nimexe Nimexe Nimexe Nimexe Nimexe Nimexe Nimexe Nimexe Nimexe Nimexe Nimexe Nimexe Nimexe Nimexe Nimexe Nimexe Nimexe Nimexe Nimexe Nimexe Nimexe Nimexe Nimexe Nimexe Nimexe Nimexe Nimexe Nimexe Nimexe Nimexe Nimexe Nimexe Nimexe Nimexe Nimexe Nimexe Nimexe Nimexe Nimexe Nimexe Nimexe Nimexe
01-24 02 03 04 05 06 07 08 09 10 11 12 15 16 17 18 19 20 22 23 25 27 29 30 32 33 34 35 37 38 39 40 41 42 44 47 48 51 53 54 55 56 57 58 59 60 61 62 63 64
Primary agricultural products .. Meat and edible meat offals Fish, crustaceans and molluscs Dairy produce; eggs; honey Products of animal origin nes .. Live trees and other plants Edible vegetables
Edible fruit and nuts
Coffee, tea, maté and spices . . . Cereals
Products of the milling industry Oil seeds and oleaginous fruit Animal and vegetable fats and oils Preparations of meat, fish, etc Sugar and sugar confectionery Cocoa and cocoa preparations Preparations of cereals, flour or starch Preparations of vegetables, fruit, etc Beverages, spirits and vinegar
Residues and waste from the food industries
Salt; sulphur; earths and stone, plastering materials, lime and cement. Mineral fuels, etc
Organic chemicals Pharmaceutical products
Tanning and dyeing extracts; dyes, colours, paints, etc
Essential oils and resinoids; perfumery, cosmetic or toilet preparations , etc
Soap,
Albuminoidal substances; glues; enzymes Photographic and cinematographic goods Miscellaneous chemical products
Artificial resins and plastic materials, cellulose esters and ethers, etc. .. Rubber, synthetic rubber, factice and articles thereof
Raw hides and skins and leather Articles of leather, etc
Wood and articles of wood; wood charcoal Paper making material
Paper and paperboard; articles of paper pulp, of paper or of paperboard Man-made fibres (continuous)
Wool and other animal hair Flax and ramie
Cotton
Man-made fibres (discontinuous) Other vegetable textile materials Carpets, etc
Wadding and felt; twine, cordage, ropes and cables, etc Knitted and crocheted goods
Articles of apparel and clothing accessories of textile fabric Other made up textile articles
Old clothing and other textile articles; rags Footwear, etc
302
303
304
305
306
307
308
309
310
311
312
313
314
315
316
317
318
319
320
321
322
323
324
325
326
327
328
329
330
331
332
333
334
335
336
337
338
339
340
341
342
343
344
345
346
347
348
349
350
351
4.125 4.126 4.127 4.128 4.129 4.130 4.131 4.132 4.133 4.134 4.135 4.136 4.137 4.138 4.139 4.140 4.141 4.142 4.143
Nimexe 68 Nimexe 69 Nimexe 70 Nimexe 73 Nimexe 74 Nimexe 75 Nimexe 76 Nimexe 77 Nimexe 78 Nimexe 79 Nimexe 83 Nimexe 84 Nimexe 85 Nimexe 87 Nimexe 92 Nimexe 94 Nimexe 96 Nimexe 97 Nimexe 98
Articles of stone, of plaster, of cement, of asbestos, of mica, etc 352
Ceramic products 353 Glass and glassware 354 Iron and steel and articles thereof 355
Copper and articles thereof 356 Nickel and articles thereof 357 Aluminium and articles thereof 358 Magnesium and beryllium and articles thereof 359
Lead and articles thereof 360 Zinc and articles thereof 361 Miscellaneous articles of base metal 362
Boilers, machinery and mechanical appliances; parts thereof 363
Electrical machinery and equipment; parts thereof 364 Vehicles, other than railway or tramway rolling-stock, and parts thereof 365
Musical instruments; sound recorders, etc.; television image recorders, etc 366
Furniture; bedding, etc 367 Brooms, brushes, powder puffs and sieves 368
Toys, games and sports requisites, parts thereof 369
Miscellaneous manufactured articles 370
Table des matières
Introduction XXIII Méthodologie et sources XXV
Abréviations et signes employés XXX
Liste des graphiques XXXI Liste des tableaux XXXII
Graphiques XLI Tableaux 1
Introduction
1. L'Office statistique des Communautés européennes pu-blie, dans le présent volume, une sélection des indices qu'il calcule pour le commerce extérieur de la Communauté. Ces indices ventilent en un élément «volume» et un élément «prix» l'évolution de la valeur des échanges, et fournissent des informations essentielles à ceux qui souhaitent analyser et appréhender le changement rapide des structures de ces échanges. L'évolution chronologique de la valeur des échanges est influencée par les variations des prix et des cours de change, d'une part, et par celles des volumes négociés, d'autre part. Des indices sont utilisés pour analyser les effets respectifs de ces deux types de variations. En général, on choisit un système d'indices, de telle manière que la variation de l'indice de volume, multipliée par celle de l'indice des prix, donne la variation de valeur d'une période à l'autre.
2. En principe, il existe deux moyens d'obtenir des informa-tions sur les prix, à savoir les enquêtes directes sur les prix, effectuées auprès des importateurs et des exportateurs, d'une part, et l'utilisation des données en valeur et en quantité, collectées par les administrations douanières, d'au-tre part. Seules les données douanières sont disponibles pour tous les États membres, et c'est la raison pour laquelle les indices des prix d'Eurostat sont calculés à partir de valeurs unitaires, obtenues en divisant les valeurs doua-nières en ECU par les quantités douadoua-nières. Les indices de valeur unitaire offrent l'avantage d'être établis au moindre coût, puisqu'ils sont fondés sur des données collectées à d'autres fins. En outre, des valeurs unitaires sont disponibles pour la plupart des produits échangés et portent sur les produits passant effectivement la douane, ce qui permet d'éviter les problèmes liés aux prix fictifs et aux décalages chronologiques.
3. Cependant, les données douanières, et en particulier les données en volume, peuvent être entachées d'erreurs dues à l'arrondissement des chiffres, aux estimations ou à la non-disponibilité des unités les plus appropriées. En outre, les valeurs unitaires ne peuvent être calculées que pour les catégories de produits définies par les administrations doua-nières et peuvent, dès lors, correspondre au prix moyen de plusieurs produits. C'est le cas, en particulier, pour les produits manufacturés. Toute variation de la composition d'une catégorie entraînera une variation de la valeur unitaire, indépendamment de tout mouvement réel des prix. A court terme, toute variation aléatoire de la composition dans le contexte d'un marché sous-jacent stable aura pour effet d'accroître le «bruit» de l'indice.
4. On peut cependant penser que, toutes choses étant égales par ailleurs, la variabilité d'un indice, due à cette cause, diminue à mesure que le nombre d'opérations entrant dans le calcul de l'indice s'accroît, et que le problème sera,
dès lors, moins aigu pour les indices établis au niveau communautaire. Toutefois, pour accroître au maximum la qualité des indices, deux principes directeurs sont observés. Le premier veut que l'on utilise les données les plus désagrégées disponibles, à savoir les données harmonisées détaillées qui sont communiquées à Eurostat et qui portent sur les échanges de chaque État membre avec chacun de ses pays partenaires. Le second principe consiste à se rappeler que l'objectif recherché réside en une ventilation entre prix et volume. On n'utilise pas les variations individuel-les des valeurs unitaires qui ne correspondent manifeste-ment pas à des mouvemanifeste-ments de prix réels, et on les remplace par des estimations. Nous reviendrons de manière plus détaillée sur ces questions dans le chapitre consacré à la méthodologie.
5. Les tableaux sont divisés en quatre parties, dont chacune correspond à l'une des nomenclatures des produits utilisées, ce qui donne inévitablement lieu à certains chevauchements mineurs. Il convient de noter que des catégories de produits qui sont désignées par le même intitulé dans des nomencla-tures différentes sont, en fait, définies différemment et auront également des valeurs d'indices légèrement différentes. La première partie concerne les indices afférents à la nomencla-ture CTCI, révision 2, des Nations unies, qui est utilisée largement pour effectuer des analyses comparatives des échanges. On y trouvera des Indices relatifs au commerce total et aux principales subdivisions, telles que les biens manufacturés et les carburants. Des Indices afférents aux sections (codes à un chiffre) et aux divisions (codes à deux chiffres) de la CTCI sont également présentés.
6. La seconde partie présente des indices ordonnés selon les grandes catégories économiques des Nations unies. Leurs intitulés sont reproduits dans la liste des tableaux et font l'objet d'une description détaillée dans les documents statistiques des Nations unies, série M, n° 53, Rév. 1. Les définitions des biens de consommation, des biens d'investis-sement et des biens intermédiaires sont celles proposées par les Nations unies, sauf en ce qui concerne les véhicules de tourisme, qui sont classés dans la première de ces trois catégories et ne constituent donc pas une catégorie à part.
7. La troisième partie présente les indices établis selon la nomenclature NACE-CLIO R 44 des activités économiques, établie par Eurostat. C'est cette nomenclature qui est utilisée dans les publications d'Eurostat en matière de comptes nationaux, de tableaux entrées-sorties et de statistiques de l'industrie. Il va de soi que les activités afférentes au secteur tertiaire ne peuvent être prises en compte ¡ci, car leurs opérations extérieures ne sont pas recensées par l'adminis-tration douanière.
8. La dernière partie concerne la nomenclature des produits Nimexe de la Communauté. Il s'agit de la nomenclature
utilisée pour établir les principales données sur le commerce, communiquées à Eurostat, et qui contient quelque huit mille positions détaillées. Les indices présentés dans cette partie sont afférents à des chapitres de la Nimexe (codes à deux chiffres) et aux échanges de produits agricoles de base.
9. Le calcul d'indices pour l'ensemble de la Communauté européenne présente l'avantage que les flux recensés recou-vrent un grand nombre d'opérations. C'est la raison pour laquelle nous avons pensé pouvoir procéder à une ventilation plus fine des produits que celle que l'on trouve normalement. Nous avons cependant dû renoncer à établir des tableaux relatifs à certaines catégories de produits, soit parce que le volume des échanges était insuffisant, soit que les produits échangés n'étaient pas homogènes (par exemple, dans le cas des œuvres d'art), soit encore que nous ayons estimé que l'indice nécessitait encore certaines améliorations. Les tendances systématiques à long terme de la qualité d'un petit nombre de groupes de produits, résultant fréquemment d'innovations techniques, ont pour effet de fausser leurs indices de valeur unitaire. Il est malaisé de chiffrer sans ambiguïté ces variations de qualité, et les indices des prix purs souffrent du même problème si aucune correction de qualité n'est possible.
10. Dans certains cas, les indices présentés dans les tableaux sont suivis d'un astérisque indiquant que la couver-ture de l'indice (c'est-à-dire le nombre de données exploitées pour son calcul) est relativement faible (de 25 à 50 % en
valeur). La méthode de mesure de la couverture fait l'objet d'une description dans le chapitre consacré à la méthodo-logie.
11. Chaque tableau présente les indices de valeur, de volume et de valeur unitaire des échanges d'un produit donné entre deux zones de pays partenaires, des échanges intracommunautaires (c'est-à-dire entre États membres) et des échanges extracommunautaires (c'est-à-dire avec des pays tiers). Pour les échanges intracommunautaires, l'indice des importations est calculé sur la base d'un autre corps de données que l'indice correspondant des exportations, bien que l'un et l'autre portent, en principe, sur le même flux. Dans la pratique, de légers écarts apparaîtront entre les chiffres en raison des décalages chronologiques, des modifications de destination des exportations, etc., et, si un seul indicateur des échanges intracommunautaires est requis, celui calculé sur la base des importations est généralement considéré comme étant le plus fiable.
12. Une sélection d'indices apparaît dans deux publications d'Eurostat, à savoir le Bulletin statistique mensuel du commerce extérieur et Y Annuaire statistique du commerce extérieur. Ces indices sont également rendus accessibles aux utilisateurs internes par l'intermédiaire de banques de données et sur bande magnétique. Tout renseignement supplémentaire pourra être obtenu auprès de l'Office statisti-que, dont l'adresse est indiquée en deuxième page de couverture.
Méthodologie et sources
1. Indices à base fixe contre indices en chaîne
1.1. La présente note décrit ies modalités de calcul des nouveaux indices d'Eurostat. Ce sont des indices Fisher en chaîne. En d'autres termes, l'année de base est révisée chaque année. Les indices de 1981 ont 1980 comme année de base; les indices de 1982 ont 1981 comme année de base et ainsi de suite. Chaque indice est exprimé en termes de 1980 comme année de référence (par exemple 1980 = 100) par enchaînement de tous les liens en remontant à 1980. 1.2. Les indices en chaîne (rebasés annuellement) ont un certain nombre de propriétés intéressantes. Premièrement, les poids des indices utilisés pour établir l'indice sont tirés des valeurs récentes et des quantités commercialisées, et sont donc sensibles aux changements structurels du commerce mondial. Pour prendre un exemple concret, supposons que les prix des carburants aient fortement baissé entre le début de la décennie et l'an dernier, mais soient demeurés stables depuis l'an dernier. Une augmenta tion des importations de carburants et une diminution des importations des autres produits par rapport à l'année précédente, qui laisseraient inchangée la valeur totale des importations, seraient enregistrées par un indice en chaîne ne présentant pas de changements en volume et en prix, qui semble intuitivement raisonnable. Un indice de volume de Laspeyres avec une base annuelle fixe au début de la décennie indiquerait une augmentation du volume entre l'année précédente et cette année, et l'indice de la valeur unitaire de Paasche correspondant enregistrerait une chute.
1.3. Un second avantage des indices en chaîne est qu'ils sont plus résistants face à un événement anormal tel qu'une hausse temporaire des prix des produits. Si cela arrive dans l'année de base, cela peut fausser la pondération d'un indice à base fixe jusqu'à ce que la base soit modifiée.
valeur comme indicateurs à moyen et à long terme soit plus controversée, de nombreux auteurs ayant récemment pré senté des publications à ce sujet (') ont marqué une préfé rence en leur faveur.
2. Le choix d'une formule d'indice
2.1. Les États membres utilisent diverses formules d'indice. Quatre pays utilisent une formule de Fisher pour les indices pour le commerce extérieur de valeur unitaire, quatre autres utilisent la formule de Paasche et un celle de Laspeyres. Les utilisateurs au sein de la Commission ont exprimé leur préférence pour des indices de type Fisher. A plus long terme, les indices en chaîne de Laspeyres et de Paasche se séparent. Il ne semble pas y avoir de raison de croire que l'un donne un résultat plus «juste» que l'autre. D'autre part, l'indice en chaîne de Fisher, leur moyenne géométrique, se rapproche de l'indice de TörnqvistTheil. Ce dernier a été conçu comme une approximation d'un indice de Divisia, une construction théorique qui a un certain nombre de défen seurs.
2.2. Les formules d'indices traditionnelles servent à calculer les relations entre l'année y, le mois m et la moyenne de l'année précédente y 1 . Ce sont :
Relations de valeur unitaire de Laspeyres
n u (y, m, i)
Σ
V(y1,i)
i = 1 U ( y - 1 , i)
(1) n
Σ V ( y - 1 , i ) i = 1
1.4. Troisièmement, puisque la nomenclature Nimexe change chaque année en raison de la subdivision et du regroupement des rubriques, on effectue de meilleures comparaisons qualitatives en concentrant les changements d'une année à l'autre. La solution de rechange est de trouver des groupements de produits stables sur plusieurs années et ceuxci sont nécessairement définis pour un large éventail de produits.
1.5. A la Commission, les utilisateurs d'Indices du commerce extérieur s'étaient déclarés particulièrement désireux d'obte nir des indicateurs valables des tendances à court terme. La supériorité des indices en chaîne est généralement reconnue à cet égard, et c'est une des raisons principales pour lesquel les notre choix s'est porté sur ces indices. Bien que leur
Relations de valeur unitaire de Paasche
n
Σ
ν (y, m, i)
i = 1
n
Σ
i = 1ν (y, m, i)
u (y, m, i)
U(y1,i)
(2)
(') Voir, par exemple, Koves, P.: «Index theory and economic reality» (théorie de l'indice et réalité économique), Akademiai Kiado, Budapest 1983 ou Hansen, B., Lucas, E. : «On the accuracy of index numbers» (sur l'exactitude des chiffres de l'indice), Review of Income and Wealth, mars 1984.
n
Σ ν (y, m, i) i=1
Σ
V ( y - 1 , i )
i=1
Relations de volume de Laspeyres
Relations de valeur
Relations de valeur unitaire de Paasche
Relations de volume de Paasche
Relations de valeur
Relations de valeur unitaire de Laspeyres
Relations de Fisher
Moyenne géométrique des relations de
(3)
Laspeyres et de Paasche
(4)
(5)
(6)
ou
ν (y, m, i) = valeur du commerce de l'article i pour le mois m de l'année y
1
12
V ( y 1 , i ) = ^ Σ v ( y 1 , m , i) m=1
u (y, m, i) = valeur unitaire de l'article i pour le mois m de l'année y
U ( y 1 , i) = valeur unitaire moyenne de l'article i pour l'an née y 1 , calculée par la division de la valeur totale par la quantité totale
3. Source de données
3.1. La première source de données sont les statistiques du commerce de la Nimexe fournies à l'Eurostat par les États membres. Pour les groupes de produits suivants, les valeurs unitaires calculées à partir des données du commerce fournissent une indication insatisfaisante de l'évolution des prix :
CTCI 524 Matières radioactives et associés CTCI 667 Pierres, gemmes et perles fines CTCI 792 Appareils de navigation aérienne CTCI 793 Bateaux
CTCI 883 Films, cinéma, impressionnés et développés CTCI 896 Objets d'art et antiquités
CTCI 897 Bijouterie, joaillerie, orfèvrerie.
Dans ce cas, l'indice de valeur unitaire de chacun des groupes est pris à partir d'une autre série de valeurs unitaires. Si un indice de prix convenable devenait disponible à l'avenir, celuici remplacerait le précédent.
3.2. Les données brutes sont classées par pays déclarant, flux (c.àd. exportations ou importations), code de produits Nimexe à 6 chiffres et pays partenaire. L'Eurostat a décidé d'utiliser les données établies à ce niveau de désagrégation.
La plup