International Journal of Innovative Technology and Exploring Engineering (IJITEE) ISSN: 2278-3075, Volume-8 Issue-10, August 2019
Data Mining Based Outlier Cluster Detection
Algorithm
Abstract—Outlier detection has been engaged and considered field as of late. Exception recognition is a significant information mining movement with various applications, including MasterCard misrepresentation location, disclosure of crimes in electronic trade, video reconnaissance, climate forecast, and pharmaceutical re-search. The assignment of anomaly recognition is to distinguish the information objects from heaps of all objects. Outlier mining normally utilized in different fields. The vast majority of the strategies gives more regard for distinguish information objects from worldwide view which is in suitable for multidimensional information sets. According to technology, outlier recognition will be troublesome by utilizing conventional arrangements. In this, we are utilizing two calculations, for example, ODA and LOF. ODA used to locate the mean or exceptions from multi-dimensional informational indexes. LOF used to discover the likelihood of that anomalies utilizing thickness based calculations. Exception location is a significant undertaking in information mining. Nearby anomalies contrasting with their nearby neighborhood rather than worldwide information. Anomaly discovery is an essential assignment in information mining. Nearby exceptions contrasting with their neighborhood close articles rather than worldwide information dissemination. The procedure segmented into two phases, online and disconnected. Small scale groups are made in online stage and last bunches are produced in disconnected stage. Exception location is a significant assignment in information mining. Nearby exceptions contrasting with their neighborhood rather than worldwide information. Relative thickness of an item against its neighbors as the marker of the level of the article being anomaly which is allotted to nearby exception factor.
Index Terms—Data Set, Outlier Detection, Data Mining
I. INTRODUCTION
Information Mining is broadly examined field of research region, where the majority of the work is featured over learning. Extraction of fascinating helpful examples or information from gigantic measure of information where by and large work is featured over learning. Nonetheless, there are a great deal of issues exists in gigantic database, for example, information excess, missing information and invalid information and so on. In dispersion based techniques, the perceptions that veer off from standard circulation as outliers. The separation based algorithms are broadly utilized for its rearrangements. Separation based calculations can distinguish worldwide exceptions and neglect to recognize nearby outliers. Many thickness based calculations are proposed, for example, LOF and INS.Cluster based calculations are utilized to identifyOutlier clusters.
Revised Manuscript Received on August 05, 2019.
Ms. Sayali S. Rane1, Student, Department of Computer Engineering,
Sandip Institute of Technology and Research Centre, Maharashtra, India Prof .Mangesh M. Ghonge, Professor, Department of Computer Engineering, Sandip Institute of Technology and Research Centre, Maharashtra, India
Dr. Amol Potgantwar, HOD,Department of Computer Engineering, Snadip Instituteof Technology and Research Centre, Maharashtra, India
Data mining action with various applications including charge card misrepresentation identification, disclosure of lawbreaker exercises in electronic business, video observation, climate forecast and pharmaceutical research. Outlier location is the hugest part in the information mining. At the point when the informational indexes are tremendous, it will be precarious to achieve the worldwide anomaly mining. The undertaking of exception identification is to recognize the information objects from bunches of all objects. Outlier mining generally utilized in the field of charge card fraud, network power investigation and interruption location etc. Most of the techniques gives more thoughtfulness regarding distinguish information objects from worldwide view which is in fitting for multidimensional information sets. According to technology, outlier discovery will be troublesome by utilizing customary solutions. In this, we are utilizing two calculations, for example, ODA and LOF. ODA used to locate the mean or exceptions from multi-dimensional informational indexes. LOF used to discover the likelihood of that anomalies utilizing thickness based calculations In this framework we are centers around thickness based bunching calculations utilizing miniaturized scale groups. The procedure is segmented into two stages, on the web and disconnected, smaller scale bunches are made in online stage and last groups are delivered in disconnected phase. A Micro-bunch is a lot of individual information point that are near each other. A miniaturized scale group mc (cwt.) is an outlined portrayal of a gathering of information x1, x2, x3, xn which are so near one another that they are probably going to have a place with same cluster. Each small scale bunch is spoken to by a tuple(c,w,t).Outlier identification is an essential errand in information mining. Neighborhood anomalies contrasting with their nearby close articles rather than worldwide information dispersion. The level of the item being exception which is allotted to nearby anomaly factor (LOF).
A. Motivation:
• There is a deficiency of local outlier mining methods for multidimensional amount of datasets.
• Data reduction is hard due to irrelevant objects in multi- dimensional datasets.
II. LITERATURE SURVEY
The researcher has [1] proposed the attribute relevance separation based local outlier detection scheme calledLOMA.
It is used to mining local outliers by building spars In this research [2] a novel outlier cluster detectionAlgorithm (ROCF) without top-n parameter. ROCF can detect the outlier cluster that are hard to detect out by other distance based or density based
outlier detection algorithms. The proposed algorithm can
detect the outlier and outlier cluster without parameter to specify the number of outliers or percentage of out liersina database.
In this research the experimenter has [3] analyzed the clustering and outlier performance of BIRCH withCLARANS and BIRCH with K-Means clustering algorithm for detecting outliers. By using DSH clustering
and partition clustering
whichareassistivetodetecttheoutliersefficiently.
The researcher [4] introduce the notion of the local outlierfactor LOF, which captures exactly this relative degree ofisolation. It demonstrate that out heuristic appears to be verypromising in that it can identify meaningful local outliers andshows that the approach of finding local outliers is efficientfor datasets where the nearest neighbor queries are supportedby index structures and still practical for very large datasets.
In this research the experimenter has [7] Presents the noveldata stream outlier detection algorithm SODRNN. It is carriedout on both artificial and real data sets show that the proposedmethod is efficient and effective. It is improve the performanceof this algorithm in high-dimensional data stream environment.In this research [12] a new algorithm named DBCOD thatunifies density-based clustering and outlier detection.DBCODneeds just an input parameter Validates the algorithm withextensive experimental evaluation on different shape, largescale and high-dimensional databases.
The researcher [8] generalize local outlier factor of object and propose a framework of clustering based outlier detec- tion.The theoretical analysis and the experimental results show that FCBOD has better performance than clustering based outlier detection methods.
In this research experimenter [9] proposed a hierarchical clustering based global outlier detection method. It isolates degree of the data sets by the hierarchical clustering tree and the distance matrix, and the determine the number of outliers to delete. The algorithm is applicable to multi-level data and large data sets.
III. SYSTEM ARCHITECTURE
A.
Problem Statement
For a wide variety of multi-dimensional data set, an object may not be detected as an outlier from perspective view. Discovering outliers in multi-dimensional data set is most challenging due to irrelevant objects in the data set. In real world problems, multi-dimensional data are very noisy. The hardness of this problem motivates to investigate the subspace method
B.
System Overview
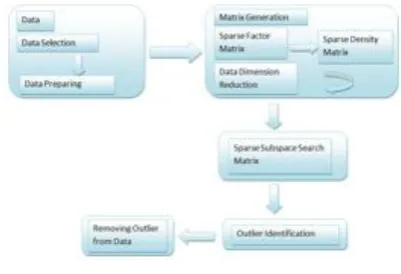
The main goal of proposed system is to find local outliers from the multi-dimensional data set. Multi-dimensional data sets are nothing but wine data sets, heart disease data sets, UCI data set etc.ODA algorithm is used to find the local outliers from the multi-dimensional data sets as well as it is used to find out the mean of that outliers. Outlier detection is an important task in data mining. Local outliers comparing to their local neighborhoods instead of global data distribution. In density based outlier detection the density around an outlier mainly different from the
[image:2.595.325.526.106.243.2]density around its neighbors. So, relative density of an object against its near region as the pointer of the degree of the object being outlier which is assigned to Local Outlier Factor(LOF).
Fig 1: Architecture of System
Proposed research focuses on minimal based bunching calculations utilizing miniaturized scale groups. The procedure is segmented into two stages, on the web and disconnected, small scale bunches are made in online stage and last groups are produced in disconnected stage. A Micro-Cluster is a lot of individual information indicates that are close one another and will be treated as a solitary unit in further disconnected Macro-grouping. A smaller scale bunch mc(c,w,t) is an outlined portrayal of a gathering of information x1, x2, x3,..., xn which are so near one another that they are probably going to have a place with same group. Each small scale group is spoken to by a tuple(c,w,t).ODA calculation is utilized to discover mean of that neighborhood exceptions. The separation N between information point x and centroid of each small scale bunch mci [c] is determined by utilizing Euclidean distance. Then determined separation N is contrast and range and choice is made about information point x, that new smaller scale group is made with information point x as centroid or update existing miniaturized scale groupexercises in electronic trade, video reconnaissance, climate forecast and pharmaceutical research. Outlier location is the most noteworthy part in the information mining. At the point when the informational collections are immense, it will be precarious to achieve the worldwide anomaly mining. The undertaking of exception recognition is to distinguish the information objects from bunches of all objects. Outlier mining typically utilized in the field of MasterCard fraud,netwok strength examination and interruption location etc Most of the strategies gives more regard for recognize information objects from worldwide view which is in suitable for multidimensional information sets. According to technology, outlier identification will be troublesome by utilizing conventional solutions. In this, we are utilizing two calculations, for example, ODA and LOF. ODA used to locate the mean or exceptions from multi-dimensional informational collections. LOF used to discover the likelihood of that exceptions utilizing thickness based calculations In this framework we are centers around thickness based grouping calculations utilizing small scale bunches. The procedure is segmented into two stages, on the web and disconnected,
Data Mining Based Outlier Cluster Detection Algorithm
{ }
{ }
{ }
{ }
{ }
{ }
{} →
→
→ → → last groups are created in disconnected phase. A
Micro-group is a lot of individual information point that are near each other. A smaller scale bunch mc(c,w,t) is a condensed portrayal of a gathering of information x1, x2, x3,..., xn which are so near one another that they are probably going to have a place with same cluster. Each miniaturized scale bunch is spoken to by a tuple(c,w,t).Outlier recognition is an essential errand in information mining. Nearby exceptions contrasting with their neighborhood close articles rather than worldwide information dispersion. The level of the article being exception which is allotted to neighborhood anomaly factor (LOF).
IV. METHODOLOGY
A. Data Flow
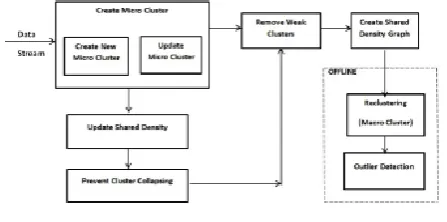
In this section, the solving approaches and efficiency issue are described. It describes the block diagram of system and steps of process. Following diagram shows the component of proposed framework.As shown figure there are various components involves in proposed framework. Proposed
work focuses on density
[image:3.595.54.278.326.437.2]basedclusteringalgorithmsusingmicroclusters. Theprocess
Fig 2: Workflow of System
is sectioned into two phases, online and offline, micro clusters are establish in online phase and final clusters are generated inofflinephase.
•Creation of Micro groups:
A Micro-Cluster is a lot of individual information indicates that are close one another and will be treated as a solitary unit in further disconnected Macro-bunching. A smaller scale bunch mc(c,w,t) is a condensed portrayal of a gathering of information x1, x2, x3,..., xn which are so near one another that they are probably going to have a place with same cluster. Each miniaturized scale group is spoken to by a tuple(c,w,t).
•New Micro group Creation:
New information point x is added to existing miniaturized scale bunch or another small scale group is produced .For this information point x decide every single smaller scale bunch for which x can be included their range r.The separation N between information point x and centroid of each miniaturized scale bunch mci [c] is determined by utilizing Euclidean separation .Then determined separation N is contrast and span and choice is made about information point x, that new miniaturized scale group is made with information point x as centroid or update existing small scale group.
•Updating Micro bunches:
Subsequent to figuring separation in the event that — N—¡ r then that information point x is incorporated to existing microcluster.Here weight of smaller scale group is likewise
modified. Weight of miniaturized scale bunch is only the whole number of information focuses exists in that smaller scale cluster. After including new information point x, focal point of small scale bunch additionally be updated. Update weight of each Micro cluster. Weight and focal point of miniaturized scale group are refreshed by utilizing condition mci [w] mci [w]2 ((tmci [t]) +1 where mci [w] is weight and mci [t] is refreshed time of smaller scale group I
Outlier Detection:
Anomaly location is an earth shattering quality assignment in information mining. Nearby exceptions resemblance to there neighborhood close district rather of worldwide information distribution. In thickness based anomaly identification the thickness around an exception significantly not quite the same as the thickness around its neighbors.so relative smaller of a locale against its close item as the marker of the level of the article being exception which is appointed to Local Outlier Factor(LOF).
B. Algorithm
LOF (Local outlier factor) of an object o is the mean of the ratio of local reachability of o and those of os k-nearest neighbors. The lower the local reachability density of o, and the high the local reachability density of the kNN of o, the higherLOF
Step 1: Calculate all the distances between each two data points.
Step 2: Calculate all the distances between each two data points.
Step 3: Calculate all the Nk(o). Step 4: Calculate all the lrdk(o).
Step 5: Calculate all the LOFk(o). Step 6: Sort all the LOFk(o).
LOF (Local outlier factor) of an object o is the mean of the ratio of local understandability of o and those of osknn. The lower the local reachability density of o, and the higher the local reachability density of the kNN of o, the higher LOF. This captures a local outlier whose local density is relatively low comparing to the local densities of its Knn.
V. PROBLEMFORMULATION
A. MathematicalModel
Let S be the proposed system which is defined as S= I, M C, W, Sh, F, O
Where, I = i1, i2, ...inwhich is set of all points.
MC = mc1, mc2, ...mckwhich is set of micro clusters. Mc
=(c,w,t)
C is the center of Micro Cluster. W is the set of weight of Micro Cluster. T is the last time of Micro Cluster Updated.
Sh = Sh1,Sh2,...Shl is set of shared density graph
betweentwomicroclusteriAndj.
O = O1, O2, ...O10 is the set of Output generated. F =
F1, F2, ...F8 is the set offunctions.
F1 = It is the function for creating micro cluster initially MC =
f1(i1) O1
F2 = It is the function for creating new micro cluster.
f2(i1) O2
f3(i1) = It is the function for Updating existing
Micro-Cluster.
f3(O2) O3= Update Center of
→ →
→
→
Update Weight of Micro-Clusterf3(O2) O5 = UpdateTime
F4 = It is the Gaussian Neighborhood function which calculatedistancebetweentwomicro-clusteriandj.
f4(O2) O6
F5 = It is the function for determining shared density of graph.
f5(O2) O7
F6 = It is the function for preventing collapse of micro
clusters by calculating distance between two micro cluster.
f6(O7) O8
F7 = It is the function to Calculate weak micro-cluster.
f7(O8) O9
F8 = It is the function used for reclustering and generate final macro cluster.
f8(O9) → O10
B. SystemImplementation
Proposed system will use Windows / Ubuntu platform. Hardware and Software requirement for proposed framework is as follows:
Processor : Pentium- IV Ram : 2 GB Hard disk : 180 GB
Language for GUI Development : JAVA, Python IDE used : Eclipse
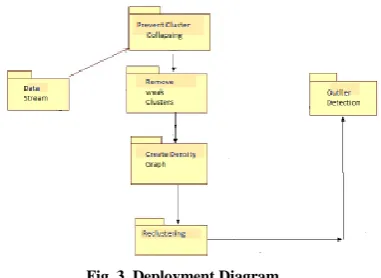
C. DeploymentDiagram
A deployment diagram in the Unified Modeling Language models the physical organization of curios on nodes.To depict a site, for instance, an arrangement outline would exhibit what equipment segments (hubs) exist what programming segments keeprunning on every hub and how the different pieces are associated (for example JDBC, REST, RMI).
[image:4.595.339.514.247.295.2]The nodes visual as boxes, and the antiquities allocate to every hub show up as square shapes inside the crates. Hubs may have sub nodes, which show up as settled boxes. A solitary hub in an organization graph may recognition speak to multi fold physical hubs, for example, a group of database servers. There are two sorts of Nodes: I. Gadget Node. ii. Execution Environment Node Device hubs are with handling memory and administrations to run programming, for example, ordinary PCs or cell phones. An EEN is a product processing asset that keeps running inside an external hub and which itself gives an administration to have and execute other executable programming components.
Fig. 3. Deployment Diagram
A. Data FlowDiagram
A data flow diagram (DFD) is a graphical appearance a data framework, displaying its procedure angles in stream. Frequently they are a starter step used to generate an outline
of the framework which can later be expounded. DFDs can likewise be utilized for the handling of information preparing (organized structure). A DFD demonstrates which is info and yield of specific framework, where the information will go back and forth, and where the information will be put away. It doesn't demonstrate data about the planning of procedures, or data about whether procedures will work in grouping or in parallel
DFD 0 : An information stream outline is graphical portrayal of stream of information through a data framework where demonstrating its procedure viewpoints. Regularly they are a preliminary step used to make outline of the framework. DFDs can likewise client for the perception of information handling. It indicates what sort of data will be contribution to and yield from framework.
Fig. 4. Data Flow Diagram level 0
• DFD 1 :DFD level 1 diagram is the extra data about the Significant elements of the framework. The Level 1 DFD
Shows how the framework into a subsystems or Procedures way, that every arrangement with at least one
[image:4.595.347.505.421.509.2]of the information owes to or from an outer operator, and Which together give the framework in general.
Fig. 5. Data Flow Diagram level 1
DFD 2 : This is the second level of the DFD. In this level the input to the system is given and the input is in the form of metadata. This input is given to the process which then uses the aggregation techniques to aggregate data and expressed in summary form. Then the output is given in the form of the user behavior data analysis
Fig. 6. Data Flow Diagram level 2
[image:4.595.77.268.595.734.2]Data Mining Based Outlier Cluster Detection Algorithm
DISCUSSION
The analysis is done on initial 10000 information purposes of KDD CUP-99 dataset and results are determined and com-pare with resultsCreated by other algorithms (D Stream and CluStream) by taking same Information focuses on MOA apparatus. Same system is completed forSensor dataset with 100000 information focuses and results are Produced. Structure table it demonstrates that immaculateness of bunchGotten by proposed calculation is most astounding among others Strategy, which result in better exception location.
Above figure shows performance comparison between ODA and LOF algorithm. ODA algorithm used to find the mean or outliers from multi-dimensional datasets. LOF algorithm used
to find the probability of that outliers using density based algorithms. Local outliers comparing to their local neighbor- hood instead of global data. Local outliers comparing to their local near objects instead of global data diffusion. According to above figure, ODA algorithm takes 63 Ms runtime from wine multidimanesional dataset with 32.96 outlier accuracy and LOF algorithm takes 485 Ms runtime from same dataset with 76.46 local outlier accuracy.
VII.CONCLUSION
In this Study, the proposed calculation can identify anomaly group from the multi-dimensional informational collections. The proposed ODA calculation can precisely distinguish exceptions and anomaly bunches from the Multi-dimensional datasets without top-n parameter, and LOF
calculation can make sense of the estimation of the anomaly pace of the multi-dimensional datasets. The calculation mean to apply to tackle certifiable issues
ACKNOWLEGMENT
I would sincerely like to thank our Head of Department Prof. (Dr.) AmolPotgantwar, Computer Engineering, and Professor Mangesh M. Ghonge, Department of Computer Engineering, SITRC, Nashik for his guidance, encouragement and the interest shown in this project by timely suggestions in this work. His expert suggestions and scholarly feedback had greatly enhanced the effectiveness of this work.
REFERENCES
1. XujunZhao,JifuZhang,Xiao Qin : Expert System with Applications -LOMA , A local outlier mining algorithm based on attribute relevanceanalysis, 272-280,2017.
2. Jinlong Huang, QingshengZhu,Lijun Yang, DongDongCheng,Quanwang Wu : Knowledge-Based Systems,1-9,2017.
3. Dr. S.Vijayarani,Ms. P Jothi : An Efficient Clustering Algorithm forOutlier Detection in Data Streams. International Journal of AdvancedResearch in Computer and Communication Engineering, Vol. 2, Issue9,3657-3665,September 2013.
4. Markus M. Breunig, Hans-peter Kriegel, Raymond T. Ng,Jorg Sander: LOF : Identifying Density-Based Local Outliers.International Confer-ence on Management of Data, 2000. 5. Bryan Perozzi,LemanAkoglu, Patricia Iglesias
Sanchez,EmmanuelMuller : Focused Clustering and Outlier Detection in Large AttributedGraphs,2000.
6. VilleHautamaki, IsmoKarkkainen and PasiFranti : Outlier DetectionUsing K-Nearest Neighbour Graph,2000.
7. ZhongPing Zhang, YongXinLiang : A Data Streams Outlier DetectionAlgorithm Based on reverse K nearest Neighbours,2011. 8. Sheng-Yi Jiang, Ai-Min Yang : Framework of Clustering-Based
OutlierDetection, International Conference on Fuzzy Systems and KnowledgeDiscovery,475-479,2009.
9. Bin-meiLIANG : A Hierarchical Clustering Based Global OutlierDetection Method.
10. Harshada C. Mandhare : A Comparative study of Cluster Based OutlierDetection, Distance Based Outlier Detection and Density Based OutlierDetectionTechniques, International Conference on Intelligent Computingand Control Systems,931-935,2017.
11. RajendraPamula, Jatindra Kumar Deka, SukumarNandi : An OutlierDetection Method based on Clustering, International Conference onEmerging Applications of Information Technology,2011.
12. Yunxin Tao, DechangPi : Unifying Density-Based Clustering andOutlier Detection, International Workshop on Knowledge Discovery andData Mining,644-647.
13. Peng Yang, Biao Huang : An Outlier Detection Algorithm Based onSpectral Clustering, IEEE Pacific-Asia Workshop on ComputationalIntelligence and Industrial Application,507-510,2008. 14. YueZhang,JieLiu,Bo Song, A New Algorithm for outlier
DetectionBased on Offset, International Conference on Information Assuranceand Security,3-6,2009.
15. Huang tao, Tan yanna: Research Outlier Detection Technique Baseon Clustering Algorithm, International Conference on Control andAutomation,12-14,2014.
16. K. Thangavel, A. KajaMohideen,Semi Supervised K-means Clusteringfor Outlier Detection in Mammogram Classification,68-72. 17. Simon Hawkins, Hongxing He, Graham Williams and Rohan
Bax-ter,Outlier Detection Using Replicator Neural Networks.
19. Zhou Mingqiang, Huang Hui, Wang Qian,A Graph-based ClusteringAlgorithm for Anomaly Intrusion Detection,International Conference onComputer Science Education,1311-1314,2012. 20. Hongyi Zhang, Qingtao Wu and JiexinPu,A Novel Fuzzy
KernelClusteringAlgorithm for Outlier Detection, International Conference on Mechatronics and A utomation,2378-2382,2007.
AUTHORS PROFILE
Dr.Mangesh M Ghonge is currently working as Assistant Professor at Sandip Institute of Technology and Research Centre, Nashik (MS), India. He received his BE,MTech degree in Computer Science & Engineering from SGBAU, Amravatiand RTMNU, Nagpur respectively. Recently, he completed his from SGBAU, Amravati on topic “Assignment based Selfish Node detection System in Mobile Ad hoc Networks”. His more than 30 research paper published in various International journals including Scopus indexed journal. His research interest includes security in wireless networks, Ad-Hoc networks, and network protocols.
Ms. Sayali S. Rane is Currently persuing M.E. in
Computer Engineering at the Sandip Institute of Technology and Research
Centre,Nashik,Maharashtra,India.She received her B.E. degree in Computer Science and Engineering from the University of Pune,Maharashtra,India. Her more than 5 research paper published in various international Journals. Her Intrested area is Data Mining..