Journal of Chemical and Pharmaceutical Research, 2015, 7(4):1597-1603
Research Article
CODEN(USA) : JCPRC5
ISSN : 0975-7384
Validation of a HPLC method for the quantification of flavonoids in Mexican
Lime (Citrus Aurantifolia) during the Progression of Witches’ Broom Disease
Saeed Mollayi
1, Faezeh Ghanati
2*and Alireza Ghassempour
1*1
Medicinal Plant and Drugs Research Institute, Shahid Beheshti University, G. C. Evin, Tehran, Iran
2
Department of Plant Biology, Faculty of Biological Science, TarbiatModares University (TMU), Tehran, Iran
_____________________________________________________________________________________________
ABSTRACT
In this article, a fast, simple, accurate and selective HPLC method was validated for the qualitative and quantitative analysis of the main flavonoids (rutin, hesperidin, catechin, epicatechin, naringenin, quercetin, and kaempferol) in Mexican lime and was appliedto monitor the variation of them during progression of witches’ broom disease of lime (WBDL).The separation of flavonoids was achieved on a C18 column (25 mm×4.6 mm I.D., 5 µm), with a gradient elution composed of two solvents,at a flow rate of 0.7 mL/min and280 nm as wavelength. The method was evaluated with respect to ICH guidelines and then the flavonoids were quantified.The validated method was selective, so that flavonoids were well separated from each other with good resolution. This method showed an excellent linearity
(r2> 0.99), high accuracy (recovery), with other validation data, including precision, specificity, limit of detection
(LOD), limit of quantitation (LOQ), and robustness. The analysis of flavonoids during progression of WBDL showed that after 30 days of inoculation, levels of flavonoids were considerably increased, but significantly decreased after
120 days. These changes in the levels of metabolites are in good agreement with the activity of phenyl alanine
ammonia-lyase (PAL). According to the results, the validated method highly is valuable for quantification analysis
of flavonoids during the progression of WBDL and can be effective for diagnosis of healthy plant from infected
plant.
Keywords: Flavonoids; Mexican lime; Validated method, WBDL
_____________________________________________________________________________________________
INTRODUCTION
The devastating effect of CandidatusPhytoplasmaaurantifolia, the causal agent of witches’ broom disease of lime (WBDL), resulted in economic loss of some Mexican lime producing countries such as the United Arab Emirates,
Oman and Iran [1, 2]. Phytoplasma-infected plants could be diagnosed by some methods such as polymerase chain reaction (PCR), polyclonal antibodies as well as symptom expression [3, 4]. In addition, proteomics pattern of
infected lime by Ca.Phytoplasmaaurantifoliawas reported [5].
Today, metabolite profiling is a practical tool in the systems biology analyses to better understand the biological systems [6]. However, its application for monitoring the regulation of the global plant metabolism in response to biotic stresses is still in its infancy, receiving increasing attention [7]. The metabolism of plant cells greatly changes under biotic and abiotic stressesleading plant to an optimized metabolic response to defense [8-10].The monitoring of soybean’s (Glycine max L.) global metabolism regulation in response to Rhizoctonia solani infection in a time-course was done by Aliferis et al. The study revealed that infection results in the mobilization of carbohydrates, disturbance of the amino acid, and activation of phenylpropanoid biosynthetic pathways of the plant [11].Mikulic-Petkovseket al. reported that the husk catechincontent of infected green walnut fruits by Xanthomonasarboricolapv.
Juglandis increased up to 23 fold more than it is in healthy plants[12].A metabolite profiling suggest for
Flavonoids are a large subgroup of secondary metabolites categorized as phenolic compounds and possess antioxidant, antimicrobial and anticancer properties [13]. Flavonoids are frequently induced by abiotic stress and promote roles in plant protection [14, 15]. These compounds accumulated in plant tissue could help to protect themselves from the damaging effects by acting as a free radical scavenger because the hydroxyl groups present in their structure [15].Furthermore, there are numerous reports of different plants synthesizing avariety of pathogenesis-related (PR) proteins in response to abiotic and biotic stresses [16]. One of the PR proteins includes phenylalanine ammonia lyase (PAL). Stressed plants increase the production of PALwhich is involved in the production of phytoalexins. PAL activityis considered as excellent markers of plant disease resistance against pathogens [17, 18].
According to the best our knowledge, there was no report on metabolite profiling of Mexican lime during progression of WBDL. So, the aim of the study was validation of an HPLC method for determination and quantification of the major flavonoids including rutin, hesperidin, catechin, epicatechin, naringenin, quercetin and kaempferol in Mexican lime during progression of WBDLIn order to discover bioactive flavonoid against Ca.
Phytoplasmaaurantifolia in order to determination of healthy plant from infected plant.
EXPERIMENTAL SECTION
Plant Material and Inoculation
Twenty healthy 1-year-old Mexican lime trees grown in the greenhouse were arranged on the greenhouse bench. Specimens ofMexican lime trees infected toWBDL were grafted to half of them randomly and were covered for 30 days with plastic bags to increase their humidity. All trees were kept under natural light conditions at a temperature of 25-28°C. Diagnoses of WBDL in the trees were based on polymerase chain reaction (PCR) using P1/ WB3 primers [19].The experiment was conducted using a randomized complete block design (RCBD). Randomly, leaves of five infected trees, as a treatment and five healthy trees, as a control were sampled every 1 month and used for further analysis.
Extraction of flavonoids from Leaves
The leaves of healthy and infected lime were dried and powdered. Total phenols of each plant (0.4g) were extracted by ethanol, under continuous stirring at 300 × g, during 2 hours. The extracts were filtrated and diluted with water (1:1 v/v). Less polar compounds were discarded using chloroform. Afterwards, flavonoids were extracted with ethyl acetate and then injected to HPLC [20].
Chemical Materials
The standard chemicals were purchased from Merck (Darmstadt, Germany). HPLC grade solvents were also obtained from Merck. MilliQ-water was prepared by a MilliQ-System (Mil-lipore, Saint-Quentin-en-Yvelines, France).
Instrumentation and chromatographic condition
The analyses were carried out using an HPLC system (Kenauer, Germany) with K-1001 pump (Knauer, Germany), K-2008 PDA detector (Kenauer, Germany), a manual injection valve (Rheodyne, USA) with a 20 µL loop, and degasser. A gradient elution was performed on a C18 Eurospher column (250×4.6 mm, 5 µm). The mobile phase
consisted of two different solutions, including solvent A, acetonitrile: methanol (80: 20 v/v %), solvent B, orthophosphoric acid (0.2 mM), and solvent C, acetonitrile.Separations were affected by a gradient elution program as follows:The initial mobile phase composition was 15% A, followed by a linear gradient to 20% A in 5 min; 5–25 min, from 20 to 25 % A; 25–30 min, from 25 to 30 % A; 30–50 min, from 30 to 70 % A. The post-running time was 5 min.
Method validation
The HPLC-method for analysis of flavonoids was validated through its specificity/selectivity, linearity, recovery, precision and the limits of detection (LOD) and quantification (LOQ) [21].
The linearity of the method was evaluated using seven calibration curves obtained withstandard solutions at five different concentrations of each standard. Limits of detection (LODs) and quantification (LOQs) were determined based on the standard deviation of the response and the slope, using the calibration curve data.
The precision of the intra- and inter-day was evaluated by the repeated injection. To assess the intra-day precision of the method, the sample was injected six times within a day. The inter-day precision was determined by six injections for 3days. The precision was expressed as the relative standard deviation (RSD, %).
Robustness of the method were demonstrated by changing the ratio of solvent A from 80:20 to 75:25 and the changing flow rate from 0.7 to 0.8 ml/min.
The specificity of the method was obtained by injecting theblank sample and the spiked sample. The specificity was to determine that the endogenous co-eluting components did not interferewith other constituents in the sample extract. No interfering peaksfor the determination of flavonoids were observed.
Assay of phenylalanine ammonia-lyase (PAL)
One gram of each plant was homogenized in 5ml of phosphate buffer (pH 7.2) at 4oC and was centrifuged at 10,000 × g for 15 min at 4oC. The supernatant was diluted 5 times and subsequently used as the enzyme source.0.1 ml of enzyme solution was incubated with 2 ml of 3 mM L-phenylalanine solution and 0.9 ml of water. Then, absorbance was measured at 270nm. This reaction was as a test sample. Blank was prepared with the same composition. The only difference between them was using 0.1 ml 150 mMTris-HCl buffer, pH 8.5 instead of enzyme solution [22].
Statistical Analysis
The experiment was carried out using a randomized complete block design (RCBD) considering five replications for each sample. The data were statistically analyzed by Statistical Analysis System (SAS) software and are mean ± SD (vertical bars) of five replications.The significance of differences between treatments was evaluated at level of
p≤0.05.
RESULTS AND DISCUSSION
Optimization of the HPLC method
In this article, we developed the HPLC conditions in order to specify simultaneously flavonoids including rutin, hesperidine, naringenin, catechin, epicatechin, quarcetin and kaempferol in Mexican lime during progression of WBDL. To get the best resolution, we tried different lengthes and stationary phases (C18 and C8), different gradient solvent systems such as acetonitrile-phosphate buffer, methanol-water, acetonitrile-water, different flow rate (0.2-1 mL/min) and temperature of HPLC columns and the best result was achieved on C18 column (250 × 4.6 mm i.d., 5
µm particle size) by a gradient mobile phase of acetonitrile:methanol (8:2 v/v %), and water (0.1 % acetic acid) at 0.7 mL/min at room temperature (Figure 1).Also, based on UV max of the flavonoids, the wavelength was adjusted on 280 nm. In HPLC chromatogram (Figure 1), peaks of flavonoids were observed at the retention times between 10-40 min. The flavonoids were confirmed by comparison of retention time and testing spike process.
Method validation
Figure 1: HPLC chromatogram of a) mix of standards, and b) ethyl acetate extract of Mexican lime; catechin (1), epicatechin (2), rutin (3), hesperidine (4), quercetin (5), naringenin (6), and kaempferol (7)
Table 1. Linearity, LOD and LOQ parameters of flavonoids analysis in Mexican lime
Compound Calibration curve Correlation Linear range (µg/mL) LOD (µg/mL) LOQ (µg/mL) Catechin Y=11749X-34169 0.999 2-30 0.2 0.6 Epicatechin Y=12104X+1352 0.997 1-100 0.15 0.45 Rutin Y=3711X+1434 0.998 2-30 0.5 1.5 Hesperidin Y=5137X-2512 0.997 4-100 0.4 1.2 Quercetin Y=5639X-1002 0.998 2-50 0.6 1.81 Naringenin Y=8884X+1352 0.999 1-50 0.17 0.51 Kaempferol Y=9134X-7345 0.998 1-60 0.18 0.56
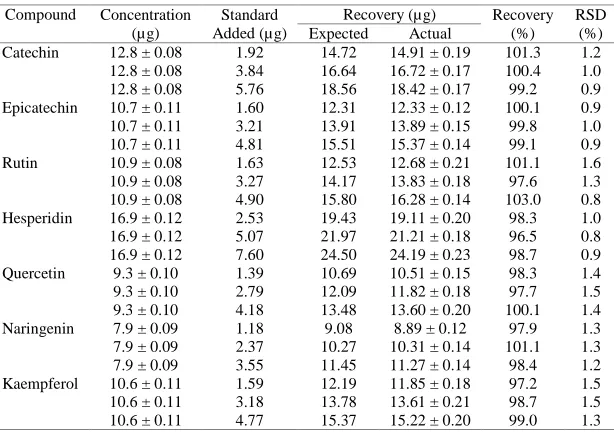
By using recovery test we appraised the accuracy of the method. After the addition of accurate amount of each standard at three levels (15, 30 and 45%) to the extract of leaves of healthy plant we analyzed it by the proposed HPLC method.The recoveries were calculated according to equation 1 and are reported in Table 2.The recoveries obtained were close to 100% in almost all cases. Considering the results of the recovery test, this method can be considered accurate.
[image:4.595.124.488.577.653.2]Table 2.Recovery study of flavonoidsin Mexican lime
Compound Concentration (µg)
Standard Added (µg)
Recovery (µg) Recovery (%)
RSD (%) Expected Actual
Catechin 12.8 ± 0.08 1.92 14.72 14.91 ± 0.19 101.3 1.2 12.8 ± 0.08 3.84 16.64 16.72 ± 0.17 100.4 1.0 12.8 ± 0.08 5.76 18.56 18.42 ± 0.17 99.2 0.9 Epicatechin 10.7 ± 0.11 1.60 12.31 12.33 ± 0.12 100.1 0.9 10.7 ± 0.11 3.21 13.91 13.89 ± 0.15 99.8 1.0 10.7 ± 0.11 4.81 15.51 15.37 ± 0.14 99.1 0.9 Rutin 10.9 ± 0.08 1.63 12.53 12.68 ± 0.21 101.1 1.6 10.9 ± 0.08 3.27 14.17 13.83 ± 0.18 97.6 1.3 10.9 ± 0.08 4.90 15.80 16.28 ± 0.14 103.0 0.8 Hesperidin 16.9 ± 0.12 2.53 19.43 19.11 ± 0.20 98.3 1.0 16.9 ± 0.12 5.07 21.97 21.21 ± 0.18 96.5 0.8 16.9 ± 0.12 7.60 24.50 24.19 ± 0.23 98.7 0.9 Quercetin 9.3 ± 0.10 1.39 10.69 10.51 ± 0.15 98.3 1.4 9.3 ± 0.10 2.79 12.09 11.82 ± 0.18 97.7 1.5 9.3 ± 0.10 4.18 13.48 13.60 ± 0.20 100.1 1.4 Naringenin 7.9 ± 0.09 1.18 9.08 8.89 ± 0.12 97.9 1.3 7.9 ± 0.09 2.37 10.27 10.31 ± 0.14 101.1 1.3 7.9 ± 0.09 3.55 11.45 11.27 ± 0.14 98.4 1.2 Kaempferol 10.6 ± 0.11 1.59 12.19 11.85 ± 0.18 97.2 1.5 10.6 ± 0.11 3.18 13.78 13.61 ± 0.21 98.7 1.5 10.6 ± 0.11 4.77 15.37 15.22 ± 0.20 99.0 1.3
[image:5.595.136.478.380.426.2]To evaluate the precision of the method we repeated it by assaying 6 replicate injections of standards at the same concentration, during the same day and six continuous days. The intra-day precision was <1.5%, and inter-day precision was <1.8% for all flavonoid standards (Table 3). Since the results were within the acceptable range confirm the accuracy and precision of the method.
Table 3.Intra- and inter-day precision of HPLC assay of flavonoidsin Mexican lime
C EC R H Q N K
Intra-day RSD (%) <0.6 <1.0 <0.7 <0.7 <1.0 <1.1 <1.0 Inter-day RSD (%) <1.2 <1.4 <1.5 <0.8 <1.2 <1.5 <1.5 C: Catechin; EC: Epicatechin;R: Rutin; H: Hesperidin; Q: Quercetin; N: Naringenin; K: Kaempferol
Robustness was evaluated to ensure that the HPLC method is insensitive to small changes in the experimental conditions. In order to assess the robustness of the method, we modified several parameters, such as flow rate, and ratio of solvent A, and no significant changes were observed in the resolution or response of the standard peaks.
The validation data indicated good linearity, sensitivity, accuracy, precision, specificity, and robustness of this method to be suitable for the analysis of flavonoids in Mexican lime.
Table 4.the amount of flavonoidsin Mexican lime during progression of WBDL
Days* C EC R H Q N K
0 12.8 ± 0.17 10.7 ± 0.15 10.9 ± 0.18 16.9 ± 0.14 9.3 ± 0.12 7.9 ± 0.13 10.6 ± 0.16 30 22.8 ± 0.21 28.7 ± 0.24 11.9 ± 0.21 20.9 ± 0.21 7.8 ± 0.11 15.9 ± 0.15 15.6 ± 0.16 60 24.7 ± 0.19 29.0 ± 0.22 11.2 ± 0.19 22.3 ± 0.18 6.1 ± 0.11 16.2 ± 0.14 14.5 ± 0.13 90 25.1 ± 0.23 26.1 ± 0.19 8.2 ± 0.17 16.3 ± 0.22 4.4 ± 0.08 16.8 ± 0.14 13.2 ± 0.14 120 22.9 ± 0.18 19.9 ± 0.18 6.9 ± 0.12 12.8 ± 0.15 nd 12.9 ± 0.16 10.9 ± 0.16 150 17.3 ± 0.21 18.7 ± 0.16 3.8 ± 0.07 8.3 ± 0.11 nd 10.9 ± 0.15 8.2 ± 0.13 180 8.9 ± 0.12 13.3 ± 0.16 nd 6.3 ± 0.11 nd 8.9 ± 0.12 6.3 ± 0.12
* indicate the times after inoculation of Mexican lime tree with phytoplasma The amount of flavonoids was calculated according to µg per gram of plant
R: Rutin; H: Hesperidin; C: Catechin; EC: Epicatechin; N: Naringenin; Q: Quercetin; K: Kaempferol
Quantitative analysis of flavonoids in Mexican lime
infection by Alternariaalternatathrough blocking the formation of infection hyphae from haustoria although it allows both spore germination and appressoria formation [23].
Assay of phenylalanine ammonia-lyase (PAL)
[image:6.595.158.457.242.418.2]The activity of PAL wasstudied during the progression ofWBDL in leaves of lime. Figure 2demonstrated that after 30 days of lime-inoculation, PAL activity started to increasesignificantly from 3.334 to 12.925 units and then reached the maximums on the 90 days after the pathogen challenge. Then, the activities declined drastically 150 days after challenge inoculation. These results are almost in agreement with the behaviors of flavonoids levels. The activities of these enzymes agree with those obtained by Shehab et al. who investigated a time course changes of PAL activity in the potatoinoculatedwithPhytophthorainfestans [24]. Although an increase in the activity was recorded in the treated groups between days 4 and 7 with a maximum increase at day 7, a decrease in the activity was observed after this period. Chen et al. reported that high levels of PAL were induced in cucumber roots inoculated with Pythiumaphanidermatum, but roots treated with Pseudomonas corrugatahad initially higher levels of PAL and these levels became lower after the plant challenge with Pthiumaphanidermatum [25].
Figure 2: Activities of phenylalanine ammonia-lyase (PAL) in Mexican lime during progression of Witches' broom disease. Data are mean ± SD (vertical bars), n = 5
CONCLUSION
This work proposes a valuable new method for the qualification and quantification of seven flavonoids in Mexican lime during the progression of WBDL. This method is a simple, fast, accurate, precise and robust. We also conclude that the infection of lime by WBDL induces the production of phenol-oxidizing enzymes, followed by the biosynthesis of flavonoids in the leaves. In other words, when the lime trees are infected withCA.
Phytoplasmaaurantifolia, thelevel of phenol-oxidizing enzyme increases and consequently defense response
expresses an interference with the further growth and development of the pathogen. Therefore, the increase in the levels of flavonoids in leaves is as a defense response to Ca. Phytoplasmaaurantifoliaattack. Furthermore, these results suggest that metabolite profiling can be considered as a biomarker for the detection of infected lime plant by
Ca. Phytoplasmaaurantifolia.
Acknowledgement
The authors gratefully acknowledge the ShahidBeheshti University, G.C. for financial support of this study.
REFERENCES
[1] MGarnier; LZreik;JM Bove,Plant Dis.,1991, 75, 546-551.
[2] MSalehi; K Izadpanah;HRahimian,Iran.J. Plant Pathol.,1997, 33, 76. [3] TBoldicke,Iran. J. Biotech.,2013, 11, 144.
[4] F Shahryari; M Shams-Bakhsh; MR Safarnejad; N Safaie; S AtaeiKachoiee,Iran. J. Biotech., 2013, 11, 14-21. [5] FTaheri; GNematzadeh; MGZamharir; MKNekouei; MNaghavi; MMardi;GHSalekdeh, MolBioSys.,2011, 7,3028-3035.
[6] CBrunetti; RMGeorge; MTattini; KField; PMatthew; MPDavey,J. Exp. Botany.,2013, 64, 4011-4020. [7] DBalmer; VFlors; GGlauser; BMauch-Mani,Frontiers. Plant Sci.,2013, 4, 1-12.
[8] AGhassempour; SMollayi; MFarzaneh; ASharifi-Tehrani; HY Aboul-Enein,Food Chem., 2011, 125,1287-1290.
0 0.4 0.8 1.2 1.6 2
0 30 60 90 120 150 180
P
A
L
a
ct
ivi
ty
U
ni
t /
m
g
pr
ot
ei
n
×
h
[9] TKGunning; XAConlan; RMParker; GADyson; MJAdams; NWBarnett; DM Cahill,Function Plant Biol.,2013, 40, 1089-1097.
[10] AQawasmeh; HKObied;ARaman; W Wheatley,J. Agri. Food. Chem., 2012, 60, 3381-3388. [11] KAAliferis; DFaubert; S Jabaji,PLoS ONE.,2014, 9(11),1-13.
[12] MMikulic-Petkovsek; ASlatnar; RVeberic; FStampar, Physiol. Mol. Plant Pathol.,2011, 76, 159-165. [13] EMiddleton;MD Jr,Pharmaceut Biol., 1996, 34, 344-348.
[14] D Treutter,Plant Biol., 2005, 7, 581-791.
[15] AFini; CBrunetti; MDFerdinando; FFerrini; MTattini,Plant Signal. Behav.,2011, 6,709-711.
[16] GN Agrios. Plant Pathology, 4th Edition. Academic press, London, New York, 1997, 93-114.
[17] ADCampos; AGFerreira; MMVHampe; IFAntunes; NBrancao; EPSilveira; JBSilva; VA Osorio,Brazil. J. Plant
Physiol.,2003, 15, 129-134.
[18] GYonghong; B Yang; IDavid,Physiol. Mol. Plant Pathol.,2013, 81, 13-21. [19] LZreik;P Carle;JM Bové;MGarnier,Inter. J. system Bacteriol.,1995, 45, 449-453. [20] KH Row; Y Jin,Biores. Technol.,2006, 97, 790-793.
[21] ICH Q2B,CPMP/ ICH/281/ 1996, 95.
[22] EAHavir; KRHanson,Meth.Enzymol.,1970, 17, 575-581.
[23] M Yamamoto; S Nakatsuka;H Otani;KKohmoto,Phytopathol.,2000, 90, 595-600. [24] GMGShehab; OKAhmed; MA Ahmad,J. Biol. Chem. Res., 2013, 30, 929-941.