International Journal of Innovative Technology and Exploring Engineering (IJITEE) ISSN: 2278-3075,Volume-8 Issue-12, October, 2019
Optimization of Friction Stir Welding process
parameters of Aluminium alloy AA7075-T6 by
using Taguchi
method
P. Pradeep Kumar, Sk Ahmmad Basha, S. Sai Kumar
Abstract: Taguchi technique has been used to determine the most important control variables that will result in greater mechanical characteristics (tensile strength and hardness) of FSW joints of comparable AA 7075 plates. To optimize process parameters including tool rotatory speed, weld travel velocity on tensile strength and hardness of friction stir welded similar AA 7075 aluminium alloy, Taguchi Design of Experiment (DOE) and optimization method was used. The optimum levels of process parameters were identified by using the Taguchi parametric design concept. The results show that welding speed is more contributing process parameter than the rotation speed in getting optimum mechanical property (UTS and HV). The forecasted optimal values of ultimate tensile strength and hardness of friction stir welded similar AA 7075 is 197 Mpa and 93 HRB respectively. Further tests proved these results.
Main Words: Aluminium alloy, Friction Stir welding, Taguchi Technique
I. INTRODUCTION
F
riction stir welding (FSW) has emerged as technique of wide spread interest due to its number of advantages and more significant for which can be able to weld generally unweldble alloys. FSW is a solid state joining technique in which the material is being welded below its melting point. The welding parameters are important players during FSW. Optimum selection of welding parameters (Tool travel & Rotational speeds) will alter the better weld quality, mechanical and microstructural propertiesTaguchi method has been broadly used with minimal variation to optimize and measure the effect of different process parameters on their performance.
Taguchi method was performed to optimize process parameters for weld bead tensile strength and hardness. Taguchi proposes using the S / N ratio to assess the quality features that deviate from the target values.
The S / N ratio of process parameter of each level is calculated depending on the S / N analysis. Taguchi L9 Orthogonal array is used to find the influence FSW joints of AA7075 from each processing parameter (i.e. rotatory speed, traverse speed) for optimum tensile strength and hardness. Refer (Fig.1)
Revised Manuscript Received on October 10, 2019
P.Pradeep Kumar *, Dept. of mechanical Engineering, RGUKT IIIT
Nuzvid, Krishna (521201), Andhra Pradesh, India, [email protected]
Dr. Sk. Ahammad Basha *,Ph.d Dept. of mechanical Engineering, RGUKT IIIT Nuzvid, Krishna (521201), Andhra Pradesh, India, [email protected]
S.Sai Kumar, Dept. of mechanical Engineering, RGUKT IIIT Nuzvid, Krishna (521201), Andhra Pradesh, India, [email protected]
Uses an unconsumable tool to join two aluminum plates facing without melting of the metal workpiece. Heat is generated by friction between the workpiece materials, This tends to a smooth region close to the FSW tool. Whereas the tool is passed along the joint path, the two parts of the metal are mechanically mixed and the mechanical pressure exerted by the tool forges the heated and softened material.
A.FSW (Operating Principle)
A rotating cylindrical tool with a profiled probe is plunge into a butt joint between two clamped Al plates, till the shoulder, which is bigger than the pin, hits the workpiece surface. The pin is slightly shorter than the necessary weld depth, with the shoulder of the tool riding over the work surface. After a short dwelling time, the tool is traveled at the predefined weld speed by follow the joint line. The wear-resistant tool and the workpieces liberate friction heat. This heat, together with that produced by the mechanical mixing process and the adiabatic heat inside the material, causes the stirred materials to smoothen without melts. As the tool is traveled forward, a different profile on the probe forces plastic deformation of material from the leading face to the rear, where the high forces help the weld to be forged. This procedure of the tool passing along the welding line in a plasticized tubular metal shaft results in serious solid-state deformation contributes dynamic recrystallization of the base metal.
A.AA7075
Taguchi
method
Table- 1 chemical composition of AA7075-T6
Fig. 1 Friction Stir Welding Setup C. Tool Travel speed and rotational speed
This is the key process parameters during FSW and is primarily accountable for the production of heat. The rotation may be in the clockwise or counterclockwise accordingly. The rotational and the movement of the tool produces frictional heat inside the aluminum plates and metal is brought to plasticized state and due application of pressure will cause the weld to form. Travelling speed of the tool often plays an important role. It depends on a number of factors like type of alloy, speed of rotation, depth of penetration and type of joint
D. Tool tilt and plunge depth
An appropriate angle of tilt onto the spindle offers an extra advantage for keeping the stirred material as well as adequate motion of plasticized material. The tilt angle is represented by (θ). The impact depth on the formation weld bead is defined by its impact on the distribution of temperature and also on the blending of material. In order to produce sound welds with soft tool handles the plunge depth of the pin onto the job parts is essential.
E.Tool characteristics
Tool designs effect heat output, plastic flow, energy requirements and weld joint homogeneity. The tool profile that contains the tool shoulder and pin contributes to the creation of welds for about all variables. The pin dimensions and pin profile variability directly affects material mixing flow and etc. The profiles of pin frequently used are spherical, cylindrical, threaded, square, octagon shaped etc. Tool steel, carbide tool, High speed steel etc, are the widely used common tool materials for FSW.
II. LITERATURE RIVIEW
A. Optimization of Parameters for the Tensile strength of FSW Aluminum alloy with Taguchi method
[image:2.595.302.531.439.506.2]In this study, Vikas, Mandeep Singh [6] use Al 6063 T6 is used as working material. Process parameters rotatory speed, traverse speed and in order to find their impact on tensile strength, the axial force is varied. The test was scheduled in the Taguchi orthogonal array L9. S / N ratios analyze the best possible setting parameters and ANOVA determines the contribution from the input parameter. Al6063 alloy butt joint specification with threaded cylindrical pin by FSW technique was successfully developed. They use rotational speeds 850rpm, 1050rpm, 1200rpm, traverse speeds 40mm/min, 58mm/min, 78mm/min and axial forces are 4kN, 5kN, 6kN.The optimal combination for FSW process parameters is a spindle speed of 1200 rpm, a translational feed of 78mm / min, an axial load of 6 KN, which achieves maximum tensile strength. .The maximum contribution of translation feed was 81.31% and rotational velocity was 15.44% accompanied by axial force with minimal influence of 2.03% on tensile strength. B. Influence of Tool Pin Geometric shapes on Friction Stir Welded similar Aluminum Alloy Joints In this study, an effort was produced to evaluate the tensile strength under distinct tool pin geometries of comparable joints of FSW structural aluminum alloy plates. .The instrument pin geometries used in this investigation were triangular, rounded and hexagonal. In this case study, AA 6082-T6 sheets 200 mm X 80 mm X 8 mm were used. Based on ASTM-B557, the 19.05 mm wide and 158.57 mm2 cross sectional area were prepared.(refer fig. 2 Tensile Test sample) .Then tensile test was performed on UTM to define the tensile strength of 9 samples were welded using different pin profiles. .
Fig. 2 Tensile test specimen
They use rotatory speeds 1200 rpm, 1400 rpm, 1600 rpm and traverse speeds 10mm/min, 12 mm/min, 14 mm/min. It has been noted that the Hexagonal tool pin profile has maximum tensile strength 82.1 Pa. At a rotatory speed of 1200 rpm and through velocity of 10 mm / min. Maximum tensile strength of 83 MPa at 1200 rpm tool rotatory speed and 10 mm / min tool traverse velocity for Triangular tool pin profile. Moreover, the highest tensile strength was noted for the same rotatory speed and through velocity for the rounded pin profile 78.2 MPa.
Comparing all outcomes, Triangular tool pin profile at 1200 rpm tool rotatory speed and 10 mm / min trough velocity results in greater Ultimate traction strength compared to other tool pins.
B.Optimzation of processs parameters in FSW by ANOVA analysis
Element Al Zn Mg Cu Cr
International Journal of Innovative Technology and Exploring Engineering (IJITEE) ISSN: 2278-3075,Volume-8 Issue-12, October, 2019
In this , M.V.R.Durga Prasad, Kiran Kumar Namala[5] studied on AA5083 andAA6061 plates of 200 x 100 x 5mm Thickness was quantified. A rotatory speed, weld speed and tilt angle of the tool were the process parameters in this investigation at 3 levels each. Tests are performed in the L9 orthogonal array of Taguchi. The mechanical properties of welded samples are the % of elastic deformation and durability (Vickers).
Tool used in this study is H13 tool steel with taper cylindrical pin geometry. The tool's profile is 18 mm shoulder dia and 6 mm pin dia with 14 ° taper angle. .They use rotational speeds 800rpm, 1200rpm, 1600rpm, traverse speeds are 20mm/min, 50mm/min, 80mm/min and tilt angle in degrees are 0, 1, and 2.
The main factor is the welding speed, which leads to the percentage elongation effect by 54.88%, and the less influence of the tool velocity is 5.39%. The ideal state to achieve a good percentage extension is 800rpm tool rotation speed; 20mm / min weld speed and a 1degree angle tilt. Welding speed was the main factor in the effect of hardness in the weld zone at 67.52% and the tool rotatory speed influence at 4.39%. The optimal tool rotatory speeds 800rpm, weld speed 20mm / min and tool tilt angle 2 degrees have been noticed to achieve well hardening in the weld zone.
C.Influence of process parameters on FSW of AL6063 In the study, R.Muthu Vaidyanathan, MahboobPatel, N.SivaRaman, D.Tedwors[7] investigate about Optimum parameters to joining AA6063 butt joints. Rotatory speed, transverse speed, and axial force are the key factors considered for study. The material AA6063 was cut in size of 150x 100x 5 mm. The plates were positioned in a butt joint configuration of 100 mm long; the width is 150 mm and the FSW process is performed in a normal direction to the plates. They use rotational speeds 1000 rpm, 1500 rpm traverse speeds 0.5 mm/s and 1 mm/s axial loads 4000N, 6000N. A group of 4 samples were ready to determine the mechanical properties using an EDM wire cutting machine. Here, by using the Analysis of variance (ANOVA) they find out the factor is most effect the tensile strength and hardness. From the Analysis of Varience technique they concluded that welding speed was the key input parameter with the greatest statistical effect on mechanical properties such as tensile strength, deformation, and hardness. A max nominal Ultimate stress (101Mpa) shown by tool with optimal process parameters of tool rotatory speed, 1000 rpm; axial force, 6000N and transverse speed of 1mm / sec. Axial force and rotatory speeds are the powerful parameters for equivalent stress induced in the tool followed By velocity of rotation. It is found that for all samples the percentage of deformation is lower, showing that the amount of heat liberated in the process is lower.
III.EXPERIMENTAL ANALYSIS A. Experimental Procedure
(i) First AA7075 plates were cut into the dimensions 100mmx50mmx5mm.
(ii) Then, these plates were friction stir welded under the process parameters of axial load 500N, Tool rotational speed in the range of 1000 to 1400 rpm and tool travel speed in the range of 20 to 40 mm/min.
(iii) The tensile test specimens with dimensions as shown in sample specimen figure were cut on EDM (Electric Discharge Machining) machine.
(iv) The tensile specimens were subjected to tensile test on ZWICK ROWELL UTM (Universal Testing Machine). (v) And finally we done hardness test on weld nugget zone in weld joint Rockwell Hardness Machine.
(vi) The data obtained from these two tests, we did ANOVA and Taguchi analysis in MINITAB17.
By using the analysis of Taguchi and ANOVA, we can conclude the optimum process parameters and parameter contribution on tensile strength and hardness. These process parameters are used to get sound joint of welding by using friction tool.
(vii) Machines are used for performing experiment are Electrical Discharging Machine (EDM), FSW setup on milling machine (in JNTU Kakinada), Rockwell hardness machine, Zwick Rowell Universal Testing Machine (in MME department, RGUKT NUZVID
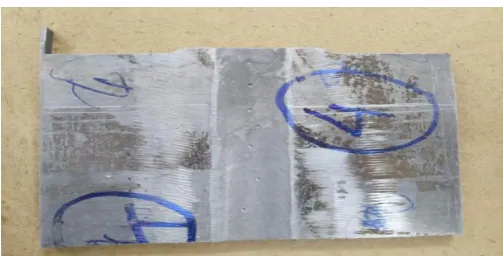
[image:3.595.301.553.403.531.2]B. Rockwell Hardness Testing
Fig. 3 FSW joint with hardness indentation
The hardness test technique for Rockwell involves a diamond cone or hardcore steel ball penetration of the sample material. On a small initial load F0 (Figure 4A) generally 10 kgf the indenter is fed onto the sample accordingly. When stability is achieved, an indicating unit that follows the indenter's penetration and thus reacts to updates in the indenter's depth of penetration is fixed to a datum position. A further large load is applied while the preliminary low load continues with a rise of penetration. (Fig 4 B). The additional major load will be removed when the stability has been reached again, but the initial minor load will still be preserved. The elimination of the extra major load enables partial retain, thus lowering the penetration depth (Fig 4 C). For calculating the Rockwell hardness numbers, continuous rise in penetration depth arising from use and withdrawal of the added significant load is
Taguchi
method
Fig. 4 Rockwell hardness testing principle
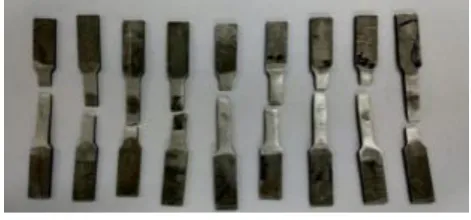
[image:4.595.48.299.201.296.2]B.Zwick Rowell Tensile Testing Sample Specimen
[image:4.595.45.281.397.507.2]Fig. 5 Tensile test specimen used for experiment The nine tests based on the orthogonal array L9 were performed. The effects of the Al 7075 alloy were investigated for various parameters such as tool rotatory speed, longitudinal feed and axial force. Table of observation shows the experimental values of tensile strength
[image:4.595.46.294.558.707.2]Fig. 6 Tensile specimen after the experiment Table- 2 Process Parameters and Experimental Results
Sam ple num ber
Rotatory Speed (rpm)
Travel speed (mm/m in)
Axial force (N)
Hard-ness (HRB)
UTS (MPa)
Joint Efficie ncy (%)
1 1000 20 500 82 135.698 61.68
2 1000 30 500 85 145.476 66.125
3 1000 40 500 93 197.080 89.58
4 1200 20 500 75 119.454 54.297
5 1200 30 500 85 192.521 87.51
6 1200 40 500 88 161.687 73.49
7 1400 20 500 81 181.167 82.348
8 1400 30 500 83 195.253 88.75
9 1400 40 500 85 188.544 85.7
Graph 1 Hardness vs Rotational speed at different speeds
Graph. 2 UTS vs rotational speed at different weld speeds
C. Taguchi Analysis
The Taguchi technique, even renowned as Dr. Taguchi’s solid design technique, significantly enhances the productivity of engineering. It is a strong statistical method to improve product / process design and solve manufacturing issues. It is based on the concept that quality must be evaluated not by compliance with predefined tolerance limits, but by the deviation from the defined target value. Quality cannot be guaranteed through inspection and rework but it should be incorporated via a suitable method and product design.
There have been 3 ideas in specific as the primary contributions to Taguchi method-orthogonal arrays; robustness; and quality loss function. Taguchi Technique contributes to identifying good control factors in order to achieve the process's best possible results. A set of tests are conducted using Orthogonal Arrays (OA). These experimental values are used for analysis of data and forecast the quality of the products
As mentioned above, the Complete Factory based Design needs a huge number of tests to be performed. When the range of factors increases, it will become laborious but also complicated. To resolve this issue, Taguchi proposed a specifically designed technique called the use of "orthogonal array" to investigate the whole space of the parameter with less experimentation to be carried out. Taguchi therefore instructs using the loss function to calculate the performance features that deviate from the
International Journal of Innovative Technology and Exploring Engineering (IJITEE) ISSN: 2278-3075,Volume-8 Issue-12, October, 2019
[image:5.595.40.281.147.224.2]This loss function's value is further converted into the signal-to-noise ratio (S / N). There are usually 3 performance characteristics classifications to evaluate the S/N ratio. They are: nominal-the-best, greater-the-better, and smaller-the-better.
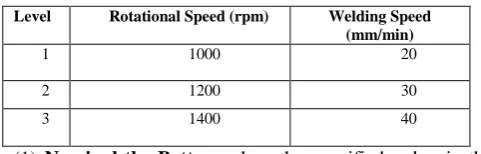
Table -3 Different Level Factors
(1) Nominal-the-Better: when the specified value is the most favored in neither a smaller nor larger value (e.g. chemical species ratios or parts in nominal-dimensional mechanical fitting). The S / N-ratio model is
(2) The Greater-the-Better or the Bigger the Better: if the desired response is maximum (e.g., material yield strength, critical current, fluid filling mass flow rates, etc.) The model for S/N ratio is
(3) The Lower or smaller the better: if the desired response is minimum (e.g. engine fuel usage rate, aircraft components weight, etc.). The S / N ratio model is
Where μ is S/N Ratio, y is measurable statistic of response; s2 is the sample variance of n unit
To determine the appropriate orthogonal array, use the following procedure.
1. Define the number of factors and their levels 2. Determine the degrees of freedom
3. Choose an Orthogonal array
The no. of operating conditions is equal to the number of rows in the orthogonal array and must equal to or more than the degrees of freedom.
Steps to solving in Taguchi's technique The basic steps are involved in using Taguchi's parameter design.
1.Recognize the primary function and adverse influences. 2. Note the aspects of noise, testing condition and quality 2.Identify the best possible objective function
3.Define the factors of control and their level
4.Choose the appropriate Orthogonal Array and build the Matrix
6. Experiment with the Matrix.
7. Investigate the data; detect the level and performance of the best possible control factor.
Taguchi analysis for hardness and UTS
In this analysis our main objective is to find out the optimum parameters which affect the hardness of the FSW joint. Here we use larger the better S/N ratio model to get the optimum parameters.
Table-4 S/N ratio for different samples hardness
Table-5 Response Table for S/N ratio of Hardness Level Rotational
Speed(rpm)
Welding Speed(mm/min)
1 38.74 37.98
2 38.33 38.52
3 38.38 38.95
Delta 0.42 0.97
Rank 2 1
Table-6 S/N Ratio of Different Samples (UTS) Rotational
speed
Welding speed
Axial force
UTS S/N ratio
(rpm) (mm/min) (N) (MPa)
1000 20 500 135.698 42.6514
1000 30 500 145.476 43.2558
1000 40 500 197.08 45.8928
1200 20 500 119.454 41.544
1200 30 500 192.521 45.6896
1200 40 500 161.687 44.1735
1400 20 500 181.167 45.1616
1400 30 500 195.253 45.8119
1400 40 500 188.544 45.5082
Level Rotational Speed (rpm) Welding Speed (mm/min) 1 1000 20
2 1200 30
3 1400 40
Rotational speed(rpm)
Welding speed (mm/min)
Axial force (N)
Hardness (HRB)
S/N ratio
1000 20 500 82 38.2763
1000 30 500 85 38.5884
1200 20 500 75 37.5012
1200 30 500 85 38.5884
1200 40 500 88 38.8897
1400 20 500 81 38.1697
1400 30 500 83 38.3816
[image:5.595.300.540.472.660.2]Taguchi
method
Table-7 Response Table for Signal to Noise Ration of UTS
LEVEL ROTATIONAL SPEED
(rpm)
Welding speed (mm/min)
1 43.93 43.12
2 43.80 44.92
3 45.49 45.19
Delta 1.69 2.07
Rank 2 1
Here delta is the difference between the highest value and smallest value of corresponding factor in response table for S/N ratio. According to value of the delta, we give rank to the factors, which affects the hardness and ultimate tensile strength.
Graph. 3 Main effects plot for S/N ratio of hardness
Graph . 4 Main effects plot for S/N ratio of UTS G. Regression equations
1) For hardness
Hardness = 81.11 - 0.00917 rotational speed + 0.467 weld speed
Graph . 5 experimental values vs Regression values of Hardness
2) for ultimate tensile strength Ultimate tensile strength (MPa) = 26.3 + 0.0723 rotational speed + 1.850 weld speed
Graph. 6 Experimental value vs Regression value of UTS
H. ANOVA
Analysis of Variance is a statistical method used to verify whether there are significant differences between the means of 2 or more entities. ANOVA compares the means of distinct samples to check the effect of 1 or more variables
.
Table-8 Model of ANOVA Table
Source
DOF Sum of
squares
Mean squares
F- value
P-value
Factor 1 A-1
Factor 2 B-1
Error (A-1)(B-1)
Total N-1
Where A= number of levels of factor 1 B = number of levels of factor 2 N = number of samples
Some formulae related to ANOVA table
Total sum of squares = Sum of squares of factor 1 + Sum of squares of factor 2 + Sum of
International Journal of Innovative Technology and Exploring Engineering (IJITEE) ISSN: 2278-3075,Volume-8 Issue-12, October, 2019
Mean squares = Sum of squares/DOF
F = Mean square of factor/Mean square of error
The F-test developed by Fischer, is used to determine significance at a designated alpha value. This alpha value depends on the confidence level we taken in the ANOVA technique.
From an F-Table, we find out the critical F-value. It this value is greater than the calculated F-value in ANOVA table then the factor is not significant. If the factor is significant then the P-value is less than the alpha value and if the factor is not significant then the P-value is greater than the alpha value.
I. ANOVA analysis for hardness
General Linear Model: hardness versus rotational speed (rpm), welding speed (mm/min)
[image:7.595.306.514.138.310.2]Analysis of Variance for Transformed Response
Table- 9 Response table of ANOVA for hardness
J. ANOVA analysis for UTS
General Linear Model: ultimate tensile versus rotational speed, welding speed (mm/min) Analysis of Variance for Transformed Response
Table- 10 Response table of ANOVA for UTS Source D
O F
Sum of squares Mean squares F-valu e P-val ue Contributio n(%) Rotational speed(rpm) 2 1812450 17 9062250 9
1.31 0.3
64 25.85 Welding speed(mm/ min) 2 2439907 47 1219953 74
1.77 0.2
82 34.80 Error 4 2757920 18 6894800 5 39.34 Total 8 7010277 83 100
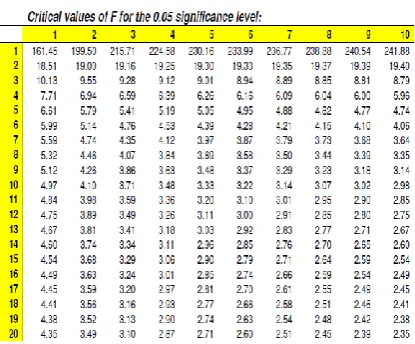
This table gives the Critical values F in level P=0.05 of significance. Steps involved to find out the critical value of F are
1.Get the F-ratio. This is connected with (x, y) degrees of freedom (DoF). 2. Go along columns of x, and go down rows of y. Your critical F-ratio is the point of intersection. 3. If your F value is equal or greater than this critical F-value, then your result is significant at that level of probability.
An e.g: I get a 3.96 F-ratio with (2, 20) .DoF I’m going through 2 columns and 24 rows down. F's critical value is 3.49. My F-ratio acquired is greater than this, now I came to know that my F-ratio acquired is likely to occur by chance with a p<.05
Table- 11 Table of F values
1) Contribution of factors on hardness
For rotational speed, we get F-value from ANOVA table is 1.79. But the critical value at (2,4) degrees of freedom is 6.94. So, the critical value is higher than calculated value. So, rotational speed has not much effect on hardness (i.e. it is not significant). It’s contribution percentage is 15.56.
Similarly, for welding speed, we get F-value from ANOVA table is 7.7. But the critical value at (2,4) degrees of freedom is 6.94. So, the critical value is lower than the calculated value. So, the welding speed is significant (i.e. it has an effect on hardness). It’s contribution percentage is 67.03.
2)Contribution of factors on Ultimate Tensile Strength For rotational speed, we get F-value from ANOVA table is 1.31. But the critical value at (2,4) degrees of freedom is 6.94. So, the critical value is higher than calculated value. So, rotational speed has not much effect on ultimate tensile strength (i.e. it is not significant). It’s contribution percentage is 25.85.
Similarly, for welding speed, we get F-value from ANOVA table is 1.77(Table-11). But the critical value at (2,4) degrees of freedom is 6.94. So, the critical value is higher than the calculated value. So, the welding speed is also not significant (i.e. it has less effect on hardness). It’s contribution percentage is 34.80.
IV. CONCLUSIONS
AA 7075 alloy plates with dimensions 100x50x5 mm were friction stir welded under the process parameters of axial load 500kN, Tool rotational speed in the range of 1000 to 1400 rpm and tool travel speed in the range of 20 to 40 mm/min. After creating the FSW joint done the hardness test on Rockwell hardness machine.
Source D O F
Sum of squares
Mean squares
F-value
P-value Contri bution( %) Rotational speed (rpm) 2
857834 428917 1.79 0.279 15.56
Welding speed (mm/min)
2
3695461 1847730 7.70 0.042 67.03
Error
4
959639 239910 17.41
Total
8
Taguchi
method
The tensile test specimens with dimensions 100x10x2 mm were subjected to tensile stress on ZWICK ROWELL UTM.. Ultimate tensile strength of each specimen was obtained from the stress-strain graphs. From the experimental results, done the analysis in the Minitab 17 by using Taguchi technique and ANOVA.
Table- 12 Optimum Process Parameters table
Property TRS (rpm) WS (mm/min)
Hardness 1000 40
UTS 1400 40
(1) By Taguchi technique, optimum process parameters for hardness are 1000 rpm,40 mm/min for UTS are 1400 rpm, 40 mm/min.
(2) From experiment we get optimum value for hardness at 1000 rpm, 40 mm/min and optimum value for UTS at 1000 rpm, 40 mm/min.
(3) And from ANOVA, welding speed has more contribution percentage than rotational speed for both hardness and UTS.
(4) Finally, we find out error is more in UTS values this is because here we fix the axial load parameter. If it is not fixed, then number of experiments is increasing then error is decreasing.
REFERENCES
1. D.Devaiah, K.Kishore, P. Laxminarayana, “Optimization of Process
Parameters in Friction Stir welding of dissimilar aluminium alloys (AA5083 and AA6061) Using Taguchi Technique”, International Journal of Innovative Research in Science & Engineering and Technology, .Volume: 05, Issue: 08, August 2016.
2. Srinivas Athreya, Dr Y.D.Venkatesh, “Application Of Taguchi
Method For Optimization Of Process Parameters In Improving The Surface Roughness Of Lathe Facing Operation”, International
referred journal of Engineering and science,
Volume:01,Issue:03,2012.
3. Akshansh Mishra, Devarrishi Dixit, Gopikrishna Nidigonda,” Effect
of Tool pin geometries on the Tensile Strength of FSW structural Al alloy similar joints”, International Journal of Innovative Research in Science & Engineering and Technology, Volume: 06, Issue: 03, March 2016.
4. S. Sattari, H. Bisadi, M. Sajed, “Mechanical Properties and
Temperature Distributions of Thin Friction Stir Welded Sheets of AA5083”, International Journal of Mechanics and Applicants,2012.
5. M.V.R.Durga Prasad, Kiran Kumar Namala, “Process parameters
optimization in friction stir welding by ANOVA”, International Conference on Materials Processing and Characterisation, 2017.
6. Vikas, Mandeep Singh, “Parameters optimization for Tensile
strength of FSW of Aluminium alloy using Taguchi Technique”, International Journal of Technical Research, Volume.5, Issue:01, Mar-Apr 2016
7. R.Muthu Vaidhyanathan ,Mahaboob Patel, N. Siva Raman ,
D.Tedwors,”Optimum Parameters of joining of butt joint Aluminium alloy 6063
AUTHORS PROFILE
P. Pradeep Kumar* .M Tech Done his specialization in manufacturing and industrial Engineering .Now working as Asst. Professor in Dept. Mechanical Engineering, RGUKT IIIT Nuzvid . Interests are friction stir welding, industrial Engineering.
Dr. Sk. Ahmmad Basha* Ph.d specialized in
Industrial Engineering and Now working as Asst.
Professor in Dept. Mechanical Engineering.
S. Sai Kumar. Pursuing B.Tech in Dept.
Mechanical Engineering .RGUKT IIIT Nuzvid
.interested in Manufacturing and Production processs