0022-538X/07/$08.00⫹0 doi:10.1128/JVI.02535-06
Copyright © 2007, American Society for Microbiology. All Rights Reserved.
Multifunctional Human Immunodeficiency Virus (HIV) Gag-Specific
CD8
⫹
T-Cell Responses in Rectal Mucosa and Peripheral Blood
Mononuclear Cells during Chronic HIV Type 1 Infection
䌤
J. William Critchfield,
1Donna Lemongello,
1Digna H. Walker,
2Juan C. Garcia,
3David M. Asmuth,
2Richard B. Pollard,
2and Barbara L. Shacklett
1,2*
Department of Medical Microbiology and Immunology,1Department of Internal Medicine, Division of Infectious Diseases,2and
Division of Gastroenterology,3School of Medicine, University of California, Davis, California
Received 16 November 2006/Accepted 21 February 2007
The intestinal tract is a lymphocyte-rich site that undergoes severe depletion of memory CD4ⴙT cells within days of simian immunodeficiency virus or human immunodeficiency virus type 1 (HIV-1) infection. An ensuing influx of virus-specific CD8ⴙT cells, which persist throughout the chronic phase of infection, has also been documented in the gastrointestinal tract. However, little is known of the functionality of these effector cells or their relationship to the disease course. In this study, we measured CD8ⴙT-cell responses to HIV-1 peptides in paired rectal and blood samples from chronically infected patients. In both blood and rectum, there was an immunodominant CD8ⴙ T-cell response to HIV Gag compared to Pol and Env (P < 0.01). In contrast, cytomegalovirus pp65 peptides elicited gamma interferon (IFN-␥) secretion strongly in peripheral blood mononuclear cells (PBMC) but weakly in rectal CD8ⴙT cells (Pⴝ0.015). Upon stimulation with HIV peptides, CD8ⴙT cells from both sites were capable of mounting complex responses including degranulation (CD107 expression) and IFN-␥and tumor necrosis factor alpha (TNF-␣) production. In rectal tissue, CD107 release was frequently coupled with production of IFN-␥ or TNF-␣. In patients not on antiretroviral therapy, the magnitude of Gag-specific responses, as a percentage of CD8ⴙT cells, was greater in the rectal mucosa than in PBMC (P ⴝ 0.054); however, the breakdown of responding cells into specific functional categories was similar in both sites. These findings demonstrate that rectal CD8ⴙT cells are capable of robust and varied HIV-1-specific responses and therefore likely play an active role in eliminating infected cells during chronic infection.
The gastrointestinal (GI) mucosa is not only a site where human immunodeficiency virus type 1 (HIV-1) can gain access to the body but has also emerged as a fundamental target tissue for HIV-1 and simian immunodeficiency virus (SIV) replica-tion and pathogenesis, regardless of the specific tissue site of viral entry. Well-established postinfection events in the GI mucosa include rapid infection and large-scale elimination of memory CCR5⫹CD4⫹T cells following infection with either SIV (31, 38, 57, 59, 60) or HIV-1 (10, 12, 40) and the subse-quent emergence of virus-specific CD8⫹T cells that arrive in the mucosa after the virus has spread beyond the local tissue (49, 59, 60). Both the marked depletion of intestinal CD4⫹T cells and the recruitment of CD8⫹T cells last throughout the chronic phase of infection (54). For patients on antiretroviral therapy (ART), reconstitution of CD4⫹T cells is delayed in the gut compared to the blood (19). Pronounced CD4⫹T-cell depletion in the GI mucosa compromises the gut’s immune barrier, setting the stage for facilitated pathogen entry and potentially contributing to chronic immune activation (9). Meanwhile, the appearance of virus-specific CD8⫹ T cells, though “too little and too late” to extinguish the infection (49), may still result in the dampening of virus replication via killing
of infected cells, safeguarding of remaining uninfected target cells, and overall slowing of the disease course. In general, GI mucosal CD8⫹T cells contain very little perforin compared to their peripheral blood and splenic counterparts (53); whether this deficit compromises cytotoxic ability is not known. In ad-dition, the GI mucosal microenvironment is unique in terms of microbial antigen load and cytokine composition and has been shown to engender a distinctive memory CD8⫹T-cell phenotype (37). The functional responsiveness of CD8⫹T cells in this tissue compartment may also deviate quantita-tively or qualitaquantita-tively from responses measured in blood or other tissues.
Based on pronounced and persistent viral replication in the GI mucosa and the recruitment of virus-specific CD8⫹T cells into this tissue, there is a need to establish the functionality of these effector cells and to explore relationships to disease course. Several lines of evidence support a central role for CD8⫹ T cells in eliminating HIV-1-infected cells: first, the appearance of measurable cytotoxic T lymphocytes (CTL) dur-ing acute infection coincides with the decline of initial viremia (30); second, depletion of CD8⫹ T cells from the blood of SIV-infected rhesus macaques leads to a resurgence of viremia (26); and third, CTL exert immunological pressure on viral sequences, leading to the emergence of escape mutants in both HIV-1 and SIV (8, 45). With the advent of major histocom-patibility complex (MHC) class I tetramer technology, early studies suggested an inverse relationship between viral load * Corresponding author. Mailing address: One Shields Avenue,
De-partment of Medical Microbiology and Immunology, 3146 Tupper Hall, University of California, Davis, CA 95616. Phone: (530) 752-6785. Fax: (530) 752-8692. E-mail: [email protected].
䌤Published ahead of print on 7 March 2007.
5460
on November 8, 2019 by guest
http://jvi.asm.org/
and HIV-1-specific T-cell frequency during chronic infection (46). However, more recent studies employing comprehensive enzyme-linked immunospot assays and cytokine flow cytom-etry to assess T-cell responses spanning the entire HIV-1 ge-nome have not confirmed this finding (1, 3). Because of their ability to eliminate virally infected target cells, HIV-1-specific CD8⫹T cells may also contribute to the profound depletion and delayed restoration of mucosal CD4⫹T cells (41).
In an effort to better define the immunological correlates of disease status and progression, recent studies have focused on unique cohorts such as long-term nonprogressors (LTNP) (i.e., asymptomatic individuals infected for more than 10 years, with low to undetectable plasma viral loads and robust CD4⫹T-cell counts). In a novel approach involving the simultaneous mea-surement of gamma interferon (IFN-␥), tumor necrosis factor (TNF), interleukin 2 (IL-2), macrophage inflammatory protein 1(MIP-1), and CD107 (a marker of degranulation) in HIV-1 peptide-stimulated peripheral blood CD8⫹ T cells, it was found that LTNP possess a consistently higher proportion of HIV-1-specific cells positive for four and five functions than progressors (6). Additionally, within the progressor group, polyfunctionality of CD8⫹cells correlated inversely with viral load. Thus, the capacity of peripheral CD8⫹T cells to mount multiple cytokine/chemokine and degranulation responses, in contrast to a monofunctional or limited response repertoire, is likely related to disease progression and should be considered in studies of mucosal CD8⫹T cells as well. As noted above, however, the GI mucosa is both a unique microenvironment and the site of persistent virus replication, suggesting that antiviral CD8⫹T-cell responses may be quantitatively and/or qualitatively different from responses in blood and may relate to disease progression in a unique manner.
Here, our objective was to characterize CD8⫹ T-cell re-sponses in paired blood and rectal mucosa samples from chronically HIV-1 infected patients, mainly those not on ART. This cross-sectional analysis was the precursor to a multi-year, longitudinal study of mucosal T-cell responses that is ongoing. In phase I of the study, we measured IFN-␥ pro-duction in response to overlapping peptide pools from HIV Gag, Pol, and Env and cytomegalovirus (CMV) pp65, and we observed an immunodominant response to HIV Gag in both the rectum and peripheral blood mononuclear cells (PBMC); responses to CMV were vigorous only in periph-eral blood. In phase II, we focused on HIV Gag stimulation, expanded the measurements to include IFN-␥, TNF-␣, and CD107, and utilized Boolean gating analysis to segregate responding cells into categories defined by positivity or neg-ativity for each marker. The choice of these three markers was guided by the rationale that both IFN-␥and TNF-␣are important proinflammatory cytokines associated with cyto-toxic capacity (33) and that CD107 expression is strongly correlated with MHC class I-restricted cytotoxicity as mea-sured by51Cr release (50). The total percentage of
respond-ing Gag-specific cells was high in the rectum compared to peripheral blood, while the breakdown of the responding cells into specific functional categories was similar for the two tissue compartments. No single category of response in either tissue correlated with blood CD4⫹ T-cell count or plasma viral load, but the CD107 (degranulation) response was dominant in rectal mucosa. Thus, during chronic
infec-tion, HIV-1-specific CD8⫹T cells in rectal mucosa are able to generate multiple robust antiviral functions, including degranulation.
MATERIALS AND METHODS
Subjects and tissue collection.Study subjects were patients at the Center for AIDS Research, Education, and Services clinic, Sacramento, CA, and/or were referred by local clinicians. The work described in this report comprised the first phase of an ongoing longitudinal study. Our goal for these early studies was to sample chronically infected patients (primarily those not on ART) with a broad range of viral loads and CD4 counts in preparation for more-detailed studies of specific subgroups. Written informed consent for phlebotomy and rectal biopsy was obtained through study protocols approved by the Institutional Review Board, School of Medicine, University of California, Davis. Blood was collected by sterile venipuncture using EDTA as an anticoagulant. Rectal tissue was obtained by fiber optically guided flexible sigmoidoscopy, with biopsy specimens taken approximately 10 cm from the anal verge (55). This approach is well documented in the literature, involves minimal patient discomfort, and provides sufficient lymphoid cells for cellular immunology assays (2, 13, 23, 52–55). The sigmoidoscope (Olympus CF-140S; Olympus America, Center Valley, PA) was equipped with a biopsy channel, and specimens were procured with single-use biopsy forceps (Radial Jaw 3; Boston Scientific, Miami, FL). In each procedure, 20 to 25 tissue pieces were collected and immediately placed in complete me-dium (described below). Biopsy specimens and blood were processed on the same day as collection.
Blood and rectal tissue processing.PBMC were obtained from blood using Ficoll-Paque (Pfizer-Pharmacia, New York, NY). Mononuclear cells were iso-lated from rectal biopsy specimens by following a published protocol that was optimized for high yield and viability of mucosal lymphocytes without compro-mising the detection of most surface antigens (55). Briefly, fresh biopsy speci-mens were first washed with RPMI 1640 supplemented with fetal calf serum (FCS; 15%), penicillin (100 U/ml), streptomycin (100g/ml), and glutamine (2 mM) (complete medium) and were then exposed to three sequential digestions with 0.5 mg collagenase (catalog no. C6885; Sigma-Aldrich, St. Louis, MO) per ml of medium–phosphate-buffered saline (PBS) (1:1; PBS without Ca and Mg). Digestions were carried out at 37°C with continuous mixing, and each was followed by passing the suspended biopsy specimens through a 16-gauge blunt-end needle to aid in dispersal. Liberated cells were then separated from the remaining tissue pieces by passage through a 70-m nylon cell strainer (Becton Dickinson Discovery Labware, Bedford, MA). Cells obtained from each diges-tion were immediately washed twice in medium to remove collagenase, while the remaining undigested tissue pieces were returned to the next round of digestion. Following the three digestions, the resulting cells were pooled in medium and then centrifuged (700⫻g) on a Percoll gradient (60%, 35%) (Sigma-Aldrich) for 20 min at 4°C. To maximize rectal mononuclear cell (MNC) recovery, both the upper and lower interfaces were collected and pooled, leaving behind pelleted debris. Cells were washed in PBS, resuspended in medium further supplemented with piperacillin-tazobactam (0.5 mg/ml) (Zosyn; Wyeth Pharmaceuticals, Phil-adelphia, PA) to discourage bacterial growth, counted, and incubated overnight prior to analysis. Yields were typically in the range of 5⫻106
to 30⫻106
viable MNC per patient (20 to 25 biopsy specimens combined).
Antibodies and peptide pools.Fluorochrome-labeled monoclonal antibodies to CD3 (clones SP-34 and SK7), CD8 (clone SK1), CD107a and CD107b (clones H4A3 and H4B4), IFN-␥(clone 25723.11), and TNF-␣(clone 6401.1111), and unlabeled costimulatory antibodies to CD28 (clone L293) and CD49d (clone L25), were purchased from Becton-Dickinson Pharmingen (BD; San Diego, CA). Peptide pools consisted of 15-mer peptides with an 11-amino-acid overlap. HIV Gag (p55, HXB2 sequence) and CMV pp65 (AD169 sequence) pools were also purchased from BD. HIV Env and HIV Pol pools (clade B consensus) were prepared from individual peptides obtained from the NIH AIDS Research and Reference Reagent Program, Germantown, MD.
ICS and flow cytometry.All intracellular cytokine staining (ICS) assays were carried out on freshly isolated cells that were rested overnight. Initial experi-ments measuring CD3, CD8, and IFN-␥followed a published procedure and used a 96-well V-bottom format with 106
PBMC or rectal MNC (28, 55). Anti-genic stimulation was with peptide pools representing HIV Gag (3.5g/ml), HIV Pol (0.4g/ml), HIV Env (1.0g/ml), and CMV pp65 (3.5g/ml). Concentra-tions for individual peptide pools were optimized in ICS experiments to elicit maximal responses (data not shown). For all ICS assays, the negative control consisted of the medium containing the peptide vehicle (dimethyl sulfoxide) and
VOL. 81, 2007 MULTIFUNCTIONAL HIV-1-SPECIFIC CD8⫹ T CELLS IN THE GUT 5461
on November 8, 2019 by guest
http://jvi.asm.org/
costimulatory antibodies, and the positive control was staphylococcus entero-toxin B (SEB; 5g/ml).
The ICS procedure for experiments incorporating three functional responses (IFN-␥, TNF, and CD107a and -b) was as follows (4): 1⫻106
cells in 200l complete medium (see above) were treated with anti-CD28 (2.5g/ml), anti-CD49d (5g/ml), anti-CD107a and -b, monensin (1M GolgiStop; BD Bio-sciences), brefeldin A (5g/ml), and an HIV Gag peptide pool or dimethyl sulfoxide. Following a 5-h incubation, cells were washed in PBS–2% FCS–0.5 mM EDTA, stained for surface markers in PBS–2% FCS for 20 min at 4°C, fixed in 4% formaldehyde, and then permeabilized using FACS Perm 2 (BD Bio-sciences). Cells were then washed in PBS–2% FCS, stained for intracellular markers and CD3, washed again, and stored at 4°C in PBS–1% formaldehyde until analysis (within 24 h). Flow cytometry was performed on a FACScan (BD Immunocytometry Systems, San Jose, CA) which was upgraded with a second laser (637 nm) to enable measurements in five fluorescent channels (Cytek Development, Fremont, CA).
Cytometry data were analyzed with FlowJo software (Tree Star, Ashland, OR); for experiments measuring three functional responses, Boolean gating was used to partition cells into specific response categories. Bivariate plots were also constructed in order to visually evaluate responding populations. SPICE soft-ware (version 3.1; Mario Roederer, Vaccine Research Center, NIAID/NIH, Bethesda, MD) was used to graph response data. SPICE was also used to determine the relative contribution of each individual response category to the total antigen-specific response by dividing background-subtracted values by the sum of responses in all functional categories.
Statistical analysis.Net antigen-specific responses were calculated by sub-tracting values for the negative control (medium plus costimulatory antibodies) from antigen-specific responses. A positive response threshold was set at 0.05% of CD8⫹T cells (55), and values below this level, after subtraction of
negative-control values, were set to zero. Negative-negative-control values were generally⬍0.5% for CD8⫹T cells in PBMC and became extremely low when combinations of functions were examined, as previously described (6). In PBMC, median nega-tive-control values were 0.0050, 0.0050, and 0.120% for triple-, dual-, and single-function CD8⫹T cells, respectively. In rectal mucosa, negative-control values were somewhat higher for individual functions; this was anticipated based on previous findings that rectal cells constitutively express a broad range of cyto-kines (39). However, the background remained low in rectal MNC when com-binations of functions were examined. Median backgrounds in mucosal cells were 0.053, 0.030, and 0.660% for triple-, dual-, and single-function CD8⫹T cells, respectively.
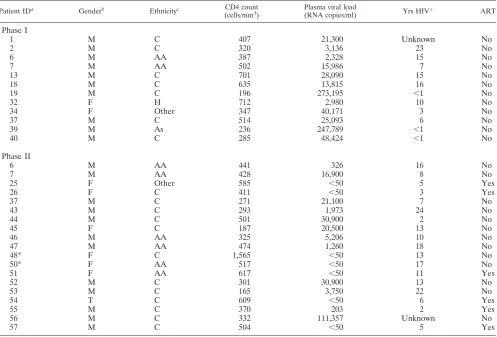
[image:3.585.45.542.81.418.2]Correlations between the CD8⫹T-cell response magnitude and the plasma viral load and CD4⫹ T-cell count in blood, and between the CD8⫹T-cell response magnitude and the CD3⫹CD8⫺ cell count in rectal MNC, were determined using linear regression (Spearman correlation; GraphPad Prism, version 4; GraphPad Software, San Diego, CA). Initial comparisons of response magnitude between groups were performed using Kruskal-Wallis tests, followed by Dunn’s multiple-comparison test (GraphPad Prism). To compare response patterns (i.e., one, two, or three functions) between tissues (gut versus PBMC) or between patient groups (on versus off ART), a multivariate, correlated-errors mixed-linear model was fit to the data using restricted maximum likelihood (SAS software; SAS Institute, Cary, NC). For each patient and tissue (i.e., gut or PBMC), the fraction of HIV-1 Gag-specific cells in each functional group (i.e., one, two or three functions) was calculated. Proportions of cells in each func-tional group were then transformed using the arcsine square root transformation in order to stabilize variance. An unstructured covariance matrix was used for the functional groups. Subject variation was modeled using random effects. The full model was specified, including all main effects and interactions for ART, tissue TABLE 1. Characteristics of study patients
Patient IDa Genderb Ethnicityc CD4 count (cells/mm3)
Plasma viral load
(RNA copies/ml) Yrs HIV⫹ ART
Phase I
1 M C 407 21,300 Unknown No
2 M C 320 3,136 23 No
6 M AA 387 2,328 15 No
7 M AA 502 15,986 7 No
13 M C 701 28,090 15 No
18 M C 635 13,815 16 No
19 M C 196 273,195 ⬍1 No
32 F H 712 2,980 10 No
34 F Other 347 40,171 3 No
37 M C 514 25,093 6 No
39 M As 236 247,789 ⬍1 No
40 M C 285 48,424 ⬍1 No
Phase II
6 M AA 441 326 16 No
7 M AA 428 16,900 8 No
25 F Other 585 ⬍50 5 Yes
26 F C 411 ⬍50 3 Yes
37 M C 271 21,100 7 No
43 M C 293 1,973 24 No
44 M C 501 30,900 2 No
45 F C 187 20,500 13 No
46 M AA 325 5,206 10 No
47 M AA 474 1,260 18 No
48* F C 1,565 ⬍50 13 No
50* F AA 517 ⬍50 17 No
51 F AA 617 ⬍50 11 Yes
52 M C 301 30,900 13 No
53 M C 165 3,750 22 No
54 T C 609 ⬍50 6 Yes
55 M C 370 203 2 Yes
56 M C 332 111,357 Unknown No
57 M C 504 ⬍50 5 Yes
aID, identification; *, LTNP, as defined in the text. bM, male; F, female; T, transgender.
cAA, African-American; As, Asian; C, Caucasian; H, Hispanic.
on November 8, 2019 by guest
http://jvi.asm.org/
type, and functional group. Model fit was assessed by graphical residual analysis and a Shapiro-Wilk test for normality of residuals.
RESULTS
Subject characteristics.Blood CD4⫹T-cell counts, plasma viral loads, and related information on the 28 patients partic-ipating in the study are shown in Table 1. The first phase of the study, which addressed IFN-␥production in response to mul-tiple peptide pools, included 12 individuals, none of them on ART. The second phase of the study, which focused on IFN-␥, TNF, and CD107 responses to HIV Gag stimulation, included 19 patients, 3 of whom were also enrolled in the first phase. Six of these 19 patients were on ART, with complete or near-complete suppression of plasma viremia. The number of years since initial HIV-1 seropositivity ranged from⬍1 to
⬎20. Two individuals classified as LTNP were enrolled in
phase II (patients 48 and 50); at recruitment, these patients had been seropositive without ART for⬎10 years and had undetectable plasma viral loads and blood CD4⫹ T-cell counts of⬎500/mm3.
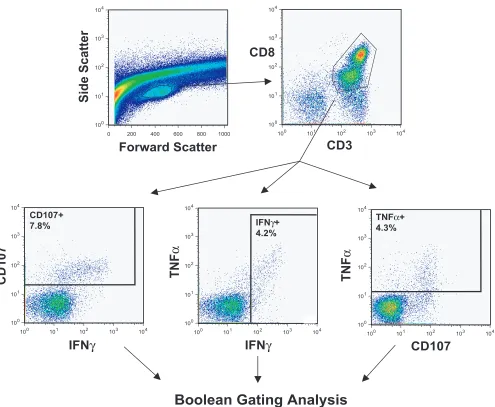
[image:4.585.47.542.64.471.2]Flow cytometry gating pathway.Figure 1 illustrates the gat-ing strategy used in analysis of five-color, three-function flow cytometry data from a typical rectal MNC sample that was stimulated with HIV Gag peptides. Rectal samples had distinct lymphocyte populations that were discernible by a forward-scatter versus a side-forward-scatter plot. After initial gating on lym-phocytes, cells were selected based on CD3⫹CD8⫹staining and then divided into three individual functional response gates consisting of cells positive for CD107, IFN-␥, or TNF-␣. These three functions were selected based on the large body of literature implicating both IFN-␥and TNF-␣as critical cyto-kines released by HIV-1-specific CD8⫹T cells (14, 22, 25, 51) FIG. 1. Flow cytometry gating scheme. This figure illustrates the gating strategy used in analysis of five-color, three-function flow cytometry data. Data are shown for rectal mononuclear cells from patient 37 stimulated with HIV Gag peptides. After initial gating on lymphocytes, cells were first selected based on CD3⫹CD8⫹staining and then divided into three individual response gates consisting of cells positive for CD107, IFN-␥, or TNF-␣. Cells within these individual response gates were then entered into Boolean gating analysis to generate frequencies for the eight possible combinations (i.e., positive or negative) of the three functions (FlowJo software; TreeStar).
VOL. 81, 2007 MULTIFUNCTIONAL HIV-1-SPECIFIC CD8⫹ T CELLS IN THE GUT 5463
on November 8, 2019 by guest
http://jvi.asm.org/
and on recent studies demonstrating a direct correlation be-tween the release of lysosome-associated membrane protein-1 (Lamp-1, also known as CD107a), a component of cytolytic granules, and CD8⫹T-cell cytotoxicity (4, 5). For the patients studied, the CD107 response was typically the single strongest response in both rectal mucosa and PBMC.
Intriguingly, we detected different frequencies of CD3⫹ CD8dim cells in rectal cell preparations from study subjects.
There are reports of increased frequencies of CD3⫹CD8dim
cells in PBMC during HIV infection, and one study reported an enhanced effector function of these cells (58). In our data set, a comparison of CD3⫹CD8dim versus CD8bright
popula-tions did not reveal significantly different patterns of cytokine production or degranulation (data not shown). However, in many cases the population of CD8dim cells was too small for
accurate evaluation; additional studies will be required to de-termine the relevance of CD8dimmucosal cells.
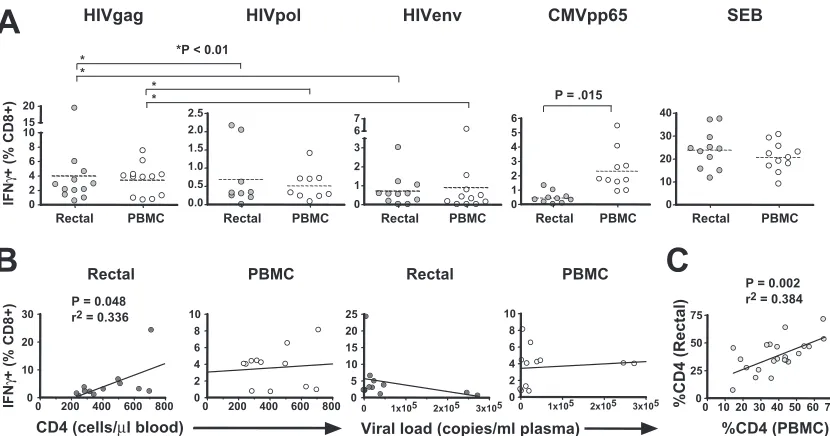
Single-function analysis: HIV Gag responses are immuno-dominant in mucosa.Evaluation of IFN-␥responses to HIV Gag, Pol, and Env revealed substantial responses to all three peptide pools in both tissue compartments (Fig. 2A). The immunodominance of Gag was evident in both sites: Gag-specific IFN-␥responses were significantly greater than Pol-and Env-specific responses in both the rectum Pol-and the blood (P ⬍ 0.01 by the Kruskal-Wallis test and Dunn’s multiple-comparison test). Responses to the three HIV-1 peptide pools were generally similar in magnitude for the two tissue com-partments (P ⬎ 0.05). In contrast, IFN-␥production in re-sponse to CMV pp65 peptide pool stimulation was approxi-mately fivefold higher in peripheral blood than in the rectum
(P ⫽ 0.015) (Fig. 2A). Thus, while HIV-1 and CMV each establish chronic infections, the distribution of HIV-1- and CMV-specific CD8⫹ T cells differs between the rectal and peripheral blood compartments.
In order to establish whether the magnitude of HIV Gag-specific IFN-␥production, in either the rectum or the blood, was related to the CD4⫹T-cell count or viral load, we per-formed linear regression analyses (Fig. 2B). In the rectum, the percentage of responding cells was correlated marginally with the blood CD4⫹ T-cell count (P ⫽ 0.048) but not with the rectal CD4⫹T-cell percentage (data not shown). Regression analyses for the PBMC compartment did not yield significant relationships or visual trends.
CD4ⴙT-cell percentages in rectal mucosa parallel those in PBMC. CD4⫹ T-cell percentages were determined in three and five-color flow cytometry experiments by gating on CD3⫹ CD8⫺cells within the live lymphocyte gate (15). Percentages of CD4⫹T cells in rectal mucosa and PBMC were positively correlated (P⫽0.002;r2⫽0.384, linear regression) (Fig. 2C).
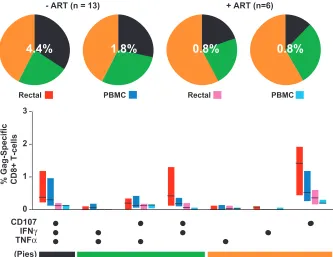
[image:5.585.84.499.66.284.2]Multifunctional HIV-specific CD8ⴙ T cells are found in both the rectum and peripheral blood.Analysis of five-color flow cytometry data revealed complex HIV-1-specific T-cell response patterns in both mucosal MNC and PBMC. Patterns of response to HIV Gag stimulation are shown in Fig. 3; percentages were corrected for cytokine expression measured in negative-control samples receiving costimulatory antibodies alone. Percentages below 0.05 were considered to be below the level of detection and were therefore set to zero. For patients not on ART (n⫽13), the average total percentage of CD8⫹ cells exhibiting any response was higher in the rectum (4.4%) FIG. 2. IFN-␥production in response to HIV and CMV peptides. This figure summarizes phase I of the study, in which we assessed IFN-␥ production in PBMC and rectal cells in response to HIV Gag, Pol, and Env peptides, CMV pp65, and SEB. (A) Response magnitudes (yaxis) in rectal MNC and PBMC are reported as the percentages of CD3⫹CD8⫹lymphocytes producing IFN-␥after background subtraction. Dashed lines indicate mean values. Two-tailed, pairedttests were used to compare responses in rectal MNC and PBMC;Pvalues are shown only where significant differences were found (P⬍0.05). Multiple comparisons (*) were performed using Kruskal-Wallis tests, followed by Dunn’s multiple-comparison test. (B) Linear regression analyses were performed to compare blood CD4⫹T-cell counts and plasma viral loads to the magnitude of HIV Gag-specific IFN-␥responses in the rectum and PBMC (Spearman correlation).Pvalues are shown only where significant relationships were found (P⬍0.05). (C) Linear regression analysis revealed a significant correlation between the percentages of CD4⫹T cells in rectal mucosa and PBMC (Spearman correlation).
on November 8, 2019 by guest
http://jvi.asm.org/
than in PBMC (1.8%). The breakdown of responding cells into specific functional categories was similar for the two compart-ments, with approximately one-third of responding cells falling into each of the triple-positive, dual-positive, and single-posi-tive categories (Fig. 3). In contrast, for patients on ART, there was a low total percentage of responding cells (0.8%) in both the rectum and PBMC. In addition, the response pattern was shifted toward cells with a lower number of functions com-pared to that for patients not on ART (Fig. 3, pie charts).
HIV-1-specific cells could be categorized into seven func-tional groups (eight minus the triple-negative group) based on specific combinations of CD107, IFN-␥, and TNF-␣(Fig. 3, bar graphs). For patients not on ART, triple-function CD8⫹ T cells (expressing CD107, IFN-␥, and TNF-␣), were abundant in rectal mucosa as well as PBMC. Among three possible dual-function subsets, CD107⫹IFN-␥⫹cells were most abun-dant, followed by CD107⫹TNF-␣⫹cells. Cells expressing both IFN-␥and TNF-␣ were rare in both the gut and the blood. Among single-function subsets, CD107⫹ cells dominated in both the rectum and PBMC. The single most striking differ-ence between mucosae and PBMC was the dominance of CD107 expression by rectal Gag-specific CD8⫹ T cells, both alone (single positive), in combination with IFN-␥(dual posi-tive), and in combination with both IFN-␥and TNF-␣(triple positive).
As in the first phase of the study, linear regression analysis was conducted to test for possible relationships between the
CD4⫹T-cell count, the plasma viral load, and the percentage of CD8⫹T cells responding to antigenic stimulation. Thus, we established linear regressions for (i) the total percentage of cells responding to HIV Gag stimulation by any combination of the functional measurements (CD107a, IFN-␥, and TNF-␣), (ii) the percentage of cells positive for each of the three re-sponses separately, irrespective of whether they were single, dual, or triple functional, and (iii) the percentage of cells falling into each of the seven specific response categories (the total of these is the same as the first measurement described above). In contrast to the first phase, where we observed a significant positive correlation between the percentage of rec-tal CD8⫹cells positive for IFN-␥and CD4⫹T-cell counts (Fig. 2B), in the second phase no category of response in either compartment correlated significantly with blood or rectal CD4⫹T-cell levels or plasma viral load (data not shown).
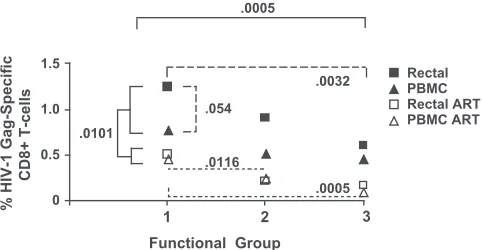
[image:6.585.125.458.68.325.2]Significant differences in CD8ⴙ T-cell responses between tissues, patient groups, and cell subsets.To further examine the relationships among patient groups, tissue sites, and func-tional T-cell subsets, we performed statistical analysis using a multivariate, correlated-errors mixed-linear model. For this model, responses were grouped into three categories—single-, dual-, and triple-functional CD8⫹T cells—as shown on the pie charts in Fig. 3. These categories were then compared between patient groups (ART versus no ART) and between tissues (PBMC versus rectal mucosa). Subject 50, classified as an LTNP, was a clear statistical outlier and was removed from the FIG. 3. Five-color, three-function analysis of HIV Gag-specific responses. This figure summarizes data for all 19 patients enrolled in phase II of the study (Table 1). Bar graphs show the magnitude of HIV Gag-specific responses in each functional category, expressed as a percentage of CD8⫹T cells after subtraction of background values. Values below the cutoff of 0.05% were dropped. Bars indicate interquartile ranges, ranging from the 25th to the 75th percentile. The median response for each category is indicated by a horizontal black line. The combination of functions evaluated in each category is shown below the bar graphs; these combinations have been color coded and correspond to slices of the pie charts above. In the pie charts, triple-function responses (expressing CD107, IFN-␥, and TNF-␣) are coded as black, dual-function cells are coded as green, and single-function responses are coded as orange. The percentages superimposed on the pie charts represent the mean total-response magnitude (i.e., all nonoverlapping functional groups combined) for each patient group and tissue site.
VOL. 81, 2007 MULTIFUNCTIONAL HIV-1-SPECIFIC CD8⫹ T CELLS IN THE GUT 5465
on November 8, 2019 by guest
http://jvi.asm.org/
analysis to allow a more-precise estimation of effects; results for this patient are discussed separately below. After initial fitting of the full model, an outlying residual was noted (subject 7, rectal tissue, single-function cells). This observation was also dropped from the analysis, improving the fit without changing qualitative results.
The results of this statistical analysis are summarized in Fig. 4. The magnitude of Gag-specific T-cell responses was significantly lower for subjects on ART than for those not on treatment (P⫽ 0.0101 by a type 3 test of fixed effects). The response magnitude also differed significantly between func-tional groups when single-, dual-, and triple-funcfunc-tional re-sponses were compared (P ⫽ 0.0005) (Fig. 4). There was a trend toward an effect of ART on the distribution of functional responses (P ⫽0.163) (data not shown), with individuals on ART having somewhat less complex, more monofunctional responses than those not on ART.
Across both tissues and both patient groups, single-function cells were consistently the most abundant and triple-function cells the rarest. Among subjects not on ART, there were sig-nificant differences in the HIV Gag-specific response magni-tude between functional groups (P⫽0.0032 for group 1 versus group 3; difference of least squares means) as well as a bor-derline-significant difference in magnitude between tissues, with rectal responses tending to be more robust than PBMC responses (P ⫽0.054). Within the ART group, responses in the blood and rectal mucosa were of similar magnitude, but differences between functional groups were preserved (P ⫽
0.0116 for group 1 versus group 2 andP⫽0.0005 for group 1 versus group 3).
Two LTNP with strikingly different HIV-specific T-cell re-sponse patterns.Two individuals in this study, patients 48 and 50, had the characteristics of LTNP (16). Class I HLA typing
revealed that patient 48 carried the HLA-B*57 allele and pa-tient 50 carried the HLA-B*27 allele, both of which have been associated with slow progression (11, 42). The full class I hap-lotypes for these two individuals were as follows: A2/A2, B13/ B57, and C6/C6 for patient 48 and A30/A30, B8/B27, and C3/C7 for patient 50.
CD8⫹ T cells from the two LTNP enrolled in this study revealed strikingly different responses to HIV Gag peptide stimulation (Fig. 5). Patient 50 (Fig. 5A) had the highest total percentage of responding cells in rectal mucosa (18%) of any subject in the study, and fully two-thirds of these cells were triple functional. Thus, 12% of this patient’s rectal Gag-spe-cific CD8⫹T cells expressed IFN-␥and TNF-␣and released CD107-containing granules following HIV Gag stimulation. As discussed earlier, the unusually high magnitude of this subject’s mucosal response made it a statistical outlier for the purposes of multivariate analysis. In contrast, the PBMC response for this individual was unremarkable in terms of total magnitude and distribution across response categories. The second LTNP, patient 48, had total CD8⫹ responses in both the rectum (1.1%) and PBMC (0.2%) that were weak compared to the means for all patients and were heavily biased toward mono-and dual-functional responses. Thus, despite similar clinical profiles, LTNP may have strikingly different T-cell responses, sometimes including remarkably strong and complex mucosal responses.
DISCUSSION
This study, using paired measurements of CD8⫹T-cell re-sponses from the PBMC and rectal mucosae of 28 individuals, demonstrates that robust, high-magnitude, and polyfunctional T-cell responses are active in the GI mucosa during the course of chronic HIV-1 infection. As a frequent site of HIV-1 trans-mission, as well as the major early target site of CD4⫹T-cell depletion in the body, the GI tract has been referred to as the “front line” in the battle between HIV-1 and the infected host (21). Recent studies of rhesus macaques experimentally in-fected with SIV (SIVmac) have suggested that the HIV-1-specific CD8⫹T-cell response in gut mucosa occurs “too little and too late” to prevent widespread viral dissemination and CD4⫹T-cell depletion (49). It was therefore critical to estab-lish whether functional HIV-1-specific T-cell responses are indeed mounted in the gastrointestinal mucosa during chronic, persistent infection.
[image:7.585.43.284.69.194.2]Phenotype and function of mucosal CD8ⴙ T cells. These studies demonstrate that mucosal HIV-specific CD8⫹ T-cell responses have broad specificity and include polyfunctional cells capable of releasing multiple cytokines as well as CD107. It is noteworthy that CD107 expression was the dominant HIV-1-specific response detected in rectal mucosa, suggesting active release of cytolytic granules in response to T-cell recep-tor (TCR) stimulation. As we previously demonstrated, muco-sal CD8⫹ T-cell granules contain abundant granzymes but relatively little perforin, except during acute/early infection (48, 53). In addition, CD8⫹T cells in rectal mucosal effector sites are biased toward a unique, partially activated “effector memory” phenotype, expressing CD45RO, but not CCR7 (53), as well as CD69 and CD103 (54). There are additional differ-ences between intraepithelial lymphocytes and lamina propria FIG. 4. Statistical analysis. This figure summarizes the results of
multivariate analysis as described in the text. Single-, dual-, and triple-functional CD8⫹T cells are indicated as functional groups 1, 2, and 3, respectively. Numbers on theyaxis indicate mean HIV Gag-specific responses for patients on ART (open symbols) or not on ART (filled symbols). The response magnitude differed significantly between sub-jects who were on ART and subsub-jects who were not (P⫽0.0101) (solid brackets) and between functional groups when single-, dual-, and tri-ple-function responses from all patients were compared (P⫽0.0005) (solid brackets). Among subjects not on ART, there were significant differences between functional groups 1 and 3 (P ⫽0.0032) (broad dashes) and a borderline significant difference between rectal and PBMC responses (P⫽0.054) (broad dashes). Among those on ART, there were significant differences in magnitude between groups 1 and 2 and between groups 1 and 3 (P⫽0.0115 and 0.0005, respectively) (narrow dashes).
on November 8, 2019 by guest
http://jvi.asm.org/
(LP) lymphocytes. The observation that mucosal T cells differ significantly in phenotype from their counterparts in the blood was recently confirmed by studies in the mouse (37, 61). Mu-rine CD8⫹intraepithelial lymphocytes are distinct from typical central and effector memory T-cell subsets and adopt a unique
phenotype characterized by upregulation of CD69, CD103, and granzyme B (37, 61). Induction of this phenotype is ap-parently mediated by exposure to cytokines produced in the mucosal microenvironment (37). Thus, in both humans and rodents, mucosal CD8⫹T cells appear to have a unique mem-FIG. 5. LTNP with strikingly different T-cell responses. This figure summarizes results for two LTNP, patients 50 and 48. (A) Bar graphs show the total magnitude of HIV Gag-specific responses in each functional category, expressed as a percentage of CD8⫹T cells after subtraction of background values. Values below the cutoff of 0.05% were dropped. The combination of functions evaluated in each category is given below the bar graph; these combinations have been color coded and correspond to slices of the pie charts above. In the pie charts, triple-function responses (expressing CD107, IFN-␥, and TNF-␣) are coded as black, dual-function cells are coded as green, and single-function responses are coded as orange. The percentages superimposed on the pie charts represent the total-response magnitude (i.e., all nonoverlapping functional groups combined) for each patient and tissue. (B) Flow cytometry plots showing the response of CD8⫹T cells from patient 50 to stimulation with HIV-1 Gag peptides. A robust, polyfunctional response was observed in cells from rectal mucosa (top row), while a more modest response was observed in PBMC (bottom row). Numbers are percentages of CD8⫹T cells expressing each marker after subtraction of values for unstimulated controls.
VOL. 81, 2007 MULTIFUNCTIONAL HIV-1-SPECIFIC CD8⫹ T CELLS IN THE GUT 5467
on November 8, 2019 by guest
http://jvi.asm.org/
ory phenotype distinguishing them from their counterparts in peripheral blood; this phenotype may be strongly influenced by the mucosal cytokine milieu.
The cytokines TNF-␣, IFN-␥, and IL-2 are sequentially pro-duced by CD8⫹T cells upon TCR stimulation (51), and the response profile is regulated by the level of stimulation (7). In the context of chronic viral infection, the ability to produce cytokines may be progressively lost as a result of immune exhaustion (17). According to a recent model, “mild” T-cell exhaustion corresponds to loss of cytotoxic function and IL-2 production, with preservation of IFN-␥and TNF-␣production (17). “Intermediate exhaustion” corresponds to the ability to produce a single cytokine, IFN-␥, and “full exhaustion” de-notes the inability to produce any cytokines, coupled with in-duction of apoptosis. For our patients with chronic HIV-1 infection, some CD8⫹T cells were capable of secreting only TNF-␣or IFN-␥, yet the majority of single-function cells were in fact CD107 positive. Assuming a direct relationship between CD107 release and cytotoxic capacity, this finding suggests that for these patients, cytotoxicity was retained in the face of chronic antigenic stimulation. It should be noted that most of our patients were clinically healthy, with CD4 T-cell counts greater than 250/l, suggesting that “full exhaustion” had not occurred. Longitudinal studies will be required to determine the temporal association between antigen load and CD8⫹ T-cell functional diversity. It will also be of interest to determine whether additional cytokines, such as IL-2, MIP-1, and IL-10 are also secreted by HIV-1-specific cells in mucosal tissues.
Robust degranulation despite low perforin expression.The cytolytic granule exocytosis pathway is believed to be the major mechanism utilized by HIV-1-specific CTL in the blood (56) and gut (44) to kill infected target cells. Given the importance of this pathway, it was not surprising to find that mucosal CD8⫹T cells actively degranulate in response to TCR stimu-lation. However, this finding must be reconciled with the low levels of perforin previously observed in gut CD8⫹ T cells during chronic HIV-1 infection (48, 53). One possibility is that perforin is rapidly produced and continuously released by gut CD8⫹T cells, precluding its detection by standard methods. However, granzymes A and B are readily detected by flow cytometry and immunohistochemistry in rectal CD8⫹T cells, which would not be anticipated if granule constituents were continuously expelled (48, 53). As previously proposed, per-forin may be expressed in the gut at extremely low levels in order to preserve the integrity of the mucosal surface, and its expression may be tightly regulated at the transcriptional level (32, 63). Degranulation would then be predicted to release granzymes A and B as well as the limited amount of perforin present in mucosal CD8⫹T-cell granules.
Effects of ART. The effects of ART were similar in both compartments: individuals on ART had significantly lower magnitude responses to HIV Gag in both the rectum and PBMC than those not on ART. Furthermore, the frequency of HIV Gag-specific CD8⫹T cells was comparable in rectal mu-cosa and PBMC. Thus, the well-documented decline in HIV-1-specific CD8⫹T-cell responses during ART appears to apply to mucosal tissues as well as blood (18, 27, 47). In both the rectum and PBMC, the pattern of responses for individuals on ART was shifted toward monofunctional CD8⫹T cells, with the highest overall responses in the single-positive CD107⫹
group. The prevalence of single-function populations among patients on ART may be related to the greater degree of immune exhaustion of these individuals prior to their begin-ning ART (17). Longitudinal studies of patients beginbegin-ning ART will be required in order to explore the relationship between suppression of viral antigen load, CD4⫹T-cell deple-tion/restoration, and CD8⫹T-cell function in mucosal tissues.
Differential localization of HIV-1- and CMV-specific cells.
In contrast to HIV-1-specific T cells, which were abundant in blood and mucosal tissues, CMV pp65-specific CD8⫹T cells were numerous in PBMC yet rare in rectal mucosa (P⫽0.015). This finding extends the results of an earlier study, in which we utilized MHC class I tetramers to detect cells specific for HLA-A*0201-restricted HIV-1 epitopes (SL9 and IV9) and CMV epitopes (NLV9) in blood and mucosa (54). For both HIV-infected individuals and healthy controls, CMV NLV9-specific CD8⫹T cells were rare or absent in rectal mucosa yet abun-dant in blood (54). In the present study, we utilized overlap-ping peptides spanning the entire pp65 protein to measure CMV responses; thus, the earlier findings can now be gener-alized to CD8⫹ T cells specific for the entire CMV pp65 protein, regardless of MHC restriction.
These findings demonstrate that memory T cells specific for different viral antigens are not uniformly distributed through-out the body and that intestinal CD8⫹T cells do not simply mirror the antigen-specific memory populations present in pe-ripheral blood. Recent work with murine models has demon-strated that localized viral infections can induce promiscuous trafficking of virus-specific CD8⫹T cells to a broad range of tissues, including the intestinal LP (35, 36). However, in adop-tive transfer experiments, intravenously injected memory CD8⫹ T cells, originally harvested from blood or lymphoid tissues, were not capable of efficient homing to the intestinal LP (36). This surprising observation suggested that antigen-specific CD8⫹T cells do not always recirculate between intes-tinal effector sites and peripheral blood but likely require an active mucosal infection in order to home to mucosal tissues. Given that HIV-1 actively replicates in rectal mucosa, this selective homing suggests that HIV-1-specific but not CMV-specific CD8⫹T cells are primed in mucosal inductive sites and programmed to localize to mucosal effector sites (43). In con-trast, CMV replication in mucosal tissues is likely to be low except in individuals with active CMV disease (29).
Future directions.The goal of this study was to perform a cross-sectional survey of mucosal CD8⫹ T-cell responses of individuals with chronic HIV-1 infection and a range of viral loads and CD4⫹T-cell counts in preparation for more-detailed longitudinal studies of specific patient subsets. The magnitude and complexity of CD8⫹T-cell responses are affected by sev-eral interrelated factors, most notably the presence of viral antigen and CD4⫹T-cell “help,” as well as signal strength and the local cytokine microenvironment (34). While CD8⫹T cells serve a beneficial role in clearing virally infected cells, in the case of HIV-1 infection the CD4⫹T cells being eliminated are also essential for immune function, and mucosal CD4⫹T-cell depletion is a hallmark of early infection. This depletion per-sists throughout chronic HIV-1 infection and is only slowly reversed in patients on ART (20).
Our findings can be interpreted to suggest that mucosal HIV-1-specific CD8⫹T-cell responses actively limit viral
on November 8, 2019 by guest
http://jvi.asm.org/
lication and dissemination during chronic infection. In our initial data set (Fig. 2), we detected a positive correlation between HIV Gag-specific response magnitude (in terms of the percentage of responding CD8⫹T cells) and CD4⫹T-cell count. In our second patient group (Fig. 3), although the re-lationship between the CD4⫹count and CD8⫹T-cell response magnitude was not preserved, we detected robust and complex HIV-1-specific CD8⫹T-cell responses in rectal mucosa. These responses included CD8⫹T cells capable of degranulation as well as cytokine release upon TCR stimulation. In addition, one elite LTNP mounted a remarkably high magnitude and polyfunctional HIV-1-specific CD8⫹T-cell response in rectal mucosa (Fig. 5).
Another interpretation of these findings is that the apparent relationship between CD8⫹ T-cell response magnitude and CD4⫹T-cell count indicates improved mucosal CD8⫹T-cell function when CD4⫹T-cell “help” is present (24, 62). Further-more, since LTNP have preserved CD4⫹T-cell populations in both blood and mucosa, the unusually strong and complex mucosal response detected for patient 50 might also be related to the persistence of CD4⫹T-cell help. The contrasting finding for patient 48 lends support to the idea that LTNP are heter-ogeneous and the phenomenon of nonprogression multifacto-rial. Accordingly, multiple factors, including host genetics, T-cell susceptibility to viral infection and replication, adaptive and innate immune responses, and viral phenotype, may all contribute to nonprogression. Additional studies with a much larger cohort of LTNP will be required in order to determine the contribution of each of these factors.
The observation that mucosal CD8⫹ T-cell responses de-cline in magnitude for patients on ART likely reflects the decline in the level of HIV-1 antigen, since such responses are believed to be antigen driven (47). Longitudinal studies, cur-rently in progress, will be required to determine the extent to which mucosal virus is cleared in patients on ART and the impact of CD4⫹T-cell reconstitution on the quality of CD8⫹ T-cell responses in the gut. Finally, recent work suggests that CD8⫹T cells expressing perforin and other cytotoxic effector molecules are present in the gut by 18 to 24 days postinfection in SIV-infected macaques and HIV-infected humans. Accord-ingly, these cells may contribute to the elimination of infected mucosal CD4⫹ T cells, thereby serving a dual role as both “friend and foe” (41, 48). Detailed studies of acute HIV/SIV infection should further elucidate the kinetics and mechanism of mucosal CD8⫹T-cell priming and CD4⫹T-cell depletion, respectively.
Future studies will be directed toward studying well-charac-terized patient cohorts in an effort to determine the relation-ship of particular T-cell functional groups with clinical status. It will also be important to establish the role of particular cytokines, costimulatory markers, and other factors unique to the mucosal microenvironment that serve to regulate the mem-ory/effector phenotype, trafficking patterns, and effector func-tions of mucosal CD8⫹T cells.
ACKNOWLEDGMENTS
This research was supported by NIH/NIAID R01-AI057020 and by the California Universitywide AIDS Research Program (UARP), grant CH05-D-606. This investigation was conducted in a facility con-structed with support from Research Facilities Improvement Program
grant number C06-RR-12088-01 from the National Center for Re-search Resources, National Institutes of Health.
We thank Jerome Braun, UC Davis Department of Statistics, for assistance with biostatistics and Megan Morris, UC Davis Department of Medical Microbiology and Immunology, for HLA typing. We also thank Mario Roederer, NIH VRC, for providing the SPICE software. We thank the staff of the AGIE Unit and the Gastroenterology Lab-oratory, UC Davis Medical Center, for assistance with sample collec-tion. We are indebted to our study volunteers for participation in this project.
REFERENCES
1.Addo, M. M., X. G. Yu, A. Rathod, D. Cohen, R. L. Eldridge, D. Strick, M. N. Johnston, C. Corcoran, A. G. Wurcel, C. A. Fitzpatrick, M. E. Feeney, W. R. Rodriguez, N. Basgoz, R. Draenert, D. R. Stone, C. Brander, P. J. Goulder, E. S. Rosenberg, M. Altfeld, and B. D. Walker.2003. Comprehensive epitope analysis of human immunodeficiency virus type 1 (HIV-1)-specific T-cell responses directed against the entire expressed HIV-1 genome demonstrate broadly directed responses, but no correlation to viral load. J. Virol.77:2081– 2092.
2.Anton, P. A., J. Elliot, M. A. Poles, I. M. McGowan, J. Matud, L. E. Hultin, K. Grovit-Ferbas, C. R. Mackay, I. S. Y. Chen, and J. V. Giorgi.2000. Enhanced levels of functional HIV-1 co-receptors on human mucosal T cells demonstrated using intestinal biopsy tissue. AIDS14:1761–1765. 3.Betts, M. R., D. R. Ambrozak, D. C. Douek, S. Bonhoeffer, J. M. Brenchley,
J. P. Casazza, R. A. Koup, and L. J. Picker.2001. Analysis of total human immunodeficiency virus (HIV)-specific CD4⫹and CD8⫹T-cell responses: relationship to viral load in untreated HIV infection. J. Virol.75:11983– 11991.
4.Betts, M. R., J. M. Brenchley, D. A. Price, S. C. De Rosa, D. C. Douek, M. Roederer, and R. A. Koup.2003. Sensitive and viable identification of antigen-specific CD8⫹T cells by a flow cytometric assay for degranulation. J. Immunol. Methods281:65–78.
5.Betts, M. R., and R. A. Koup.2004. Detection of T-cell degranulation: CD107a and b. Methods Cell Biol.75:497–512.
6.Betts, M. R., M. C. Nason, S. M. West, S. C. De Rosa, S. A. Migueles, J. Abraham, M. M. Lederman, J. M. Benito, P. A. Goepfert, M. Connors, M. Roederer, and R. A. Koup.2006. HIV nonprogressors preferentially main-tain highly functional HIV-specific CD8⫹T cells. Blood107:4781–4789. 7.Betts, M. R., D. A. Price, J. M. Brenchley, K. Lore, F. J. Guenaga, A.
Smed-Sorensen, D. R. Ambrozak, S. A. Migueles, M. Connors, M. Roederer, D. C. Douek, and R. A. Koup.2004. The functional profile of primary human antiviral CD8⫹T cell effector activity is dictated by cognate peptide concen-tration. J. Immunol.172:6407–6417.
8.Borrow, P., H. Lewicki, X. Wei, M. S. Horwitz, N. Peffer, H. Meyers, J. A. Nelson, J. E. Gairin, B. H. Hahn, M. B. Oldstone, and G. M. Shaw.1997. Antiviral pressure exerted by HIV-1-specific cytotoxic T lymphocytes (CTLs) during primary infection demonstrated by rapid selection of CTL escape virus. Nat. Med.3:205–211.
9.Brenchley, J. M., D. A. Price, and D. C. Douek.2006. HIV disease: fallout from a mucosal catastrophe? Nat. Immunol.7:235–239.
10.Brenchley, J. M., T. W. Schacker, L. E. Ruff, D. A. Price, J. H. Taylor, G. J. Beilman, P. L. Nguyen, A. Khoruts, M. Larson, A. T. Haase, and D. C. Douek.2004. CD4⫹T cell depletion during all stages of HIV disease occurs predominantly in the gastrointestinal tract. J. Exp. Med.200:749–759. 11.Carrington, M., and S. J. O’Brien.2003. The influence of HLA genotype on
AIDS. Annu. Rev. Med.54:535–551.
12.Clayton, F., G. Snow, S. Reka, and D. P. Kotler.1997. Selective depletion of rectal lamina propria rather than lymphoid aggregate CD4 lymphocytes in HIV infection. Clin. Exp. Immunol.107:288–292.
13.Cranston, R. D., P. A. Anton, and I. M. McGowan.2000. Gastrointestinal mucosal biopsy in HIV disease and AIDS. Gastrointest. Endosc. Clin. N. Am.10:637–667.
14.Donahoe, S. M., W. J. Moretto, R. V. Samuel, P. A. Marx, T. Hanke, R. I. Connor, and D. F. Nixon.2000. Direct measurement of CD8⫹T cell re-sponses in macaques infected with simian immunodeficiency virus. Virology 272:347–356.
15.Emu, B., E. Sinclair, D. Favre, W. J. Moretto, P. Hsue, R. Hoh, J. N. Martin, D. F. Nixon, J. M. McCune, and S. G. Deeks.2005. Phenotypic, functional, and kinetic parameters associated with apparent T-cell control of human immunodeficiency virus replication in individuals with and without antiret-roviral treatment. J. Virol.79:14169–14178.
16.Flores-Villanueva, P. O., E. J. Yunis, J. C. Delgado, E. Vittinghoff, S. Buchbinder, J. Y. Leung, A. M. Uglialoro, O. P. Clavijo, E. S. Rosenberg, S. A. Kalams, J. D. Braun, S. L. Boswell, B. D. Walker, and A. E. Goldfeld. 2001. Control of HIV-1 viremia and protection from AIDS are associated with HLA-Bw4 homozygosity. Proc. Natl. Acad. Sci. USA98:5140–5145. 17.Freeman, G. J., E. J. Wherry, R. Ahmed, and A. H. Sharpe.2006.
Reinvig-orating exhausted HIV-specific T cells via PD-1–PD-1 ligand blockade. J. Exp. Med.203:2223–2227.
18.Gray, C. M., J. Lawrence, J. M. Schapiro, J. D. Altman, M. A. Winters, M.
VOL. 81, 2007 MULTIFUNCTIONAL HIV-1-SPECIFIC CD8⫹ T CELLS IN THE GUT 5469
on November 8, 2019 by guest
http://jvi.asm.org/
Crompton, M. Loi, S. K. Kundu, M. M. Davis, and T. C. Merigan.1999. Frequency of class I HLA-restricted anti-HIV CD8⫹T cells in individuals receiving highly active antiretroviral therapy (HAART). J. Immunol.162: 1780–1788.
19.Guadalupe, M., E. Reay, S. Sankaran, T. Prindiville, J. Flamm, A. McNeil, and S. Dandekar.2003. Severe CD4⫹T-cell depletion in gut lymphoid tissue during primary human immunodeficiency virus type 1 infection and substan-tial delay in restoration following highly active antiretroviral therapy. J. Vi-rol.77:11708–11717.
20.Guadalupe, M., S. Sankaran, M. D. George, E. Reay, D. Verhoeven, B. L. Shacklett, J. Flamm, J. Wegelin, T. Prindiville, and S. Dandekar.2006. Viral suppression and immune restoration in the gastrointestinal mucosa of hu-man immunodeficiency virus type 1-infected patients initiating therapy dur-ing primary or chronic infection. J. Virol.80:8236–8247.
21.Haase, A. T.2005. Perils at mucosal front lines for HIV and SIV and their hosts. Nat. Rev. Immunol.5:783–792.
22.Herr, W., U. Protzer, A. W. Lohse, G. Gerken, K. H. Meyer zum Buschenfelde, and T. Wolfel.1998. Quantification of CD8⫹T lymphocytes responsive to human immunodeficiency virus (HIV) peptide antigens in HIV-infected patients and seronegative persons at high risk for recent HIV exposure. J. Infect. Dis.178:260–265.
23.Ibarrondo, F. J., P. A. Anton, M. Fuerst, H. L. Ng, J. T. Wong, J. Matud, J. Elliott, R. Shih, M. A. Hausner, C. Price, L. E. Hultin, P. M. Hultin, B. D. Jamieson, and O. O. Yang.2005. Parallel human immunodeficiency virus type 1-specific CD8⫹T-lymphocyte responses in blood and mucosa during chronic infection. J. Virol.79:4289–4297.
24.Janssen, E. M., N. M. Droin, E. E. Lemmens, M. J. Pinkoski, S. J. Bensinger, B. D. Ehst, T. S. Griffith, D. R. Green, and S. P. Schoenberger.2005. CD4⫹ T-cell help controls CD8⫹T-cell memory via TRAIL-mediated activation-induced cell death. Nature434:88–93.
25.Jassoy, C., T. Harrer, T. Rosenthal, B. A. Navia, J. Worth, R. P. Johnson, and B. D. Walker. 1993. Human immunodeficiency virus type 1-specific cytotoxic T lymphocytes release gamma interferon, tumor necrosis factor alpha (TNF-␣), and TNF-when they encounter their target antigens. J. Vi-rol.67:2844–2852.
26.Jin, X., D. E. Bauer, S. E. Tuttleton, S. Lewin, A. Gettie, J. Blanchard, C. E. Irwin, J. T. Safrit, J. Mittler, L. Weinberger, L. G. Kostrikis, L. Zhang, A. S. Perelson, and D. D. Ho.1999. Dramatic rise in plasma viremia after CD8⫹ T cell depletion in simian immunodeficiency virus-infected macaques. J. Exp. Med.189:991–998.
27.Kalams, S. A., P. J. Goulder, A. K. Shea, N. G. Jones, A. K. Trocha, G. S. Ogg, and B. D. Walker.1999. Levels of human immunodeficiency virus type 1-specific cytotoxic T-lymphocyte effector and memory responses decline after suppression of viremia with highly active antiretroviral therapy. J. Virol. 73:6721–6728.
28.Komanduri, K. V., M. N. Viswanathan, E. D. Wieder, D. K. Schmidt, B. M. Bredt, M. A. Jacobson, and J. M. McCune.1998. Restoration of cytomega-lovirus-specific CD4⫹T-lymphocyte responses after ganciclovir and highly active antiretroviral therapy in individuals infected with HIV-1. Nat. Med. 4:953–956.
29.Kondo, K., H. Kaneshima, and E. S. Mocarski.1994. Human cytomegalo-virus latent infection of granulocyte-macrophage progenitors. Proc. Natl. Acad. Sci. USA91:11879–11883.
30.Koup, R. A., J. T. Safrit, Y. Cao, C. A. Andrews, G. McLeod, W. Borkowsky, C. Farthing, and D. D. Ho.1994. Temporal association of cellular immune responses with the initial control of viremia in primary human immunode-ficiency virus type 1 syndrome. J. Virol.68:4650–4655.
31.Li, Q., L. Duan, J. D. Estes, Z. M. Ma, T. Rourke, Y. Wang, C. Reilly, J. Carlis, C. J. Miller, and A. T. Haase.2005. Peak SIV replication in resting memory CD4⫹T cells depletes gut lamina propria CD4⫹T cells. Nature 434:1148–1152.
32.Lichtenheld, M. G., E. R. Podack, and R. B. Levy.1995. Transgenic control of perforin gene expression. Functional evidence for two separate control regions. J. Immunol.154:2153–2163.
33.Lichterfeld, M., X. G. Yu, M. T. Waring, S. K. Mui, M. N. Johnston, D. Cohen, M. M. Addo, J. Zaunders, G. Alter, E. Pae, D. Strick, T. M. Allen, E. S. Rosenberg, B. D. Walker, and M. Altfeld.2004. HIV-1-specific cyto-toxicity is preferentially mediated by a subset of CD8⫹T cells producing both interferon-gamma and tumor necrosis factor-alpha. Blood104:487–494. 34.Masopust, D., S. M. Kaech, E. J. Wherry, and R. Ahmed.2004. The role of programming in memory T-cell development. Curr. Opin. Immunol.16:217– 225.
35.Masopust, D., V. Vezys, A. L. Marzo, and L. Lefrancois.2001. Preferential localization of effector memory cells in nonlymphoid tissue. Science291: 2413–2417.
36.Masopust, D., V. Vezys, E. J. Usherwood, L. S. Cauley, S. Olson, A. L. Marzo, R. L. Ward, D. L. Woodland, and L. Lefrancois.2004. Activated primary and memory CD8 T cells migrate to nonlymphoid tissues regardless of site of activation or tissue of origin. J. Immunol.172:4875–4882.
37.Masopust, D., V. Vezys, E. J. Wherry, D. L. Barber, and R. Ahmed.2006. Gut microenvironment promotes differentiation of a unique memory CD8 T cell population. J. Immunol.176:2079–2083.
38.Mattapallil, J. J., D. C. Douek, B. Hill, Y. Nishimura, M. Martin, and M. Roederer.2005. Massive infection and loss of memory CD4⫹T cells in multiple tissues during acute SIV infection. Nature434:1093–1097. 39.McGowan, I., J. Elliott, M. Fuerst, P. Taing, J. Boscardin, M. Poles, and P.
Anton.2004. Increased HIV-1 mucosal replication is associated with gener-alized mucosal cytokine activation. J. Acquir. Immune Defic. Syndr.37: 1228–1236.
40.Mehandru, S., M. A. Poles, K. Tenner-Racz, A. Horowitz, A. Hurley, C. Hogan, D. Boden, P. Racz, and M. Markowitz.2004. Primary HIV-1 infec-tion is associated with preferential depleinfec-tion of CD4⫹T lymphocytes from effector sites in the gastrointestinal tract. J. Exp. Med.200:761–770. 41.Mehandru, S., M. A. Poles, K. Tenner-Racz, V. Manuelli, P. Jean-Pierre, P.
Lopez, A. Shet, A. Low, H. Mohri, D. Boden, P. Racz, and M. Markowitz. 2007. Mechanisms of gastrointestinal CD4⫹T-cell depletion during acute and early human immunodeficiency virus type 1 infection. J. Virol.81:599– 612.
42.Migueles, S. A., M. S. Sabbaghian, W. L. Shupert, M. P. Bettinotti, F. M. Marincola, L. Martino, C. W. Hallahan, S. M. Selig, D. Schwartz, J. Sullivan, and M. Connors.2000. HLA B*5701 is highly associated with restriction of virus replication in a subgroup of HIV-infected long term nonprogressors. Proc. Natl. Acad. Sci. USA97:2709–2714.
43.Mowat, A., and J. Viney.1997. The anatomical basis of intestinal immunity. Immunol. Rev.156:145–166.
44.Musey, L., Y. Ding, J. Cao, J. Lee, C. Galloway, A. Yuen, K. R. Jerome, and M. J. McElrath.2003. Ontogeny and specificity of mucosal and blood human immunodeficiency virus type 1-specific CD8⫹cytotoxic T lymphocytes. J. Vi-rol.77:291–300.
45.O’Connor, D. H., T. M. Allen, T. U. Vogel, P. Jing, I. P. DeSouza, E. Dodds, E. J. Dunphy, C. Melsaether, B. Mothe, H. Yamamoto, H. Horton, N. Wilson, A. L. Hughes, and D. I. Watkins.2002. Acute phase cytotoxic T lymphocyte escape is a hallmark of simian immunodeficiency virus infection. Nat. Med. 8:493–499.
46.Ogg, G. S., X. Jin, S. Bonhoeffer, P. R. Dunbar, M. A. Nowak, S. Monard, J. P. Segal, Y. Cao, S. L. Rowland-Jones, V. Cerundolo, A. Hurley, M. Markowitz, D. D. Ho, D. F. Nixon, and A. J. McMichael.1998. Quantitation of HIV-1-specific cytotoxic T lymphocytes and plasma load of viral RNA. Science279:2103–2106.
47.Ogg, G. S., X. Jin, S. Bonhoeffer, P. Moss, M. A. Nowak, S. Monard, J. P. Segal, Y. Cao, S. L. Rowland-Jones, A. Hurley, M. Markowitz, D. D. Ho, A. J. McMichael, and D. F. Nixon.1999. Decay kinetics of human immunodefi-ciency virus-specific effector cytotoxic T lymphocytes after combination an-tiretroviral therapy. J. Virol.73:797–800.
48.Quigley, M. F., K. Abel, B. Zuber, C. J. Miller, J. K. Sandberg, and B. L. Shacklett.2006. Perforin expression in the gastrointestinal mucosa is limited to acute simian immunodeficiency virus infection. J. Virol.80:3083–3087. 49.Reynolds, M. R., E. Rakasz, P. J. Skinner, C. White, K. Abel, Z. M. Ma, L.
Compton, G. Napoe, N. Wilson, C. J. Miller, A. Haase, and D. I. Watkins. 2005. CD8⫹T-lymphocyte response to major immunodominant epitopes after vaginal exposure to simian immunodeficiency virus: too late and too little. J. Virol.79:9228–9235.
50.Rubio, V., T. B. Stuge, N. Singh, M. R. Betts, J. S. Weber, M. Roederer, and P. P. Lee.2003. Ex vivo identification, isolation and analysis of tumor-cytolytic T cells. Nat. Med.9:1377–1382.
51.Sandberg, J. K., N. M. Fast, and D. F. Nixon.2001. Functional heterogeneity of cytokines and cytolytic effector molecules in human CD8⫹T lymphocytes. J. Immunol.167:181–187.
52.Shacklett, B. L., T. J. Beadle, P. A. Pacheco, J. H. Grendell, P. A. Haslett, A. S. King, G. S. Ogg, P. M. Basuk, and D. F. Nixon.2000. Characterization of HIV-1-specific cytotoxic T lymphocytes expressing the mucosal lympho-cyte integrin CD103 in rectal and duodenal lymphoid tissue of HIV-1-infected subjects. Virology270:317–327.
53.Shacklett, B. L., C. A. Cox, M. F. Quigley, C. Kreis, N. H. Stollman, M. A. Jacobson, J. Andersson, J. K. Sandberg, and D. F. Nixon.2004. Abundant expression of granzyme A, but not perforin, in granules of CD8⫹T cells in GALT: implications for immune control of HIV-1 infection. J. Immunol. 173:641–648.
54.Shacklett, B. L., C. A. Cox, J. K. Sandberg, N. H. Stollman, M. A. Jacobson, and D. F. Nixon.2003. Trafficking of human immunodeficiency virus type 1-specific CD8⫹T cells to gut-associated lymphoid tissue during chronic infection. J. Virol.77:5621–5631.
55.Shacklett, B. L., O. Yang, M. A. Hausner, J. Elliott, L. Hultin, C. Price, M. Fuerst, J. Matud, P. Hultin, C. Cox, J. Ibarrondo, J. T. Wong, D. F. Nixon, P. A. Anton, and B. D. Jamieson.2003. Optimization of methods to assess human mucosal T-cell responses to HIV infection. J. Immunol. Methods 279:17–31.
56.Shankar, P., Z. Xu, and J. Lieberman.1999. Viral-specific cytotoxic T lym-phocytes lyse human immunodeficiency virus-infected primary T lympho-cytes by the granule exocytosis pathway. Blood94:3084–3093.
57.Smit-McBride, Z., J. J. Mattapallil, M. McChesney, D. Ferrick, and S. Dandekar.1998. Gastrointestinal T lymphocytes retain high potential for cytokine responses but have severe CD4⫹T-cell depletion at all stages of
on November 8, 2019 by guest
http://jvi.asm.org/
simian immunodeficiency virus infection compared to peripheral lympho-cytes. J. Virol.72:6646–6656.
58.Suni, M. A., S. A. Ghanekar, D. W. Houck, H. T. Maecker, S. B. Wormsley, L. J. Picker, R. B. Moss, and V. C. Maino.2001. CD4⫹CD8dimT
lympho-cytes exhibit enhanced cytokine expression, proliferation and cytotoxic ac-tivity in response to HCMV and HIV-1 antigens. Eur. J. Immunol.31:2512– 2520.
59.Veazey, R. S., M. DeMaria, L. V. Chalifoux, D. E. Shvetz, D. R. Pauley, H. L. Knight, M. Rosenzweig, R. P. Johnson, R. C. Desrosiers, and A. A. Lackner. 1998. Gastrointestinal tract as a major site of CD4⫹T cell depletion and viral replication in SIV infection. Science280:427–431.
60.Veazey, R. S., I. C. Tham, K. G. Mansfield, M. DeMaria, A. E. Forand, D. E. Shvetz, L. V. Chalifoux, P. K. Sehgal, and A. A. Lackner.2000. Identifying
the target cell in primary simian immunodeficiency virus (SIV) infection: highly activated memory CD4⫹T cells are rapidly eliminated in early SIV infection in vivo. J. Virol.74:57–64.
61.Wang, H. C., Q. Zhou, J. Dragoo, and J. R. Klein.2002. Most murine CD8⫹ intestinal intraepithelial lymphocytes are partially but not fully activated T cells. J. Immunol.169:4717–4722.
62.Zajac, A. J., J. N. Blattman, K. Murali-Krishna, D. J. Sourdive, M. Suresh, J. D. Altman, and R. Ahmed.1998. Viral immune evasion due to persistence of activated T cells without effector function. J. Exp. Med.188:2205–2213. 63.Zhang, J., I. Scordi, M. J. Smyth, and M. G. Lichtenheld.1999. Interleukin
2 receptor signaling regulates the perforin gene through signal transducer and activator of transcription (Stat)5 activation of two enhancers. J. Exp. Med.190:1297–1308.
VOL. 81, 2007 MULTIFUNCTIONAL HIV-1-SPECIFIC CD8⫹ T CELLS IN THE GUT 5471