COMMISSION OF THE EUROPEAN COMMUNITIES
Commission staff working document
PROGRESS TOWARDS
THE LISBON OBJECTIVES
IN EDUCATION AND TRAINING
Indicators and benchmarks
2009
2
Report prepared by :
DG Education and Culture, Unit A4 (Analysis and studies)
Coordination : Anders Hingel, Head of unit
Oyvind Bjerkestrand Richard Deiss Lars Bo Jakobsen Margot Kuzma Cristina Marcone Maria Pia Sorvillo
Mikaël Le Bourhis Vera Ratsiborynska
Joint Research Centre, Centre for Research on Lifelong Learning (CRELL)
Andrea Saltelli, Head of unit Michela Nardo
Elena Arjona Perez Mircea Badescu Marcella Deluca Béatrice D'Hombres Kornelia Kozovska Anna Rita Manca Fritz Scheuermann Ernesto Villalba
Eurostat
Jean-Louis Mercy, Head of unit Lene Mejer, acting Head of Unit
Marta Beck-Domzalska Erice Gere
Reigo Hirmo Sylvain Jouhette Agnieszka Litwinska Fernando Reis
DG Education and Culture, EAC-Executive Agency, Unit P9 (Eurydice)
David Hughes, Head of unit Arlette Delhaxhe
Stanislav Ranguelov
European Agency for development in special needs education
Preface
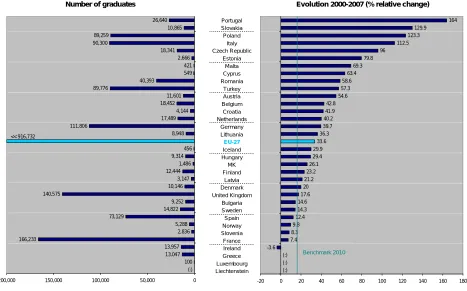
“Progress towards the Lisbon objectives in education and training” is the 6th annual report examining performance and progress under the Education and Training 2010 Work Programme.
The purpose of this report is to inform and provide strategic guidance for education policy co-operation at European level. The report sets out progress towards the objectives agreed by the Council. It provides an
evidence-base of indicators, benchmarks and research results which supports theEducation and Training
2010 work programme launched in 2001 and its follow-up, the strategic framework for European cooperation in education and training adopted by the Council in May 2009. The Progress Reports for 2004, 2005, 2006, 2007 and 2008 were able to give detailed analysis of performance and progress as data and research material became available.
On 25th May 2007 the Education Council adopted conclusions on a coherent framework of 16 core
indicators for monitoring progress towards the Lisbon objectives in education and training (European Council, 2007a). The 2007, 2008 and 2009 Reports have used this tool of core indicators.
Reflecting the strategic framework for European cooperation in education and training adopted by the Council in May 2009, the report is structured in four chapters in the line with the four strategic objectives of the framework, as follows:
1. Making lifelong learning and mobility a reality;
2. Improving the quality and efficiency of education and training; 3. Promoting equity, social cohesion and active citizenship;
4. Enhancing creativity and innovation, including entrepreneurship, at all levels of education and training.
The Report analyses performance and progress of education systems in EU member states (27), candidate countries (3) and associated countries (3) and how they contribute towards meeting Europe's Lisbon objectives.
World reference levels of performance are found within some areas of education and training in Europe. At
the same time, many Member States are challenged in particular fields. The report demonstrates that
4
Content list
Ten main messages of the report Page 11
Introduction Page 13
1. Introduction
2. Conclusions on progress towards the European benchmarks 2010
2.1. Country performance and progress in the areas of European benchmarks 2.2. Best performing countries: learning from good practice
2.3. Performance of European educational systems in a worldwide perspective 2.4. Trends towards the 2020 benchmarks
3. Demographical trends in Europe
3.1. Current trends in number of young people 3.2. Future intake of pupils in schools
3.3. Overall population trends
4. Investment in Education
4.1. Levels of investment in education and training 4.2. National priorities for investment in education
Chapter I Making lifelong learning and mobility a reality Page 31
Main messages
1. Participation in Lifelong learning
1.1. An aggregate measure on participation in lifelong learning in Europe
2. Student Mobility in Education
2.1. Mobility of higher education students 2.2. European student mobility programmes
Chapter II Improving the quality and efficiency of education and training Page 43
Main messages
1. School education
1.1. Completion of upper secondary education 1.2. Teachers and professional development
2. Vocational Education and Training
2.1. Participation in vocational education and training 2.2. Investment in VET
2.3. Third country comparisons
2.4. Individual outcomes of vocational education and training
3. Higher Education
3.1. The Bologna process in higher education 3.2. Current international university rankings 3.3. Graduates in higher education
3.4. Higher education attainment of the population
4. Labour Market Outcomes
4.1. Educational attainment of the adult population
Chapter III Promoting equity, social cohesion and active citizenship Page 71
Main messages
1. Equity
1.1. Early childhood education
1.2. Early leavers from education and training 1.3. Special education needs
1.4. Adult education and training
2. Key competences
2.1. Reading, mathematics and science literacy 2.2. Language skills: learning and teaching 2.3. ICT skills for young and adults
2.4. Active citizenship
3. Migrants
3.1. Special education needs and the issue of language 3.2. Key competences
3.3. Early leavers from education and training 3.4. Adult participation in lifelong learning
4. Gender inequalities
4.1. Differentials in schooling 4.2. Educational choices
Chapter IV Enhancing creativity and Innovation, including entrepreneurship at
all levels of education and training Page 99
Main messages
1. Creativity and innovation
1.1. Innovation and creativity of nations and regions 1.2. Measuring creativity skills and competences
2. Graduates in Mathematics, Science and Technology
2.1. Evolution of the number of MST students 2.2. Evolution of the number of MST graduates
2.3. Growth in number of graduates by field and educational levels 2.4. The growth in number of MST graduates by type of programme 2.5. MST graduates and researchers on the labour market
3. Entrepreneurship
Annexes Page 109
Annex 1: Standing Group on Indicators and Benchmarks
Annex 2: List of abbreviations
Annex 3: Bibliography
Annex 4: Statistical annex
Annex 5: Country tables
6
List of tables and charts
Introduction
Chart Int.2.1: Progress towards meeting the five benchmarks for 2010 (2000-2008) ... 15
Chart Int.2.2: Benchmark 2010: Low Performers in reading literacy (2000-2006)... 16
Chart Int.2.3: Benchmark 2010: Upper Secondary Attainment (2000-2008)... 17
Chart Int.2.4: Benchmark 2010: Early leavers from education and training (2000-2008) ...18
Chart Int.2.5: Benchmark 2010: Mathematics, Science and Technology Graduates (2000-2007)... 19
Chart Int.2.6: Benchmark 2010: Adult Lifelong Learning participation...20
Table Int.2.1: Best performing countries on benchmark relating to school education ... 21
Table Int.2.2: Best performing countries on benchmarks relating to higher education and lifelong learning... 21
Chart Int.2.7: EU Education performance in a Worldwide perspective - UN education index ... 22
Chart Int.2.8: EU Education average performance level in a neighbouring countries perspective ... 22
Chart Int.2.9: Trends towards the five benchmarks for 2020 (2000-2008)... 23
Chart Int.3.1: Variation of the population in the 0-9, 10-19 and 20-29 age groups in the EU-27 (1985-2007) ... 24
Table Int.3.1: EU population in millions... 25
Chart Int.4.1: Public investment on education as a percentage of GDP... 26
Chart Int.4.2: Public investment on education as a percentage of GDP in European countries (2006p) ... 26
Chart Int.4.3: Changes in the public and private investments in education in European countries (2000 -2006)....27
Table Int.4.1: Public investment on tertiary education as a percentage of GDP ... 28
Table Int.4.2: Private and total investment on tertiary education as a percentage of GDP ...28
Chart Int.4.4: Public investment on tertiary education as a percentage of GDP ... 29
Chart Int.4.5: Public investment and participation in primary and secondary education (2006) ... 29
Chapter I Making lifelong learning and mobility a reality Chart I.1.1: Participation of adults in lifelong learning in European countries ... 35
Chart I.1.2: An aggregate measure of participation in lifelong learning in European countries ... 36
Table I.2.1: Foreign tertiary students as % of all tertiary students (ISCED levels 5 and 6) enrolled in the country (2000-2007)... 38
Table I.2.2: Main countries of origin of non-national students in the EU... 38
Table I.2.3: Percentage of all tertiary students (ISCED levels 5 and 6) enrolled outside their country of origin...39
Chart I.2.1: Outward mobility of Erasmus students, 2007/08 (students sent per 1000 students) ... 39
Chart I.2.2: Mobility of students in the Erasmus programme... 40
Table I.2.4: Mobility of Erasmus students, 2007/08 ... 40
Chapter II Improving the quality and efficiency of education and training Chart II.1.1: Population aged 20-24 having completed at least upper-secondary education, 2000-2008 ... 46
Chart II.1.2: Percentage of young people aged 20-24 in EU 27 with at least upper secondary attainment, 2000-2008... 46
Table II.1.1: Share of female teachers, 2007...47
Table II.1.2: Age distribution of teachers, 2007 ...48
Chart II.1.3: Share of teachers (ISCED 1-3) 50 years and older, 2000-2007... 48
Table II.1.4: Percentage of 15 year old students in schools where the principal reports instruction hindered by
lack of qualified teachers by subject ... 49
Chart II.1.4: Participation rates for type of professional development activity (2007-08) ... 50
Chart II.1.5: Percentage of teachers who undertook some professional development in the previous 18 months (2007-08) ... 50
Chart II.1.6: Areas of greatest development need of teachers (2007-08)... 51
Chart II.2.1: An aggregate measure of participation in vocational education and training in European countries (2005 p)... 52
Chart II.2.2: Participation patterns in initial VET in EU countries ... 53
Chart II.2.3: Participation in continuing vocational training and average hours spent on CVT per employee in EU countries. 2005 ... 54
Chart II.2.4: Participation in job-related/non job-related education and training (%), age 25-64, 2007... 55
Chart II.2.5: Total public spending on secondary education – pre-/ vocational/vocational programs in % of GDP, 2005 ... 55
Chart II.3.1: Bologna scorecards 2009, Cumulative scores for degree system, quality, recognition ... 57
Chart II.3.2: Universities in Shanghai Top 500 list (2009) per 100 000 tertiary students ... 58
Chart II.3.3: Tertiary students (2000-2007) ... 59
Table II.3.1: Tertiary students (2000-2007) ... 60
Table II.3.2: Tertiary graduates (2000-2007) ...60
Table II.3.3: Tertiary graduates in Third countries ... 61
Table II.3.4: Tertiary graduates by ISCED level, 2000-2007 ... 61
Chart II.3.4: Share of 30-34 year olds with tertiary attainment, 2000-08 ... 62
Chart II.3.5: Tertiary attainment of 30-34 year olds, 2000-2007 ... 62
Table II.4.1: Educational attainment (2000-2008) (25-64 year olds) ...63
Chart II.4.1: High education attainment of the adult population aged 25-64 in %... 64
Table II.4.2: High educational attainment of 25-64 year olds (in %)...64
Table II.4.3: Educational attainment (EU-27) 2008 (in %) ... 65
Table II.4.4: Educational attainment of men and women (2000-2008) (25-64 year olds) ...65
Chart II.4.2: Generational differences in the share of men and women with high educational attainment, 2008 ...65
Chart II.4.3: Employment rates and educational attainment, in % (2008)... 66
Table II.4.5: Educational attainment and employment rates (2000-2008) ... 66
Chart II.4.4: Economic and Employment Growth EU 27 ... 67
Chart II.4.5: Unemployment rates (%) by highest level of education attained and gender 15-64 years old, EU 27 ...67
Table II.4.6: Temporary employees, as percentage of the total number of employees for a given educational attainment and age group, EU-27 (2008) ... 68
Chart II.4.6: Projected working-age population and total employment, EU27... 69
Chart II.4.7: Past and anticipated employment shares by education attainment level... 69
Chapter III Promoting equity, social cohesion and active citizenship Chart III.1.1: Participation in early childhood education (rates)... 74
Chart III.1.2: Ratio of pupils to teachers in pre-primary school (ISCED 0)... 75
Chart III.1.3: Early leavers from education and training, 2000 and 2008 (rates) ... 76
Chart III.1.4: Early leavers from education and training by highest educational level achieved, 2008 (%) ... 77
Table III.1.1: Early leavers from education and training by employment status, 2008 (Percentage) ... 78
8
Chart III.1.6: Pupils with special education needs by category of need and type of setting, 2005 (percentage
distribution) ... 81
Table III.1.2: Participation in adult learning by age, 2007 (rates) ... 82
Table III.1.3: Participation in adult learning by educational attainment and labour status, 2007 (rates) ... 82
Chart III.1.7: Reasons for participating in non-formal education and training, 2007... 83
Chart III.1.8: Obstacles to participation in non-formal education and training, 2007 ... 84
Chart III.2.1: Low achievers in reading, 2000-2006 (PISA reading literacy scale)... 85
Chart III.2.2: Low achievers in mathematics, science and reading, 2006 – Benchmark 2020 ... 87
Chart III.2.3: Percentage of pupils learning at least two foreign languages in EU 2000-2007. ... 89
Chart III.2.4: Average number of foreign languages learned per pupil at ISCED level 2 General, 2000-2007... 89
Chart III.2.5: Average number of foreign languages learned per pupil in EU 2000-2007 ...90
Chart III.2.6: Proportion of pupils learning English, French, German and Spanish at ISCED level 2 in the EU (2000-2007) ... 91
Chart III.2.7: Measuring Active Citizenship working model... 92
Table III.2.1: Development of Voting, Membership in political parties and Protest and Social change in 13 European countries. 2002, 2004 and 2006. ... 93
Chart III.3.1: Migrants and languages ... 94
Chart III.3.2: Early leavers from education and training by migrant status, 2008 (rates) ... 95
Chart III.3.3: Adult participation in lifelong learning by migrant status, 2008 (rates)... 95
Chart III.4.1: Early leavers from education and training by gender, 2008 (rates) ... 96
Table III.4.1: Female graduates by field, 2000-2007, ISCED 5-6 (Percentage) ... 97
Table III.4.2: Females as a proportion of all MST graduates (ISCED 5 and 6) ... 97
Chapter IV Enhancing creativity and Innovation, including entrepreneurship at all levels of education and training Chart IV.1.1: Convergence in innovation performance... 102
Chart IV.1.2: Core Creative Class employment – national level ... 103
Chart IV.2.1: Researchers per thousand total employment, 2000 and 2006 ... 104
Table IV.2.1: Number of MST students (ISCED level 5A, 5B and 6), 2000-2007 ... 104
Chart IV.2.2: Number of graduates in Mathematics, Science and Technology (ISCED 5 and 6), 2000-2007... 105
Chart IV.2.3: Total number of graduates in Mathematics, Science and Technology – international comparison of trends 2000-2007 ... 105
Table IV.2.2: Number of graduates by field (EU 27) ... 106
Table IV.2.3: Growth in the number of MST graduates by type of programme... 106
Chart IV.2.4: Trend in the number of researchers... 107
Table IV.2.4: Number of Researchers... 107
Chart IV.3.1: Framework for indicators on entrepreneurship ... 108
Chart IV.3.2: Density of enterprise "birth rate"... 108
Annexes Table Ann. Int. 1: EU Education average performance level in a neighbouring countries perspective ... 133
Chart Ann. Int. 2a: Projected population changes for the 5-9 age group between 2000 and 2010, and between 2010 and 2020... 134
Table Ann. Int. 3: Public and private investment on education as a percentage of GDP in European countries.. 135
Table Ann. Int. 4: Total public investment on education as a percentage of GDP in European countries ... 135
Table Ann. Int. 5: Private investment on educational institutions as a percentage of GDP in European countries... 136
Table Ann. Int. 6: Public investment by levels of education as a percentage of GDP in European countries ... 136
Table Ann. Int. 7: Investment per student by levels of education in European countries... 137
Table Ann. I.1: Expected years in education and training in European countries ... 138
Table Ann. I.2: Participation in education in European countries... 139
Table Ann.I.3: Participation of older workers in lifelong learning in European countries ... 140
Table Ann. I.4: Participation of adults in lifelong learning in European countries ... 141
Table Ann. I.5: Enrolment in school education in European countries ... 141
Table Ann. I.6: Participation in school education in European countries... 142
Table Ann. I.7: Participation in lifelong learning of adults in European countries... 142
Table Ann. I.8: Number of participants - Leonardo da Vinci – Mobility... 143
Table Ann. I.9: Number of participants: Comenius related mobility (2006)... 144
Table Ann. II.1a: Teachers as a % of active population and share of part -time teachers (2007) ... 145
Table Ann. II.1b: Teachers who wanted to participate in more development than they did in the previous 18 months (2007-08) - teacher characteristics ... 145
Table Ann. II.1c: Impact of different types of professional development undertaken by teachers upon their development as a teacher (2007-08) ... 146
Table Ann. II.2: Participation in vocational education and training in European countries (2005)... 146
Table Ann. II.3: Participation in continuing vocational training and average hours spent on CVT per employee in EU countries, 2005 ... 147
Table Ann. II.4: Total cost of CVT courses per employee in EU countries. 1999 and 2005... 148
Table Ann. II.5: Weights used in the ARWU rankings... 148
Table Ann. II.6: Times Higher Education Supplement Rankings (WUR), 2009... 149
Table Ann. II.7: Ranking of world universities by broad subject fields (ARWU), 2009... 149
Table Ann. II.8: Bologna Stocktaking: Degrees ... 150
Table Ann. II.9: Bologna Stocktaking: Recognition ... 151
Table Ann. II.10: Educational attainment of the adult population aged 25-64 in % ... 152
Table Ann. II.11: Number of persons in employment aged 15-64 annual percentage change... 153
Table Ann. II.12: Number of persons in employment by highest level of education attained (15-64 years old) ... 153
Table Ann. II.13: Unemployment rates (%), by highest level of education attained (15-64 years old) (d)... 154
Table Ann. II.14: Unemployment rates, by highest level of education attained and age groups EU-27 (d) ... 154
Table Ann. II.15: Unemployment rates, by highest level of education attained and age groups, 2008 (d) ... 155
Table Ann. II.16: Activity rates, by highest level of education attained and age groups (15-64) EU-27 (d)... 155
Table Ann. III.1: Participation in early childhood education ... 156
Table Ann. III.2: Ratio of pupils to teachers in pre-primary school (ISCED 0) ... 157
Table Ann. III.3: Reason for participating in non-formal education and training by country, 2007 (%) ... 158
Table Ann. III.4: Share of low achievers in reading, mathematics and science 2000, 2003 and 2006. ... 159
Table Ann. III.5: Average number of foreign languages learned per pupil in general lower and upper secondary education, and in pre-/vocational programmes in upper secondary education 2007... 160
Table Ann. III.6: Proportion of pupils learning English, French, German and Spanish in lower and upper general secondary education in 2007 (% of total no. of pupils at the level)... 161
Table Ann. III.7: Individuals' level of computer skills ... 162
10
Table Ann. IV.1: Indicators for the EIS 2008-2010... 164
Table Ann. IV.2: Innovation performance (2008 Summary Innovation Index SII) ... 164
Table Ann. IV.3: European Creativity Index ... 165
Table Ann. IV.4: Creative Class classification ... 166
Table Ann. IV.6: Graduates in MST ... 167
Table Ann. IV.7: Life science graduates (field 42) 2000-2007 ... 168
Table Ann. IV.8: Physical science graduates (field 44) 2000-2007 ... 169
Table Ann. IV.9: Mathematics and statistics graduates (field 46) 2000-2007 ... 170
Table Ann. IV.10: Computing graduates (field 48) 2000-2007... 171
TEN MAIN MESSAGES OF THE REPORT (2009)
1. Since 2000, educational performance has improved considerably in most areas
identified by European Education ministers as central for achieving the Lisbon goal. However, the 2010 benchmarks for education and training set by the Council are not likely to be achieved, apart from the benchmark on increasing the number of math,
science and technology graduates.
2. Young people stay still longer in education. Expected time in education for young people
is increasing in all countries. In Finland the average is now more than 20 years. The present economic crisis could reinforce this trend.
3. The share of low achievers in reading literacy among pupils in secondary education in
the EU is increasing. From 2000 to 2006 the proportion of low performers in reading
literacy aged 15 increased from 21.3% to 24.1%. This should be seen against a benchmark
for 2010 which anticipates a significant reduction of 20%.
4. Participation in lifelong learning is becoming a realityfor the majority of people in a
number of European countries (DK, SE, IS, followed by FI, UK and NL) - and progress can
be observed in almost all countries (4-64 years olds).
5. Educational attainment levels of the adult population have improved considerably
since 2000 – One out of four of the adult population in the EU have high educational
attainment, but this is far behind the performance of both the US and Japan (40%). Only Finland and Norway have high education attainment rates above 35%. Moreover, the number of people with low educational attainment has fallen by approximately 1.5 million per
year since 2000. Nevertheless, it still accounts for 77 million adults or close to 30 %.
6. While there has been an increase in investment per student in higher education in
almost all countries since 2000, the EU member states would need to invest on
average over 10 000 euro more per student per year in higher education to reach the
levels of the US (almost 200 billion euro more a year). The difference is mainly due to
very high levels of private investment in higher education institutions in the US.
7. More than half a million EU students study abroad, an increase of about 50% since
2000. Three out of four of these study in another EU country.
8. Professional development is a feature of the lives of the vast majority of teachers.
Nine out of ten teachers take part in professional development and more than half
demands more professional development than they received. The areas for which
teachers express greatest need for development are: “Teaching special learning needs students”, “ICT teaching skills” and “Student discipline and behaviour”. This should be seen
in the context of an ageing teaching profession where one third of the 6 million
teachers in the EU are over 50. Women count for 70% of the teacher profession.
9. Early teaching of foreign language is advancing in Europe. In lower secondary
education, earlier teaching of English is becoming widespread. Moreover, the number of foreign languages taught per pupil in upper secondary school education has progressed since 2000 (from 1.2 to 1.6).
10. The three Nordic countries (SE, FI, DK), Germany, and the UK are the highest
innovation performers as measured by the European Innovation Scoreboard. A strong concentration of the “creative class” with high educational attainment in and
around capital cities contributes to the performance. A process of convergence of
Introduction
1. Introduction
2. Conclusions on progress towards the European benchmarks 2010
2.1 Country performance and progress in the areas of European benchmarks 2.2 Best performing countries: Learning from good practice
2.3Performance of European educational systems in a worldwide perspective
2.4 Trends towards the 2020 benchmarks
3. Demographical trends in Europe
3.1 Current trends in number of young people 3.2 Future intake of pupils in schools
3.3 Overall population trends
4. Investment in Education
14
1. Introduction
Education and training have an important place in the Lisbon strategy for jobs and growth. As part of this overall strategy, the Council set out broad common objectives for the education and training
systems of the EU. This has been done through the
Education and Training 2010 work programme
launched in 2001 and its follow-up, the strategic
framework for European cooperation in education and training (ET 2020) adopted by the Council in
May 20091. Member States are supported in
achieving these objectives through the open method of coordination, which uses indicators and benchmarks to inform evidence-based policy making and to monitor progress.
The Council in May 2007 identified a framework of 16 core indicators for monitoring progress towards the Lisbon objectives.
Sixteen core indicators for monitoring progress towards the Lisbon objectives
§ Participation in pre-school education
§ Special needs education
§ Early school leavers
§ Literacy in reading, mathematics and
science
§ Language skills
§ ICT skills
§ Civic skills
§ Learning to learn skills
§ Upper secondary completion rates of
young people
§ Professional development of teachers and
trainers
§ Higher education graduates
§ Cross-national mobility of students in
higher education
§ Participation of adults in lifelong learning
§ Adult skills
§ Educational attainment of the population
§ Investment in education and training
These indicators enable the Commission and the Member States to:
• underpin key policy messages;
• analyse progress both at the EU and
national levels;
• identify good performance for peer review
and exchange; and
• compare performance with third countries.
The core indicators cover the whole learning continuum from pre-school to adult education, teachers' professional development and investment in education and training. Not all the data for these indicators are fully available yet. In almost all these areas, new surveys are being prepared or presently carried out.
Indicators never tell the full story. But they help to identify differences, similarities and trends and to provide a starting point for further analysis in order to understand better performance and progress.
In order to guide progress on achieving the objectives set for education and training systems of the EU, the Council adopted in May 2003 five
benchmarks to be achieved by 20102 and in May
2009, five benchmarks for 20203 .
Five EU benchmarks for 2010
§ No more than 10% early school leavers;
§ Decrease of at least 20% in the
percentage of low-achieving pupils in reading literacy;
§ At least 85% of young people should have
completed upper secondary education;
§ Increase of at least 15% in the number of
tertiary graduates in Mathematics, Science and Technology (MST), with a simultaneous decrease in the gender imbalance;
§ 12.5% of the adult population should
participate in lifelong learning.
Five EU benchmarks for 2020
§ at least 95% of children between 4 years
old and the age for starting compulsory primary education should participate in early childhood education
§ the share of early leavers from education
and training should be less than 10%
§ the share of low-achieving 15-years olds
in reading, mathematics and science should be less than 15%.
§ the share of 30-34 year olds with tertiary
educational attainment should be at least 40%
§ an average of at least 15 % of adults
2. Conclusions on progress towards the
European benchmarks for 2010
Education and training systems in the EU are generally improving. The EU benchmark on mathematics, science and technology graduates was already reached before 2005. In the period 2000-2007 growth in the number of new maths, science and technology graduates was more than twice the level needed to meet the benchmark.
Although there was broad progress of performance, the benchmarks on early school leaving, completion of upper secondary education and lifelong learning are with the current trends not likely to be reached by 2010. Attaining these benchmarks will in many countries demand more effective national initiatives. In the period 2000-2006 performance even deteriorated for reading literacy of young people.
Chart Int.2.1: Progress towards meeting the five benchmarks for 2010 (2000-2008)
Progress towards meeting the 5 benchmarks (EU average)
-80 -70 -60 -50 -40 -30 -20 -10 0 10 20 30 40 50 60 70 80 90 100 110 120 130 140 150 160 170 180 190 200 210 220
2000 2001 2002 2003 2004 2005 2006 2007 2008 2009 2010
Year
2010 benchmarks = 100
MST graduates
Adult lifelong learning participation
Early school leavers
Upper secondary
Low achievers in reading progress required
(above 0 = performance improving, below: worsening)
224
Source: European Commission DG Education and Culture
In this chart the starting point (in 2000) is set at zero and the 2020 benchmark at 100. The results achieved each year are measured against the 2020 benchmark (= 100). The diagonal line shows the progress required, i.e. an additional 1/20 (5%) of progress towards the benchmark has to be achieved each year to reach the benchmark. If a line stays below this diagonal line, progress is not sufficient; if it is above the diagonal line progress is stronger than what is needed to achieve the benchmark. If the line declines, the problem is getting worse.
16
2.1. Country performance and progress in the areas of European benchmarks.
A more detailed analysis of the benchmark areas is provided in Charts Int.2.2 to 2.6 looking into the question on national performance and progress within each of the five benchmark areas for 2010. In the case of the benchmark on low performers in reading literacy (the rate to be reduced by at least 20% by 2010, Chart Int.2.2).), one observes
that most countries are above that level, and have a higher rate of low achievers among young people than targeted This is however not the case of Ireland, and especially Finland which have a very high performance in the field. Poland, Denmark, Sweden and the Netherlands have performance levels near, but below, the 2010 benchmark. Sweden and especially the Netherlands have not progressed further between 2000 and 2006.
Chart Int. 2.2
Benchmark 2010: Low Performers in reading literacy (2000-2006)
Low performers in reading literacy
ES BE
BG
CZ
DK DE
IE
EL
FR IT
LV
LU HU
NL AT
PL
PT
RO
SK
FI
SE TR
NO EU19
-15 -10 -5 0 5 10
0 50 100 150 200 250 300 350
Performance (benchmark = 100)
Progress
(average annual growth 2000, 2006, %)
Catchi ng up Moving further ahead
Falli ng further behind Losi ng momentum
large countri es medium countries small countries
2010 benchmark
2020 benchmark
Source: European Commission DG JRC/Crell
Looking at performance and progress on the Upper secondary attainment benchmark (85% of completion by 2010), (Chart Int.2.3) Luxembourg and Spain are losing momentum with decrease in performance while still relatively far from the benchmark level. Croatia is showing the strongest performance, while Turkey and
Portugal are progressing notably, even though both are quite far from the benchmark level. Most large countries, with the exception of Poland, have low level of completion rates which has a significant impact on reaching the EU benchmark.
Chart Int. 2.3
Benchmark 2010: Upper Secondary Attainment (2000-2008)
Upper secondary attainment
BE BG
CZ DK
DE
EE
IE
EL
ES
FR IT
CY
LV
LT
LU
HU MT
NL
AT
PL PT
RO SI
SK FI
SE UK
HR TR
IS
NO EU27
MK
-5 0 5
50 100
Performance (benchmark = 100)
Progress
(average annual growth 2000-2008, %)
Catching up Moving further ahead
Falling further behind Losing momentum
large countries medium countries small countries
2010 benchm ark
Source: European Commission DG JRC/Crell
18
When it comes to the benchmark of Early leavers from education and training, of less than 10% of young people by 2010 (Chart Int. 2.4) one notices that significant progress has been made by many
countries and especially by Croatia, Poland, Slovenia, the Czech Republic, Slovakia and Lithuania, all of which already perform below the benchmark level.
Chart Int. 2.4
Benchmark 2010: Early leavers from education and training (2000-2008)
Early leavers from education and training
BE BG
CZ DK
DE
EE IE
EL
ES
FR IT
CY
LV
LT
LU HU MT
NL
AT
PL
PT
RO
SI
SK FI
SE UK
HR
TR
IS NO
EU27
MK
-5 0 5 10 15
0 50 100 150 200 250 300
Performance (be nchmark = 100)
Progress
(average annual growth 2000-2008, %)
Catching up Moving further ahead
Falling further behind Losing momentum
large countries medium countries small countries
2010 + 2020 benchm ark
Considering the Mathematics, Science and Technology benchmark, (Chart Int. 2.5) many countries have already achieved or are very close to the benchmark level of 2010 (15% increase in the number of graduates as
compared with 2000). Most of the countries which have not yet reached the benchmark level are catching up, with Slovakia and the Czech Republic having the highest rates of progress.
Chart Int.2.5
Benchmark 2010 : Mathematics, Science and Technology Graduates (2000-2007)
MST graduates
BE
BG
CZ
DK DE
EE
IE EL
ES FR
IT
CY
LV
LT HU
MT
NL
AT
PL
PT
RO
SI SK
FI SE
UK HR
TR
IS
NO
EU27
MK
-10 -7 -4 -1 2 5 8 11 14
0 25 50 75 100 125 150 175
Performance (benchmark = 100)
Progress
(average annual growth 2000-2007, %)
Catching up Moving further
ahead
Falling further behind Losing momentum
large countries medium countries small countries
2010 benchm ark
20
Performance and progress on the Adult Lifelong Learning Participation benchmark (Chart Int. 2.6) shows many countries are catching up and increasing their performance, even though not yet at the 2010 benchmark level (12.5% of participation). Some, especially the Nordic countries (Denmark, Sweden, Finland and Norway and Iceland, together with the
Netherlands and the UK), already perform above the 2020 benchmark level of 15% of adult participation in lifelong learning.
Hungary and especially Slovakia perform clearly below the benchmark level and show decreasing levels of progress.
Chart Int.2.6
Benchmark 2010: Adult Lifelong Learning participation
Lifelong learning participation
BE BG
CZ
DK DE EE
IE
EL
ES
FR
IT CY
LV LT
LU
HU
MT
NL AT
PL PT RO
SI
SK
FI
SE
UK HR
TR
IS NO
EU27
MK
-10 -5 0 5 10 15
0 50 100 150 200 250
Performance (benchmark = 100)
Progress
(average annual growth 2000-2008, %)
Catching up Moving further ahead
Falling further behind Losing momentum
large countries medium countries small countries
2010 benchm ark
2020 benchm ark
Source: European Commission DG JRC/Crell *MK= former Yugoslav Republic of Macedonia
The presentation of performance and progress above in the Charts Int. 2.2-2.6 clearly shows that all countries have strengths and weaknesses in the five benchmark areas and that no country is "falling behind” in all areas. It should be noticed that Poland
2.2. Best performing countries: Learning from good practice
All Member States can learn from the best performers in the Union. Therefore it is important to complete the analysis above by looking at the details in the benchmark areas and in other core indicator areas (See Tables Int.2.1 - Int.2.2).
This is why the Council asked for the three best performing countries in specific policy areas to be
identified. Half the Member States are best
[image:21.595.68.536.175.466.2]performers in at least one benchmark area. There is therefore a relative big spread of good practice and expertise in the EU among member states.
Table Int. 2.1: Best performing countries on benchmark relating to school education
Target for 2010/2020
Best performing countries in the EU EU USA Japan
2007 Participation
in early childhood education (4 years-start
of comp. primary), %
2020: 95% Sweden 100%
France 100%
Belgium
99.7% 90.7% 69.2 96.4
Change in the percentage of low achievers in % (2000-2006)
Finland -31.4%
Poland -30.2%
Latvia
-29.6% +13.1% - +82.2%
Share of low achievers, 2006 Low-achievers
in reading (15-year-olds, %) 2010: At least 20% Decrease 2020: no more
than 15% Finland 4.8%
Ireland 12.1%
Estonia
13.6% 24.1%
19.4%
(2003) 18.4%
2008 Early
school leavers (18-24, %)
2010/2020: No more than 10% Poland 5.0% Czech Republic.
5.6% a
Slovakia
6.0% 14.9% - -
2008 Upper secondary attainment (20-24, %). 2010: At least 85% Slovakia 92.3% Czech Republic 91.6% Poland
91.3% 78.5% - -
Source: DG Education and Culture - Data sources: Eurostat UOE and LFS; OECD/Pisa
Table Int.2.2: Best performing countries on benchmarks relating to higher education and lifelong learning
2010 target for EU
Best performing countries in the EU EU USA Japan
Average annual increase 2000-2007
Portugal +14.9%
Slovakia +12.6%
Poland
+12.2% +4.2% +2.0% -1.0%
MST Graduates per 1000 inhabitants (aged 20-29) in 2007
France 20.5
Finland 18.8
Ireland
18.7 13.4 10.1 14.4
% of female graduates in 2007 Graduates in Mathematics Science Technology (per 1000 young people) 2010: Increase of at least 15%
graduates Greece 44.2 % Romania 40.0 % Bulgaria
39.3 % 31.3 % 31.0% 14.4%
Higher education attainment, 2008 Higher education attainment (age 30-34) 2010: - 2020: at least 40%
Cyprus 47.1% Denmark 46.3% Finland 45.7% 31.1% Aged 25-34: 30.9% (2007) Aged 25-34: 40% Aged 25-34:54% 2008 Adult Lifelong Learning participation (25-64, %) 2010: At least 12.5% 2020: at least 15%
Sweden 32.4 (07)
Denmark 30.2%
Finland
23.1% 9.5% - -
a
: 2006, p: provisional
[image:21.595.70.529.508.758.2]22
2.3 Performance of European educational systems in a worldwide perspective
The European Council set the objective of “making European education and training systems in Europe a world quality reference by 2010”. (Council, 2002c, paragraph 43).
This report therefore puts European performance into a world-wide perspective by comparing it with the USA, Canada, Japan, South Korea, Australia, New Zealand, China, Russia, India and Mexico, countries which are trading partners or high educational performers. An overall evaluation of the EU performance compared to the rest of the World can be made by looking at the UN Education Index -
one of the three dimensions of the UN Human Development Index (HDI). The index can give a statistical picture of a country’s relative performances in school enrolment and basic literacy domains. It is constructed based on the adult literacy rate (with two-thirds weighting) and on the gross enrolment rate in the primary, secondary and tertiary levels of education combined (with one-third weighting).
The education index clearly places the EU as a whole among the world's best performers. Australia, New Zealand, Republic of Korea and the US perform slightly better whereas Japan, Brazil, Russian Federation, India and China show lower values of the index (see Chart Int.2.7)
Chart Int.2.7: EU Education performance in a Worldwide perspective - UN education index*
Australia 0.993
New Zealand 0.993
Canada 0.991
Korea (Republic of) 0.988 United States 0.968 European Union * 0.961
Japan 0.949
Russian Federation 0.933
Chile 0.919
Brazil 0.891
Mexico 0.886
China 0.851
India 0.643
Source: CRELL/Joint Research Centre (2009) Data Source: UNDP, Human Development Report (2009)
(*) EU aggregate is calculated as weighted average of index values for member states and the population data at 1 of January
The Index shows that while the north-eastern EU neighbours are mostly around an equivalent level of the EU average, its south eastern and southern
neighbours are clearly some way behind (Israel and Croatia are exceptions).
Chart Int.2.8: EU Education average performance level in a neighbouring countries perspective UN Education Index* (EU27=100)
2.4. Trends towards the 2020 benchmarks
Progress towards achieving the new 2020 benchmarks can not yet be monitored, since the latest data refer to the time before these benchmarks have been adopted (See Chart Int.2.9). However, looking at progress in the period 2000-2008 can help to see if the current trajectory of progress would point towards reaching the EU benchmarks in the future. As regards the benchmarks on Pre-primary education and Tertiary education, progress since 2000 has been above the trend line needed to reach the 2020 benchmarks. However, saturation effects may come into play for both benchmarks at a later stage, slowing down progress after 2010.
As regards early school leavers, in the period 2000-2008, progress is on the trajectory to reach the 10% goal in 2020. However, progress has slowed down 2007-2008.
For low achievers (only low achievers in reading literacy is shown here, whereas the new benchmark for 2020 also includes maths and science) which has only be measured in 2000 and 2006 by the PISA surveys, performance has clearly deteriorated during the period. The results of the 2009 survey, which will be published at the end of 2010, will tell if a change of trend has been achieved. Without a clear change of trends within the coming years the ambitious 15% benchmark will become a very big challenge to reach by 2020.
As regards adult lifelong learning, performance is clearly improving but progress has stagnated since 2005 which could imply that further national efforts
are needed to reach this benchmark. 4
Chart Int.2.9: Trends towards the five benchmarks for 2020 (2000-2008)
-60 -40 -20 0 20 40 60 80 100
2000 2001 2002 2003 2004 2005 2006 2007 2008 2009 2010 2011 2012 2013 2014 2015 2016 2017 2018 2019 2020
EU benchmarks 2020,
Evolution 2000-2008
Low achievers in reading Pre-primary education Tertiary attainment
Adult lifelong learning
Early school leavers
progress required
24
3. Demographical trends in Europe
53.1 Current trends in number of young people
In 2007, young people under 30 years represent about 35% of the total population in the EU27. However, the number of young people in the European Union has declined steadily. Between 1985 and 2007, the population aged 0-9 years in the EU27 decreased by 17.4%, the population aged 10-19 by 18.8%, and the population aged 20-29 by 7.9% (Chart Int. 3.1).
These trends have a different impact on the different levels of education. While compulsory education (primary and lower secondary education) are directly impacted by smaller cohorts through a lower intake
of pupils, increases in participation rates in upper secondary education and university are counteracting the demographic decline.
This overall trend conceals contrasting situations. For the 0-9 age group, although the EU-27 members have reported a stable situation during the 2005-2007 period, in countries such as Germany, Cyprus, Lithuania, Malta and Poland, the population has decreased at rates higher than 1.5 % per year. However, for the same age group and time period Ireland and Spain had significant growth rates above 2.5 % per year. In the 10-19 age group, several countries (Bulgaria, Estonia and Romania) experienced a population decrease over three times higher than the average rate for the EU-27.
Chart Int. 3.1: Variation of the population in the 0-9, 10-19 and 20-29 age groups in the EU-27 (1985-2007)
0-9 age group
10-19 age group
20-29 age group
1985 61 981 774 70 560 146 71 747 526 1990 59 755 140 66 069 001 73 035 161 1995 56 945 603 62 870 813 71 366 222 2000 53 278 070 61 189 541 67 627 903 2005 51 094 592 58 820 580 66 001 798 2007 51 196 945 57 276 530 66 085 404
Source: Eurostat, population statistics (data extracted July 2008).
Additional notes
France: The data relates solely to the Metropolitan territory and does not include the overseas départements. Cyprus: The data relates to territories under government control.
Explanatory note
a) National data are contained in the annexes available at http://www.eurydice.org.
The population is that of 1st January in the reference year. The population is based on data from the most recent census adjusted by the components of population change produced since the last census, or based on population registers.
3.2 Future intake of pupils in schools
Population projections of future pupil intakes in primary (ISCED 1, age 5-9) and lower secondary education (ISCED 2, age 10-14) enable future requirements in terms of infrastructure and
personnel to be estimated. 6
When it comes to changes in pupil intakes in primary and lower secondary education, two overall trends on the EU level emerge (Chart Ann. Int.2a and 2b). From 2000-2010 future intakes in both primary (8.5%) and lower secondary education (12.9%) fall. From 2010 to 2020 these trends appear to reverse and intakes in both primary and lower secondary education are projected to increase by around 3%.
During the period 2000-2010 only Spain, France, Italy, Luxembourg, the Netherlands and Portugal projections show an increase in the intake of primary
pupils. On the other hand countries such as Bulgaria, Estonia, Cyprus, Latvia, Lithuania, Poland and Slovakia experience projected declines of more than 25% of pupils in primary education. At lower secondary education only in Denmark, Luxembourg and the Netherlands the projections show growth in future intakes while Bulgaria, the Czech republic, Estonia, Latvia, Lithuania, Poland and Romania are projected to experience a decline in the intake of pupils of more than 30%.
Republic, Estonia, Ireland, Spain, Latvia and Sweden have projected increase of more than 10%.
3.3 Overall population trends
European populations are aging because of two major trends. First, total fertility rates have remained low for several decades i.e. below the rate of replacement which is at an average of 2.1 children per women. Second, people live longer and healthier lives.
Projections of demographic developments of specific age-groups towards 2060 (Table Int.3.1) shows that the population of the EU27 will rise gradually from 495.4 million in 2008, reaching 519.9 million in 2030 and gradually declining to reach 505.7 in 2060. The population is becoming older with the median age projected to rise from 40.4 years in 2008 to 47.9 years in 2060.
Table Int 3.1: EU population in millions
2008 2030 2060
Total population
(1 January) 495.4 519.9 505.7
Population aged 0-14 Share of total population
77.5 16% 75.5 14% 71.0 14%
Population aged 15-64 Share of total population
333.2 67% 321.9 62% 283.3 56%
Population aged 65+ Share of total population
84.6 17% 122.5 24% 151.5 30%
Old age dependency
ratios 25.9% 38.1% 53.5%
Source: EUROSTAT population statistics
While the young population is decreasing slightly from 77.5 million (16% of the total population) to 71 million (14 % of the total population), the major changes take place in the age group 15-64 year olds and the population older than 65. The working age population (15-64 year olds) falls by about 50 millions while the population older than 65 increases by more than 60 million. In terms of share of the total population, the working age population is expected fall to 56% of the total population while the share of people older than 65 are expected to increase to 30% of the total population.
Consequently, the old age dependency ratio is expected to increase substantially from its current levels of 25.9% to 53.5% in 2060. Or put differently, in 2008 there are 4 persons of working age (15-64 years old) for every person aged 65 years or over. In 2060 the ratio is expected to be 2 to 1.
These overall population trends holds policy message also for education. The shrinking labour force (i.e. the population age 15-64) suggests that education becomes even more important in the future to ensure that people on the labour market have right levels of skills (chapter II on labour market outcomes analyse this relationship in more detail).
The fast growing share of people over 65 year olds underlines the need for emphasising educational opportunities also for this group. Moreover, it suggests an increased demand for care and a need for educating more people to work in the care sector.
4. Investment in Education
Building on the Lisbon Council’s call for increased and improved investment in human resources, the Council Conclusions of March 2008 reiterates the
need for “investing more and more effectively in
human capital and creativity throughout people's lives” as crucial conditions for Europe’s success in a globalised world (Council, 2008).
This section analyses the patterns of investment in
education in the European countries.7 Data on
investment in Vocational Education and Training (VET) is not included here. However, it is covered in this report in section II.2 Vocational education and training. The overall level of educational investment in European countries is discussed in the first part of this section. The second part provides some insights into the variety of investment patterns by levels of education.
4.1. Levels of investment in education and training
In 2006 public investment in education in the EU accounted for 5.05 % of GDP There are large variations between European countries in their levels of total public investment on education as a percentage of GDP. In 2006 Denmark had the highest relative investment level in education among the Member States (8% of GDP), followed by Cyprus (7%), Sweden (6.85%) and Finland (6.14%). High level of public investment on education was recorded as well in Iceland (7.55%) and Norway (6.55%). In Slovakia, Turkey and Liechtenstein public investment in education in 2006 was close to or below 4% of GDP. As can be seen in Chart Int.4.1, in 2006 Japan (3.5%) trails the EU (5.05%) and the US (5.5%) on public investment. However, both the US and Japan have much higher levels of private investment in education than any EU member state.
26
Chart Int.4.1: Public investment on education as a percentage of GDP
EU27 US Japan EU27 GDPreal 1 1,5 2 2 ,5 3 3 ,5 4 4 ,5 5 5,5 6
20 00 200 1 2 00 2 2 003 20 04 200 5 2 00 6
Data source: Eurostat (UOE) – Graphical display is based on October 2009 data
The average annual change in the public investment (chart Int. 4.2) on education as a proportion of GDP between 2000 and 2006 has been positive in ten member states; Cyprus (and Iceland among the EFTA-EEA countries) has recorded the highest annual percentage change (over 4.5%).
In 2006 almost 90% of investment on educational institutions (all levels combined) at European level was covered by public sources. Private sources represented around 10% of total investment on educational institutions. In some Nordic countries like Finland and Sweden, less than 3% is covered from private sources. For another group of countries (Czech Republic, Spain, Latvia, Austria and Slovenia) private sources of funding accounted for 10 to 15% of total investment on educational institutions. In six member states (the United Kingdom, Cyprus, the Netherlands, Bulgaria, Germany and Slovakia), educational institutions are funded from private sources in a proportion of 15 to 25%. This compared to 32% in the United States, 33% in Japan and 41% in Korea.
Between 2000 and 2006 in one-third of European countries for which comparable data are available, the private sources of funding for all combined levels of education have increased as a percentage of
GDP (see table Ann. Int. 5). However, in the large
majority of the member states for which data are available this trend reversed between 2005 and 2006.
Chart Int. 4.2: Public investment on education as a percentage of GDP in European countries (2006p)
Public expenditure on all levels of education as a % of GDP Average Annual percentage change
Denmark Iceland Cyprus Sweden Norway Finland Belgium Slovenia France United Kingdom Netherlands Austria Hungary Poland Portugal Latvia EU27 Ireland Lithuania Estonia Italy Czech Rep Germany Spain Bulgaria Croatia Slovakia Luxembourg Turkey Liechtenstein Greece Malta Romania MK 0.0 -0.2 2.5 0.6 -3.9 2.1 0.5 -1.8 -0.5 1.2 3.4 -0.9 3.5 0.7 -0.9 4.6 4.5 (:) (:) -0.6 (:) 1.7 1.1 -3.2 1.6 -0.5 -0.6 -1.3 (:) (:) (:) (:) (:) (:)
-5 -4 -3 -2 -1 0 1 2 3 4 5 6
2.06 2.86 3.41 3.79 4.11 4.24 4.28 4.41 4.61 4.73 4.80 4.84 4.86 5.05 5.07 5.25 5.25 5.41 5.44 5.46 5.48 5.58 5.72 6.00 6.14 6.55 6.85 7.02 7.55 7.98 (:) (:) (:) (:) 0 1 2 3 4 5 6 7 8 9
Data source: Eurostat (UOE) – Graphical display is based on October 2009 data
(:) Not available - *MK= former Yugoslav Republic of Macedonia - Additional notes: see Table Ann. Int. 7
As concerns the trend in relative investment on educational institutions over the past six years, Bulgaria, Germany and Spain, are falling behind the EU average in public and private investments on educational institutions as a percentage of GDP
(countries in the lower-left quadrant). Countries like Cyprus, Latvia, France, Sweden, Austria (lower-right quadrant) are presently above the EU average (Cyprus for both public and private investments) but
educational institutions as a percentage of GDP. Only four countries with lower levels of GDP invested on educational institutions than the EU
average, Slovakia, Czech Republic, Italy and Ireland are catching up (upper-left quadrant).
Chart Int.4.3: Changes in the public and private investments in education in European countries (2000-2006)
Source: CRELL; Data source: Eurostat (UOE) – Graphical display is based on October 2009 data Legend: • EU member state with private investment as a % of GDP higher than the EU27 average • EU member state with private investment as a % of GDP lower than EU27 average
• European country with private investment as a % of GDP higher than EU27 average
Countries in the upper-right quadrant (Iceland, Hungary, United Kingdom, the Netherlands, Finland, Portugal, Belgium, Denmark) all perform above the EU average level (with IS, UK and NL for both public and private investments) and are moving further ahead (See Chart Int. 4.3.).
The upward trend noted between 2000 and 2006 in some countries with low levels of investment in education could be seen as a sign of giving priority to investment on education.
4.2. National priorities for investment in education
At the EU level, public investment in primary level of education amounted to 1.17%. Investment in the secondary level of education, accounts for the bulk of investment – some 2.24% of GDP whereas tertiary education accounts for close to 1.13% of GDP. As regards secondary education Cyprus and Denmark show the highest investment levels as a percentage of GDP (3% or close), while Bulgaria, Croatia and in particular Turkey show relatively lower levels. Slovenia is the only Member State with a higher level of investment in primary than in secondary education (see Table Ann. Int. 6).
Investments per student follow a common pattern throughout European countries: it increases substantially with the level of education. On average, investments per student at the secondary level, is 15 percent higher than investments per primary student in
teaching staff ratios, staffing patterns, teachers' salaries, teaching materials and facilities, duration of studies, largely account for the cost differences between levels of education. In 2006 the European countries as a whole invested between 1700 (Bulgaria) and 7900 (Norway) PPS Euro per primary student, respectively between 1700 (Bulgaria) and 9500 (Norway) PPS Euro per secondary student. These investment levels mask a broad variance between levels of education.
Between 2001 and 2006, investments on educational institutions per student increased by 29 percentage points at primary level, respectively by 15 percentage points at the secondary level and 12 percentage points
at tertiary level.8 This pattern may indicate efforts to
28
Table Int.4.1: Public investment on tertiary education as a percentage of GDP
Public Of
which direct public spendi ng Of which on R&D
In % of direct spending Country
2001 2006 2006 2006
EU-27 1.08 1.12 0.97 :
Belgium 1.34 1.32 1.14 32.5 Bulgaria 0.82 0.73 0.66 4.0 Czech Republic 0.79 1.23 1.18 18.4 Denmark 2.71 2.38 05 1.60 : Germany 1.10 1.11 0.89 37.3 Estonia 1.03 0.93 05 0.77 : Ireland 1.22 1.14 0.97 : Greece 1.07 1.44 05 1.42 05 15.1 05
Spain 0.97 0.95 0.88 :
France 1.21 1.19 1.10 34.6
Italy 0.80 0.80 0.67 51.2
Cyprus 1.14 1.65 0.74 17.3 Latvia 0.89 0.91 0.84 27.1 Lithuania 1.33 1.00 0.84 26.7
Luxembourg : : : :
Hungary 1.08 1.04 0.88 21.8 Malta 0.88 1.06 b 0.46 05 15.4 Netherlands 1.36 1.50 1.06 41.3 Austria 1.37 1.48 1.11 36.0 Poland 1.04 1.19 05 0.95 18.2 Portugal 1.03 1.00 0.88 31.6 Romania 0.78 0.90 0.76 05 : Slovenia 1.28 1.24 0.95 19.6 Slovakia 0.82 0.90 0.77 13.3 Finland 1.99 1.94 1.62 32.8 Sweden 2.00 1.84 1.36 44.4
UK 0.79 1.10 0.81 43.2
Croatia : 0.88 0.85 5.7
MK* : : : :
Turkey 0.87 : 0.76 :
Iceland 1.07 1.36 1.03 :
Liechtenstein : 0.19 13.4
Norway 1.84 2.07 1.21 30.6
Source: Eurostat (UOE data collection). Spending on the tertiary level includes R&D spending at universities.
Additional notes: *MK= former Yugoslav Republic of Macedonia
http://epp.eurostat.ec.europa.eu/portal/page?_pageid=0,1136184,0_455 72595&_dad=portal&_schema=PORTAL
The Commission has proposed the goal of investing 2% of GDP in higher education from public and private sources combined. The current level in the EU is 1.2% of which public investment accounts for about 1.13% of GDP. In Denmark, total public investments in higher education alone already surpasses 2% of GDP (from all sources); a large share of this, however (as in Finland and Sweden) is direct financial aid to students. Direct public investments on higher education institutions in these countries is hence considerably lower. On the other hand the share direct public investment is below 1% in 7 EU countries, including Italy, Spain and Romania.
Table Int. 4.2: Private and total investment on tertiary education as a percentage of GDP
Private pay-ments to educati-onal institu-tions House hold pay-ments Total private Total private plus direct public Country
2006 2006 2006 2006
EU-27 0.2 0.1 0.3 1.2
Belgium 0.1 0.2 0.3 1.3
Bulgaria 0.5 0.3 0.8 1.2
Czech Republic 0.2 0.0 0.3 1.4
Denmark 0.1 0.7 0.7 2.3
Germany 0.2 0.1 0.2 1.1
Estonia 0.3 : 0.3 1.1
Ireland 0.2 : 0.2 1.1
Greece : 0.1 05 : 1.5 05
Spain 0.2 : 0.2 1.1
France 0.2 0.1 0.3 1.3
Italy 0.3 0.1 0.4 0.9
Cyprus 0.7 0.1 0.8 1.4
Latvia 0.5 0.3 0.9 1.4
Lithuania 0.4 0.1 0.5 1.3
Luxembourg : : : :
Hungary 0.3 : 0.3 1.1
Malta 0 : : 1.1 05
Netherlands 0.4 0.1 0.5 1.4
Austria 0.2 : 0.2 1.3
Poland 0.4 0.1 0.5 1.3
Portugal 0.4 : 0.4 1.3
Romania 0.4 : 0.4 1.1 05
Slovenia 0.3 : 0.3 1.2
Slovakia 0.2 0.2 0.4 0.9
Finland 0.1 : 0.1 1.7
Sweden 0.2 : 0.2 1.5
UK 0.4 0.2 0.6 1.3
Croatia 0.3 : 0.3 1.2
MK* : : : 0.4 03
Turkey : : : 0.8
Iceland 0.1 : 0.1 1.1
Norway 0.0 : : 1.2
Source: Eurostat (UOE) Additional notes:
*MK= former Yugoslav Republic of Macedonia ISCED 5-6: tertiary education.
Direct public expenditure does not include transfers to private entities. If public and private spending are added up, it is preferable to use direct public expenditure (instead of total expenditure) to avoid double-counting.
Chart Int.4.4: Public investment on tertiary education as a percentage of GDP
0,4 0,6 0,8 1 1,2 1,4 1,6
2001 2002 2003 2004 2005 2006 Public spending on higher education as a % of GDP
USA
EU 27
Japan
Data source: Eurostat (UOE) – Graphical display is based on September 2009 data
The higher education investment gap between the EU and the USA currently thus amounted in 2006 to about 1.7% of GDP (about 200 billion Euro) or over 10 000 Euro per student (per full time equivalent student the gap even amounted to nearly 13 000 Euro PPS, 21540 in the US and 8590 in the EU). As a result of limited progress in increasing investment in EU countries the gap has not closed in recent years. The impact of the financial crisis still has to be seen. The crisis has already considerably reduced the value of endowment funds of leading private US institutions.
Total public investment on higher education as a percentage of GDP in 2006 increased in 11 EU countries while decreasing in 8. The Czech Republic,
Romania and Slovakia showed the biggest increases. Public investment accounts for more than 85% of the amount invested in tertiary education institutions in Europe. Cyprus and Latvia are the two EU-27 countries with the lowest share of public funding: up to 60% of the amount invested in higher education institutions there comes from private sources. Conversely, in Denmark, Greece, Malta and Finland higher education institutions are almost entirely funded by public resources.
The Member States are marked by great differences in the share of public investment on higher education going to research and development. Those Member States that have high overall levels of R&D spending have also high shares of R&D in investment on higher education. The large Member States and the Nordic countries often show R&D shares of above 30% (Table Int 4.1).
The proportion of the school-age population is only one determinant of the level of investment in education. Countries with similar proportions of the population in education may spend different shares of their GDP, according to the priority they give to different levels of education. Investments on higher education are more strongly affected by participation rates than compulsory education where all pupils of a cohort participate in education. Nevertheless adequate investment levels are especially important for countries that face low levels of participation in education and where current investment levels may not be adequate to increasing the proportion of population which participates in lifelong learning.
Chart Int.4.5: Public investment and participation in primary and secondary education (2006)
Cyprus
Denmark
Spain
France
E U2 7
Italy Latvia
Lithuania Hungary
Netherlands A ustria
P o land P o rtugal
Slo venia
Slo vakia
Finland Sweden
United Kingdo m
Cro atia
Turkey
Iceland
N o rway
B ulgaria
B elgium
Czech Rep
Germ any Es to nia
Ireland
2.5 7.5
45 S t ude nt s in IS C E D 1- 6 a ge d 5 - 2 9 a s % o f s a m e a ge po pula t io n ( 2 0 0 6 ) 70
30
As can be seen in Chart Int. 4.5 among the European countries there is a clear link between the public investment levels (measured by the proportion of public investment on education in the GDP) and the participation patterns in education. Participation in education is much higher in the Nordic countries (which also allocate high proportion of public spending) whereas countries like Turkey, Slovakia, Romania, Bulgaria or Croatia will have difficulties to increase their participation levels from the population if investment levels do not increase.
As a result of the current economic downturn many European countries will be increasingly limited in the amount of resources that they have at their disposal and in the ways in which they may use them. In some member states, infrastructure budgets will be at risk whereas in others, investment in education (school infrastructure, hiring new teachers, etc.) is part of the recovery plan; this investment will assist in the short-term re-launch of the economy and is expected to enhance the long-term economic perspectives.
Countries have to make difficult choices on investment levels in education due to the economic downturn. The higher education level is much more constrained during an economic downturn as a result of possible increases in student numbers (young people postpone their entry into the labour market) but also risking falling or
stagnating investment levels9 - some predictions show
that public funding for higher education will be cut in
seven Member States (by around 6-10%).10 In addition,
many universities fear that private investment will fallin
CHAPTER I
Making lifelong learning
and mobility a reality
Main messages
1. Participation in Lifelong learning
- Participation in lifelong learning at various lifetime stages
1.1 An aggregate measure on participation in lifelong learning in Europe
2. Student Mobility in Education
2.1 Mobility of higher education students
- Foreign students in higher education
- Higher education students enrolled outside their country of origin - Flow of students
2.2 European student mobility programmes
- Higher education students - Erasmus mobility - Post-graduate researchers - Marie Curie mobility
- Vocational education and training students - Leonardo da Vinci mobility)