Optimising the Structure of
a Cascaded Modular Battery System
for Enhancing the Performance of Battery Packs
Ahmed M. Fares*
†Christian Klumpner* Mark Sumner*
*Department of Electrical and Electronic Engineering, University of Nottingham,
Nottingham, United Kingdom
†National Authority for Remote Sensing and Space Sciences, Cairo, Egypt
Email: [email protected], [email protected]
Keywords: Battery chargers, battery management, battery equalization, modular battery systems, Lithium Batteries.
Abstract
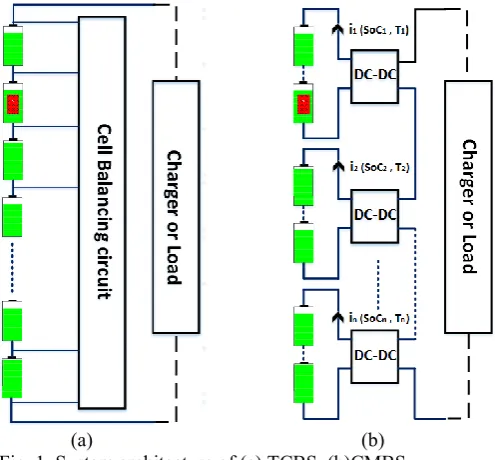
The overall performance of battery packs may be affected by imbalances between the series connected cells which is more likely in packs with high number of cells needed to provide a high voltage as needed for example in electric vehicles. In this case, the overall capacity and power capability of the pack is limited by the weakest cell in the stack which results in incomplete utilization of the pack’s capabilities. In traditional centralized battery systems (TCBS), this is addressed by implementing cell active/passive balancing circuitry/techniques which restore some of the pack’s energy capability. This paper proposes the use of cascaded modular battery systems (CMBS) to remove the need for extra balancing circuitry and maximises the performance and reliability of a battery system containing unequal matched/aged cells. The analysis is assessing the CMBS overall system efficiency, reliability and weight compared to the TCBS for a design of a 300V/3.6kW battery system as a case study.
1 Introduction
he degradation of performance of battery packs in battery based power systems as result of mismatch of cell performance or aging can affect the overall system performance so battery management systems (BMS) have an important role to minimise these effects in order to improve the performance and energy utilization of the battery pack and by reducing the stress on weaker cells, prolong its life time. The high voltage bus required by the traction system of electric vehicles requires the use of a large number of series connected cells. Therefore, the capacity of battery packs with series connected cells may be limited by the weakest cell in the string, i.e. if one of the cells lost 10% of its capacity compared to the majority of cells, the overall capacity of the pack will lose 10% as a result as the week cell will reach first the fully charged/discharged condition, and in order to prevent further degradation of this cell, the operation of the whole pack needs to be stopped. Although the mismatching
between pack’s cells can be mitigated when the pack is manufactured by selecting cells with similar performance (matched capacity), after significant utilisation of the pack, the degree of capacity mismatch between pack’s cells may increase and cannot be mitigated without a corrective actions. TCBS are implementing one of the traditional cells balancing techniques in order to achieve charge balancing to maximize the utilization of the pack capacity. Traditional cells charge balancing techniques are classified into two categories: i) dissipative balancing techniques that connect shunt resistors to dissipate the excess energy from cells with a too high state of charge (SoC) [1, 2] and ii) regenerative balancing techniques that circulate the extra energy from the cells that have a higher SoC to cells with lower SoC by using an efficient converter [3-6].
[image:1.595.304.552.446.676.2](a) (b) Fig. 1. System architecture of (a) TCBS (b)CMBS
the fully charged conditions whilst the regenerative technique may require significantly longer or continuous operation[7]. However, these cannot solve the problem of internal resistance mismatch between series connected cells that results in higher losses continuing to affect weaker cells that further accelerate degradation of their performance. The mismatching of internal resistance between battery cells with very similar matched capacity may be significant and it was shown that it could reach 20% at the beginning of life (BoL)[8], therefore it may reach an even larger value during the lifetime of the battery.
Loading all cells with the same load current share under this mismatching condition of the internal resistances can contribute to significant differences in the cell’s temperature affecting more the life time of the hotter cells. Based on this, it is important for the BMS to be able to perform a power losses balancing (PLB) strategy in addition to the charge balancing strategy in order preserve battery life time and achieve safe operation. The PLB strategy cannot be achieved in the TCBS due to the need to have the possibility to change significantly the individual currents of some cells which is impossible in a series connected stack. To implement this, it is required to have a modular battery system having distributed power converters to enable independent control of the current sharing of individual battery cells/modules, according to each cell/module capabilities in terms of power and energy.
Recently, new research has been conducted on the modular battery system concept especially to be used with second life batteries [9]. Such configurations can implement the suggested PLB strategy, but the problem of charge imbalances between the cells of each module still exist that may require additional balancing circuits. The modular battery system concept can be implemented at cell level [10] , i.e each converter interfaces a battery cell instead of a battery module which can ensure charge balancing and also can implement the PLB at cell level, but the system will become very complex and expensive for applications where large number of series connected cells are needed as each cell requires a separate converter and control loop.
This paper proposes the use of the modular battery system and identify a design of optimized number of cells per module to maximize the utilization of battery capabilities and overall System efficiency and reliability whilst at minimising the size, cost and complexity.
2 Usable capacity
The usable capacity of a battery pack of an n-series connected battery cells can be estimated:
n
i
i Cap Cap cell
U
1
)
( (1)
Considering capacity mismatching between pack’s cells illustrated in Fig. 2; therefore Equation (1) can be reconstructed as:
(2) Where Cap(cellweak) is the capacity of the weakest cell in the
[image:2.595.304.536.86.135.2]pack.
Fig. 2. Illustrating the usable capacity of a battery pack Based on Equation (2), the total usable capacity of the pack consists of two terms: the first term is the direct usable capacity (DUC) that can be utilized directly without any additional balancing circuitry which can facilitate fast charging/discharging. The second term is the processing needed capacity (PNC) that cannot be utilized unless a processing technique like the cell charge balancing system (CBS) is activated in the TCBS. Assuming a 10% capacity fade of the weakest cell (Cellweak) compared to the average
capacity fade of the other cells, this will make the PNC of the pack to become 10 % of the overall usable capacity. In order to remove the need for the CBS, the PNC should be kept as minimum as possible as it will not be utilized in the absence of balancing system.
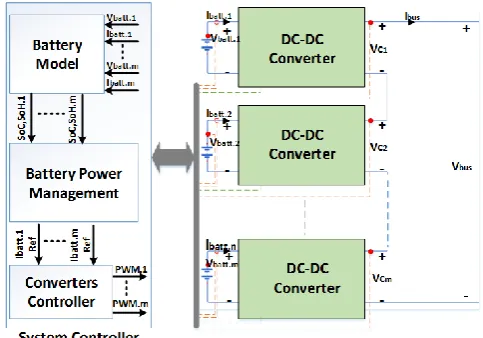
By using a CMBS topology (Fig. 3) in which the battery pack is split into M-modules each with its own converter, the weakest cell will limit only the capability of its specific module, allowing maximum utilization of the stronger cells in the other modules.
Fig. 3. CMBS architecture
[image:2.595.310.552.526.695.2]As shown in Fig. 4, for a TCBS (M=1) the DUC of the pack is 90% and the PNC is 10% of the available usable capacity (Ucap). This means that 10% of its capacity is lost in absence of a CBS. As the number of modules increases, the PNC decreases until it reaches 0.1% when M=50 (2 cells each module).
Fig. 4. Illustrating the effect of increasing the number of modules on the DUC and PNC of a battery pack.
It can be clearly seen that the PNC reduces significantly as the number of modules increases and this reduces the penalty of not having a CBS. However, increasing the number of modules is adding other penalties on system complexity, energy efficiency and weight which will be analysed in the following section in order to identify the optimal system configuration.
3 System design
[image:3.595.307.540.238.334.2]The analysis will be performed on the CMBS based on a step-down converter topology (Fig. 5) as it is inherently fault tolerant as any module can be bypassed by just switching-off the converter switches with no need for extra switches [11].
Fig. 5: Step-down topology based CMBS
It is also possible to implement a PLB based on cells internal resistances to ensure equal cell losses and therefore thermal balancing between cells based on an accurate losses observer developed in [12] .
3.1 Converter design
Considering that a Li-ion cell voltage varies between 3V to 3.6V based on its SoC and discharging current, so the minimum converter duty-cycle D has been selected to be 80% to maintain bus voltage at 300V when cells are fully charged and increase to 0.99 when discharged. The values of other design parameters are included in Table 1.
Parameter description Value Vcell Battery cell voltage 3 - 3.6V
N Total number of battery cells 100
I
Inductor current ripple(p-p) 4A Fs Switching frequency 100kHz D Converter duty ratio 80-100 % Ibus Load current 12A
[image:3.595.51.552.529.736.2]M Number of modules 1-50
Table 1: converter design parameters
Based on the selected buck-topology, the inductance of each converter’s inductor can be calculated:
s cell
F
I
M
D
D
V
N
L
*
*
*
)
1
(
*
*
(3)Based on inductor design rules considering the core geometrical constant Kg for core sizing [13], the inductor
core size can be estimated as:
)
(
*
1 2
2
1
M
f
R
M
L
C
K
DC
g
(4)Where RDC is the winding resistance,
f
1(M) is a functionselected based on the required reduction in RDC with
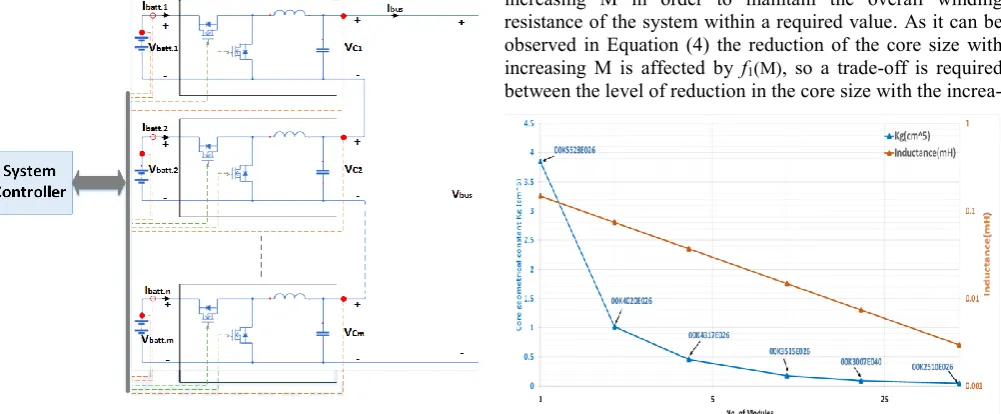
increasing M in order to maintain the overall winding resistance of the system within a required value. As it can be observed in Equation (4) the reduction of the core size with increasing M is affected by f1(M), so a trade-off is required between the level of reduction in the core size with the increa-
[image:3.595.286.552.587.736.2]-sing of M to maintain the overall size at minimum and the reduction in the RDC with increasing M to maintain the overall
losses at minimum. Fig. 6 shows the required inductance and core size and its part numbers based on Kool Mµ® materials for each configuration.
The overall mass of the converters inductor can be approximated by excluding the mas of the former as:
), (
* core copper overall M m m
Mass mcopperd*Ai*MLT*n (5) Where mcore is the core mass, d is the density of conductor
material, Ai is the conductor cross section area and n the number of inductor turns. As it can be observed in Equation (5), the overall mass of the required inductors increases as M increases but the core size reduces with the increase of M as predicted by (4) and the reduction of the copper mass (mcopper)
as a result, ramping down the increase in overall mass at high values of M. Similarly, the overall RDC can be estimated based
on (6):
)
(
*
1M
f
R
M
R
DC overallDC
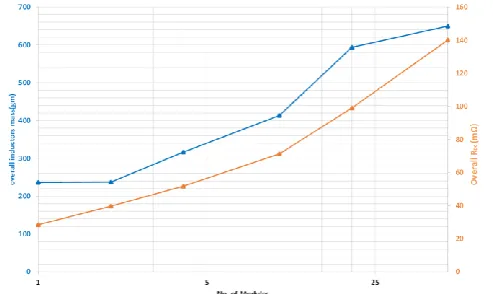
(6)The effect of increasing the number of modules on the CMBS overall inductors mass and overall windings DC resistance is shown in Fig. 7. It can be seen that if the increase in overall mass is somehow limited at high number of modules (M>20), the increase in overall resistance is in fact increasing which means that CMBSs with too high number of modules (M>10) will have significantly higher winding losses in their inductors.
[image:4.595.43.290.455.602.2]Fig. 7. Overall inductors mass and RDC in CMBS3.2 System
efficiency
The overall system losses are mainly determined by the inductor and switches losses. Inductor power losses can be approximated as: ACoverall RMS AC DCoverall bus core
inductor M P I R I R
P * 2 * 2 *
(7)
Where Pcore is the inductor core losses, IAC-RMS is the RMS
value of the inductor current ripple, RAC are the winding’s AC
resistances and can be determined as: DCoverall ACoverall C R
R 2 (8)
Where: 2 2 2 2
)
(
*
*
PentD
r
r
r
C
ands Pent F D * *
(9)
Where DPent is the penetration depth, to which the current
flows at a particular frequency (due to skin effect), r is the conductor radius and μ is the conductor’s permeability. The second part of the losses is the switches (MOSFETs) losses which is divided into the conduction and switching losses that can be estimated according to [14] as follows:
SW Cond MOSFETs P P
P (10)
Where PCond and PSW are the conduction and switching losses
of the MOSFETs for all modules in the CMBS and can be estimated as Equations (11) and (13):
))) 1 ( (
(
* I2 R D R D
M
PCond rms DSonhs DSonls (11) Where
hs DSon
R and RDSonlsis the on-resistance of the high-side and low-side MOSFETs respectively, D is the duty-ratio and Irms is the RMS value of the switches current and estimated as:
12
2 2 I
I
Irms bus (12)
The switching losses PSW is dominated by the power losses
during overlap of current and voltage during the transition period that can be estimated as:
* *
*( cell bus( )
SW r f sw
N V I
P M t t f
M
(13)
Where tr and tf is the rising and fall time of the switching
transition which depends on the gate capacitances and gate current.
As can be observed from Equation (11), the conduction losses assumed to be increased linearly with M, however increasing M reduces the required voltage rating of the MOSFETs and it’s RDSon as a result which ramp down the
increase in the overall conduction losses. Similarly, based on Equation (13) the overall switching losses decreases as M increases due to the reduction of the MOSFTEs voltage rating and the reduction of gate capacitances as a result.
MOSFETs losses (conduction and switching) as well as inductors losses are shown in Fig. 8. The switching losses are estimated based on VISHAY® MOSFETs with part numbers indicated for each design point on the graph. As it can be noticed, the losses of the TCBS (M=1) is dominated by the MOSFETs losses. For the CMBS topologies as M increases, the overall power losses are increasing due increased inductors losses and MOSFETs conduction losses. The discontinuities in the increasing of the MOSFETs conduction losses at M=4 and M=20 is due to breaks in the RDSon
increasing that seems to be due to changing of the manufacturing technology in order to keep RDSon at minimum
Overall, it can be noticed that the switching losses mirrors in opposition and level the inductor losses which means their sum remains roughly constant. This means that the lowest losses will be determined by the semiconductor conduction losses which seem to reach a minimum at M=4.
Fig. 8. CMBS different power loss components
3.3 Fault tolerance
The performance of the battery system under fault is very important as it affects the overall performance of the application. In order to analyse the performance of the CMBS under a different faults scenarios, it is important to consider how the faults affects the bus voltage as well as the available usable capacity. The minimum bus voltage under faults can be estimated as:
min min ( ) Cell
bus V
M N x M
V where xM (14)
Where x is the number of faulty modules and VCellmin is the minimum voltage of the battery cell at highest depth of discharge (DOD). The available usable capacity can be estimated as:
) ( )
( min
min untlz Cell Cap
Cap U V
M U x M
U (15)
Where UCap is the overall capacity of the pack which is
estimated based on Equation (2) and Uuntlz is the unutilized
capacity of the battery under limiting VCellmin to a specific
value to maintain the bus voltage. .
Fig. 9. Available capacity and bus voltage under faults
As it can be observed from Equations (14) and (15), the minimum cell voltage VCellmin at which discharging of the
battery has to be stopped, is affecting both the bus voltage and the available capacity UCap but in opposite direction i.e
increasing VCellmin will increase the minimum bus voltage but
will increase Uuntlz and decrease the UCapmin as a result and
vice versa. Analysis for minimum bus voltage and available capacity under different fault condition are shown in Fig. 9, the analysis has been done under (VCellmin =3.2V) which is
corresponding to 90% DoD that will cause additional loss of the available capacity (Uuntlz =10%).
At M=50, the bus voltage exceeded the designed value (300V), this is due to the selected DoD that can be increased for this specific configuration allowing more usable capacity. As the minimum available bus voltage and available usable capacity are strongly defining the usability of the pack under faults, a combination between Vbusmin and UCapminwill be used
as an indication for battery system usability under fault (UUF) in the further analysis.
4 CMBS system multi-objective analysis
[image:5.595.303.551.397.604.2]The different parameters of the system are affected differently with the increase of the number of modules (M), so a multi-objective analysis is required in order to define the optimum configuration based on the different parameters.
Fig. 10. System multi-objective analysis
[image:5.595.44.292.580.721.2](M=1) shows a reasonable efficiency, mass reduction and simplicity, the pack’s DUC and UUF are poor. On the other hand the CMBS (M>1) shows a good range of DUC, UUF, efficiency and simplicity based on the different values of M. As it can be observed in Fig. 10, it is not easy to identify an optimum solution as each configuration has positives and negatives. Therefore, evaluating a multi-objective cost function is required in order to determine the optimum value for M as:
C(M)WDUC(100DUC(M))WMR(100m(M))
WUUF(100UUF(M)Weff(100eff(M)) (16) Where WDUC is the penalty applied to the decrease in DUC,
WMR is the penalty applied to the increase in system mass,
WUUF is the penalty applied to decrease in pack’s UUF and
Weff is the penalty applied to decrease in system efficiency.
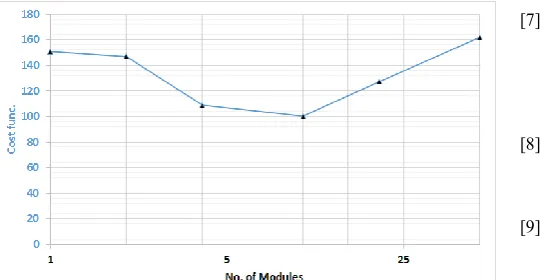
[image:6.595.43.316.385.525.2]The value of the multi-objective cost function at different M under all penalties=1 are shown in Fig. 11 , the minimum cost function is reached at (M=10); at (M<10) the cost function is influenced mainly by the system’s UUF and DUC, however at (M>10) the cost function is defined mainly by the system simplicity, reduced mass and losses. Therefore a range of M=5-10 modules may be used for more detailed investigations whereby the penalty coefficients can be more accurately defined.
Fig. 11. Multi-objective system cost function at different M
Conclusions
The CMBS has been proposed as a smart way to implement battery management functionality and to achieve maximum utilization of battery capacity without the need for cell balancing techniques as used with TCBS. A system analysis have been conducted based on a battery pack of 100 series connected cells to provide a designed bus voltage of 300V for a 3.6kW power system. The analysis showed that a combination of better efficiency, capacity utilization and fault tolerance of the CMBS can be achieved over the TCBS. The methodology to determine the optimum number of modules in cascade has been detailed by means of using a multi-objective cost function evaluation based on relevant system parameters.
Acknowledgements
This work was supported by the Egyptian Government through a PhD scholarship sponsored by Ministry of Higher Education (Cultural Affairs and Missions Sector).
References
[1] S. W. Moore and P. J. Schneider, "A Review of Cell Equalization Methods for Lithium Ion and Lithium Polymer Battery Systems," 2001.
[2] S. Wen, "Cell balancing buys extra run time and battery life," Analog Applications Journal, vol. 1Q, 2009 2009. [3] C. Pascual and P. T. Krein, "Switched capacitor system for
automatic series battery equalization," in Proceedings of APEC 97 - Applied Power Electronics Conference, 1997, pp. 848-854 vol.2.
[4] M. J. Isaacson, R. P. Hollandsworth, P. J. Giampaoli, F. A. Linkowsky, A. Salim, and V. L. Teofilo, "Advanced lithium ion battery charger," in Fifteenth Annual Battery Conference on Applications and Advances (Cat. No.00TH8490), 2000, pp. 193-198.
[5] J. Cao, N. Schofield, and A. Emadi, "Battery balancing methods: A comprehensive review," in 2008 IEEE Vehicle Power and Propulsion Conference, 2008, pp. 1-6. [6] M. Daowd, N. Omar, P. V. D. Bossche, and J. V. Mierlo,
"Passive and active battery balancing comparison based on MATLAB simulation," in 2011 IEEE Vehicle Power and Propulsion Conference, 2011, pp. 1-7.
[7] P. Kulsangcharoen, C. Klumpner, M. Rashed, and G. Asher, "Evaluation of a flyback regenerative voltage equalisation circuit for series-connected supercapacitor stacks," in Proceedings of the 2011 14th European Conference on Power Electronics and Applications, 2011, pp. 1-12.
[8] R. Gogoana, M. B. Pinson, M. Z. Bazant, and S. E. Sarma, "Internal resistance matching for parallel-connected lithium-ion cells and impacts on battery pack cycle life,"
Journal of Power Sources, vol. 252, pp. 8-13, 4/15/ 2014. [9] N. Mukherjee and D. Strickland, "Analysis and
Comparative Study of Different Converter Modes in Modular Second-Life Hybrid Battery Energy Storage Systems," IEEE Journal of Emerging and Selected Topics in Power Electronics, vol. 4, pp. 547-563, 2016.
[10] Y. Li and Y. Han, "A Module-Integrated Distributed Battery Energy Storage and Management System," IEEE Transactions on Power Electronics, vol. 31, pp. 8260-8270, 2016.
[11] A. Fares, C. Klumpner, and M. Sumner, "Investigating the benefits and limitations of cascaded converter topologies used in modular battery systems," in 2017 IEEE 26th International Symposium on Industrial Electronics (ISIE), 2017, pp. 2123-2130.
[12] A. M. Fares, C. Klumpner, and M. Sumner, "Development of a battery energy loss observer based on improved equivalent circuit modelling," in 2016 18th European Conference on Power Electronics and Applications (EPE'16 ECCE Europe), 2016, pp. 1-10.
[13] D. M. Robert W. Erickson, Fundamentals of Power Electronics, 2nd edition: KLUWER ACADEMIC PUBLISHERS, 2001.