Integration of a Web Processing Service (WPS),
GIS and hydraulic modelling (TELEMAC) for
geophysical analysis
Yicheng Zhang
Department of Engineering, University of Liverpool
i
Publications
Morsali, A., Zhang Y.C., Chen M., Chen, D., 2011. Development of a contaminated land risk assessment model HERA-Soil-GIS in open source QGIS, Environmental Modelling & Software.
ii
Contents
Publications ... i
Contents ... ii
List of Figures ... v
List of Tables ... vii
Symbols ... viii
Acknowledgements ... ix
Abstract ... xi
Chapter 1 Introduction ... 1
1.1 Background ... 1
1.2 Objectives ... 8
Chapter 2 Services and Service-Oriented Architecture ... 9
2.1 Introduction... 9
2.2 Overview of system architecture ... 10
2.3 Object-oriented and Service-oriented Paradigm ... 12
2.3.1 Existing configurations ... 13
2.3.2 Embracing SOA structure ... 16
2.4 Web Services ... 21
2.4.1 The Web Services Architecture ... 22
2.4.2 Protocol specification ... 22
Message orientation ... 23
2.5 Key Feature of Web service: loose-coupling ... 25
2.6 Summary ... 27
Chapter 3 Methodology ... 29
3.1 Introduction... 29
3.2 Related works ... 31
3.3 Overall design ... 33
3.4 CUAHSI Hydrologic Information System (HIS) ... 33
iii
3.5.1 Data layer ... 41
3.5.2 Service layer ... 44
3.5.3 Presentation layer ... 50
3.5.4 Specifications and protocols for supporting the design of 3O-HIS ... 56
3.6 Ontology in 3O-HIS ... 57
3.7 Summary ... 61
Chapter 4 Data management ... 64
4.1 Introduction... 64
4.2 Major linking resource with SOA in environmental science .... 67
4.3 SOA with database ... 69
4.4 Challenge for design SOA with data repositories ... 74
4.5 Data conversion ... 78
4.5.1 Steering file conversion ... 79
4.5.2 Boundary file conversion ... 82
4.5.3 Result file conversion ... 83
4.5.4 Data transmission ... 88
4.6 Key input files stored in service ... 88
4.6.1 Geometry file ... 88
4.6.2 Hydrodynamic models ... 89
4.7 Summary ... 93
Chapter 5 Application ... 95
5.1 Introduction... 95
5.2 Current states of GIS with Hydrological Modelling ... 96
5.3 User guide of 3O-HIS ... 99
5.3.1 Installation ... 100
5.3.2 Using the 3O-HIS ... 106
5.4 Service deploying for different hydrological models ... 115
5.4.1 System configurations ... 116
5.4.2 Service component configuration ... 116
5.5 Case Study: Flooding forecast around Blackpool ... 119
5.5.1 TELEMAC in 3O-HIS ... 123
iv
5.5.3 Flooding forecast data analysis ... 129
5.6 Case Study Area: Demra of Bangladesh ... 134
5.6.1 Data definition/ Collection ... 137
5.6.2 Results and Discussions ... 141
5.7 Comparing uDig-Telemac with ArcGIS-Telemac ... 144
5.8 Summary ... 149
Chapter 6 Conclusions and Further works ... 152
6.1 Introduction... 152
6.2 Major findings ... 153
6.2.1 Components of 3O-HIS ... 154
6.2.2 Application of 3O-HIS ... 156
6.3 Further works ... 158
References ... 160
Appendix I ... 170
SQLConnection.java ... 170
OpenFile.java ... 180
Read_file_code.java ... 182
v
List of Figures
Figure 2.1 SOA explained (Huhns and Singh, 2005, After Service-Oriented Computing: Key Concepts and Principles,
Page 76). ... 17
Figure 2.2 The anatomy of a service (Webber and Parastatidis, 2009, after: Service-oriented computing, Realizing Service-Oriented Architectures with Web Services, Page 57). ... 20
Figure 2.3 General Web services architecture. ... 23
Figure 2.4 Contrasting a (a) tight-coupling and (b) loose-coupling approach for model integration (after: Jonathan et al.,2011, Modelling water resource systems using a service-oriented computing paradigm, Page 574). ... 27
Figure 3.1 The key components of the CUAHSI HIS service-oriented architecture (after: Zaslavsky and Maidment, 2011) ... 35
Figure 3.2 The 3O-HIS’s architecture ... 41
Figure 3.3 The bottom structure of 3O-HIS ... 44
Figure 3.4 52°North WPS service and HIS ... 48
Figure 4.1 Distributed flowchart between users and TELEMAC ... 80
Figure 4.2 Type of value stored in services in 3O-HIS ... 81
Figure 4.3 The mechanism of tranmision from res to PostSQL... 84
Figure 4.4 Result data conversion from TELEMAC to 3O-HIS ... 86
Figure 4.5 Structure of Totalvariable ... 87
Figure 5.1 The processing flow of 3O-HIS ... 102
Figure 5.2 An example of geom feature representation in GML2 105 Figure 5.3 Display of Catchment area using 52°North WPS ... 106
Figure 5.4 GUI for TELEMAC ... 107
Figure 5.5 GUI of hydraulic model linking with 3O-HIS ... 109
vi
Figure 5.7 GUI for TELEMAC (Options tag) ... 110 Figure 5.8 SQL statement – shapefiles ... 112 Figure 5.9 SQL statement – shapefiles ... 113 Figure 5.10 The inundation map and water depth with time series
(three random points) in 3O-HIS... 113 Figure 5.11 Water depths with time series ... 114 Figure 5.12 Map of the Blackpool-Fleetwood area (After Wyre
Borough Council, 2004) ... 120 Figure 5.13 ASCII text file: Steering file ... 125 Figure 5.14 3O-HIS service bus(linkage TELEMAC model) ... 127 Figure 5.15 a) inundation map SLR 0cm in Fleetwood, b)
inundation map SLR 49cm in Fleetwood ... 130 Figure 5.16 Location Map of the Study area (Source:Magellan
Geographix) ... 136 Figure 5.17 Discharge of Lakhya river from 2002-2011... 138 Figure 5.18 Land use in GIS ArcView ... 139 Figure 5.19 Web service and local response Time with 141 times
vii
List of Tables
Table 3.1 The OpenMI model execution time varies as the number of modelling elements ... 52 Table 3.2 Different components’ execution time varies as the
number of modelling elements ... 54 Table 5.1 Inundation areas based on the different sea level rise ... 131 Table 5.2 Total Direct damage amount based on the different sea
level rise ... 133 Table 5.3 Values of K for selected crops (Source: Subramanya, 2008)
... 140 Table 5.4 System configurations between Tele-Arc and Tele-uDig ... 145 Table 5.5 Comparing the response time between Tele-Arc and
viii
Symbols
3O-HIS
Object Oriented (OO) technologies with extensions of OpenGIS standard
DEM Digital Elevation Models
EPA Environmental Protection Agency
FWD Floodline Warnings Direct
GIS Geographic Information Systems
GML Geography Markup Language
HIS Hydrologic Information System
LTER Long Term Ecological Research
Network
NEON National Ecological Observatory
Network
OGC Open Geospatial Consortium
OO Object Oriented
SOA Service-Oriented Architecture
SOAP Simple Object Application Protocol
WSDL Web Service Description Language(
ix
Acknowledgements
I would like to express my gratitude and thanks to my supervisor, Dr. Ming Li, whose expertise, understanding, and patience, added considerably to my graduate experience. I appreciate his vast knowledge and skill in supervising me throughout my PhD works and for advising me on TELEMAC and motivating me to use computing knowledge (FORTRAN). I would also like to thank my supervisor Professor Daoyi Chen, who provided his valuable advices at all levels of the research project. I would also like to thank my secondary supervisor Dr. Xiaoxian Zhang for his advice.
x
xi
Abstract
xii
pollutants potentially damage infrastructure in long term. They are interactive and relate with physical, hydrological and biological processes and needs interoperation among difference organizations such as meteorology, ecology, economy.
xiii
commonly available data such as elevation and image data is fetched from web services, processed in hydrological models and results can be analysed as well as Geographic Information Systems (GIS) software. Different hydrological models can be integrated in one system, each model is encapsulated in services and the loose couple feature supports to compose freely for solving a particular environmental problem. Therefore, it can meet the requirements for multi-scale and multi-object assessment and decision-making.
xiv
complicated modelling scenarios, the gathering input data from multidisciplinary sources, unifying data formatting and distributing information across the multi-agency system are still a significant challenge and may hinder the development.
xv
multidisciplinary data at distributed locations via multiple web services. Hydrodynamic modelling encapsulated in services based on service-oriented architectures (SOA) has the capability in managing, analysing, and publishing images and numerical results, and the integration of 3O-HIS with GIS is convenient to capture, store, manipulate, analyse, manage, and ultimately present all types of geographical spatial data.
xvi
1
Chapter 1 Introduction
1.1 Background
Computer model has now been used extensively and plays an important role in fulfilling the core tasks of policy making, water resources management and research (STOWA/RIZA, 1999). However, from an application-oriented perspective, Mineter et al. (2003) argued the need for a new generation of environmental applications that from an application-oriented perspective, shifting from the centralized, local desktop applications towards loosely coupled unit which composed of a service interface and a service implementation.
2
can be very effective to achieve the goal. Alonso et al. (2004) implemented service-oriented architectures and Foster (2005) developed standard interfaces and protocols that allow developers to encapsulate models as services. Lecca et al. (2011) used ideal service-oriented architectures for hydrological applications. The hydrological models and service interfaces for clients are loosely coupled at globally distributed locations. Granell et al. (2009) and Feng et al. (2011) also developed the approach to access geospatial computational models using GIS techniques and Open Geospatial Consortium (OGC)1, Web Processing Service (WPS)2 standard. A significant improvement can be found in Castronova et al. (2013) with models being integrated in the framework of the Consortium of Universities
1 OGC: Open Geospatial Consortium(OGC), is an interface standards which has an consortium of 475 companies, government agencies and unicersities participating for publicly available interface standards (OGC,2014).
2 WPS: Web Processing Service(WPS), is an interface standard which provides rules for standardizing how inputs and outputs for geospatial processing
3
for the Advancement of Hydrologic Science, Inc. (CUAHSI) HIS web services under the OpenMI standard.
4
critical infrastructure, and the implication for flood risk management as set out by the Environment Agency, part of the Department for Environment, Food and Rural Affairs (Defra). It has been recognised that the development of a new flood warning system based on a Service-Oriented Architecture (SOA) will be able to deliver timely warnings and improve the performance of the existing flood modelling and hence management capability.
5
FWD delivered 29,000 calls; and in April, 2012 the system delivered 54,000 warning calls to address 459 areas vulnerable to be flooded, an 86% increase in comparison to previous model. Applications based on SOA are suitable for sharing hydrologic data and facilitate policymakers on future coastal flooding management.
6
disparate research groups. In 3O-HIS,many considerable common protocols such as Simple Object Application Protocol (SOAP)3 and Web Service Description Language (WSDL)4 have been applied to integrate heterogeneous types of data and knowledge encapsulation of models as Services. It has the ability of scientists to discover and use data from more than one repository. We listed two problems that it exists when creating a data collection and analysis infrastructure at large scales.
The challenge of developing 3O-HIS is no particular ‘standards’ or ‘protocols’ to define the rules to build a service-oriented application i.e. a model integration platform for environmental applications. Currently, two mature specifications: SOAP and
3 SOAP : Simple Object Access protocol (SOAP) is a protocol specification for exchanging structured information in the implementation of web service in computer networks.
7
WSDL used in SOA to form the message-oriented underlay which could have problems in model integration for environmental application. By using SOAP and WSDL, large number of objects (e.g. elements of Mesh) and time series of hydrodynamic features can be transmission between services, it is simplify and concise for the system. The transmission of massive and heterogeneous types of data between services is improved.
8
disparate data exchange seamlessly.
1.2 Objectives
These purposes that include: 1) understanding of the natural processes 2) testing of the representation of process 3) providing the likely future state of an environmental system 4) consideration and representation of trans-disciplinary systems to support making a decision. And it transmits to the objectives of this research are;
To examine SOA linking with hydrodynamic modelling to represent multi-objective assessment and decision making. To understand the heterogeneous resource communicated
efficiently under web services to drive hydrodynamic modelling.
9
Chapter 2 Services and Service-Oriented
Architecture
2.1 Introduction
This chapter is centred on the concept of services and service-oriented architecture to create distributed applications for the research in hydraulic science. To support the modelling integrations, a range of considerable approaches, tools such as Geographic Information Systems (GIS), object-oriented concepts, service-oriented concepts, and component based modelling techniques and modelling frameworks.
10
future states of a particular environmental system to much more complicated integrations of environmental applications. This chapter provides an overview of the existing approach of integrated applications from the conceptual and technological
aspects. It covers a review of the developments in recent
years including service-oriented concepts, component-based
modelling techniques and modelling frameworks. Solutions
are reviewed which are migrated from dedicated desktop to
on-line, loosely coupled and standards-based services in
order to meet the requirements for multi-scale and
multi-object assessment and decision- making.
2.2 Overview of system architecture
11
architecture including Service-Oriented (SO) concept has been discussed frequently which a computing integrated services and a computing paradigm. SO has been developed that utilizes services as fundamental elements for changing mission requirements. Major advantages of Service-Oriented Architectures (SOAs) are 1) a loosely coupled architecture which can support dynamic simulation process; 2) a distributed system architecture for data sharing in an Internet-based infrastructure (Georgakopoulos and Papazoglou, 2012; Peckham and Goodall, 2013); 3) services are suitable to encapsulate software capabilities (Sprott and Wilkes, 2004), and 4) higher-level abstractions are provided for organizing applications for large-scale and open environments (Granell et al., 2009).
12
supporting and increasing management requirements dealing with huge data resource in the environmental science fields. (Georgakopoulos and Papazoglou, 2012; Argent, 2004; Papajorgji et al., 2004). From a range of environmental modelling, the trend of development of system architectures is from centralized, object-oriented integration platforms through to the loosely coupled, service-oriented programs, the mission requirements are modified to focus on between services. Interoperation between services is important that services distribute seamlessly to eliminate barriers. The integrated modelling platform abstracts the functionality in a high level and provides service implementation independently and interactively for multi-objective assessment.
2.3 Object-oriented and Service-oriented Paradigm
13
encapsulate functionality for the purpose of interoperation in the integrated hydraulic applications. OO paradigm defined the function usually recalled on a local machine while SO functionality is provided by procedures of a service. They both can encapsulate the hydraulic models with objects or class. For example an OO approach is explained by Guariso et al. (1996) that a strong integration of the various modules implemented under OO structure and Rizzoli et al. (1998) developed framework–based approaches using OO structures for optimization, scenario exploration and decision support. Recently, Argent (2005) developed a simple catchment-based nonpoint source pollution models using OO paradigm as modelling methods, and different data types in this system architecture to estimate pollution loads.
2.3.1 Existing configurations
14
well the concepts of model reuse and extensibility. It encouraged users to define their own hierarchy of model classes. OO structures can separate the different modelling as components and such distributed mechanism ensure that one modelling changed do not call for changes in others. However, OO structure is not beneficial when thinking about requirement of the light of existing models constraints (Bih, 2006), especially isolated service requests/components. On the database management side, OO framework almost inevitably becomes much more complicated because it stores massive objects for representation of processes such as hydraulic tide process. There is a need for large memory for storage in databases and even duplicate the data.
15
and messages” in SO architecture (SOA) provides an attractive way for integrating different modelling, especially design a complex framework. Services can store different types of data and data sets can be communicated by messages. For example various and massive hydraulic attributes such as bathymetric information, digital elevation models’ (DEM) maps, water depth and velocity are arranged in difference resource repositories (NASA, USGS, OSGE, EPA) and are interacted by messaging under different protocols (SOPA, WSDL).
16
paradigm for researchers to develop models that operate Level I-IV which is explained in details in model integration by Argent (2004).
Compare with OO paradigm, SOA can generally represent any data independently to encourage reuse of data and other resources for different users’ scenarios. SO paradigm is more attractive and interactivity provides different distributed computational components and implies the superiority that distributed components interoperate over a network (Huhns and Singh, 2005). The following section shows how the principles of SOA are embodied by modern Web Services practices.
2.3.2 Embracing SOA structure
17
synchronous and asynchronous applications and relies on a collection of loosely coupled self-contained functional modules, referred to as services, which communicate with each other and can be called from multiple clients or chained in processing workflows. SOA includes comprised of three primary parties: Provider (of services), Consumer (of services), Directory (of services), as shown in Figure 2.1(Huhns and Singh, 2005). Providers publish or announce their services on registries, where consumers find and then invoke them. These services have free connection that service interface is independent implementation.
Figure 2.1 SOA explained (Huhns and Singh, 2005, After
18
The service provider is the network-addressable entity that accepts and executes requests from consumers (Chatterjee, 2004). It is the mainframe of the architecture, components executes the service request. Service registry contains available services which stores contracts from service providers and provide to the service consumers. Usually service registry used to identify services, describing the service and the service function. Service requestor requires services for achieving an idea or a solution. Service requestor nodes often discover and invoke other software services that need call remotely to a distributed object, the service provider.
19
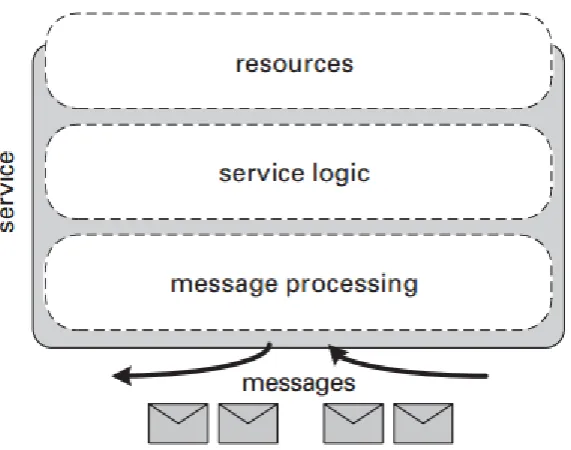
services communicate with each other’s only in message processing layer which represent an “event horizon” (Webber and Parastatidis, 2009). Message exchanges between services where the messages arrive and leave in message processing layer. It resemble interface/function application, the internal architecture of a service is kept hidden from the outside world.
20
[image:37.595.154.440.335.560.2]between services makes the chance for designing services independently. For example UK hydraulic data (e.g. water depth) stored in National Oceanography Centre service, we can obtain the data by using message to contact service registry, and service is processed independently without affecting other services such as bathymetric map service and elevation service.
Figure 2.2 The anatomy of a service (Webber and Parastatidis, 2009, after: Service-oriented computing, Realizing Service-Oriented Architectures
with Web Services, Page 57).
21
designed to facilitate the message exchange for the protocols it supports. From many articles, it is important to understand that services should not be considered “containers” which contains serialized objects, functions. It is wrong to relegate them to mere interfacing or encapsulating them as interfacing application. We need to pay less attention on how the functions are “hidden” well in services; we need to consider how a series of services are designed by reading the messages that service application abstracts. With a summary, the loose-coupled services, messages and standard communication protocols provides reusable components and interoperable communications in 3O-HIS.
2.4 Web Services
22
explains specifications and principles when Web services implement in distributed systems.
2.4.1 The Web Services Architecture
In the early days of the Internet, we shared information efficiently using static websites called HTML. However, this process was not suitable for delivering services over the Internet. The original HTTP and HTML protocol stack often provide static, or at least highly cacheable. In contrast, the Web services architecture is designed for highly dynamic program-to program interactions. The architecture view encompasses web services protocols which are designed with layers cleanly.
2.4.2 Protocol specification
23
principles: message orientation, protocol compatibility and autonomous services have been discussed in the following section.
Message orientation
Message orientation is the core principle that communicates between services using only messages. Three general protocols a WSDL protocol, a SOAP protocol and XML for message communication provide data accessibility over Internet as shown in Figure.2.3.
Figure 2.3 General Web services architecture.
24
interacting with web services over HTTP. WSDL is an XML-based format for describing Web services as collections of network endpoints or ports (Lutz et al., 2009; Paul and Ghosh, 2008). The client side receives WSDL files from the server side that learns the service‘s methods, and a SOAP request is then sent to the server to identify the needs. The server processes the SOAP request and sends output in XML format. Unlike RPC systems in which messages are strictly subordinate to the local programming experience, the Web services architecture is built with messages as the atomic unit of communication (Webber and Parastatidis, 2009).
Protocol composability
25
message exchanges between services. One advantage is that there is absolutely no cost to applications that only loaded the protocols that used. For a particular application, the external protocols can be used such as WS-Security, WS-ReliableMessaging (Webber and Parastatidis, 2009). This can maximize the applicability of the architecture.
Autonomous services
Services are designed and evolve independently from each other. If there is an internal changing in one service and will not affect other services. Evolution of a service’s implementation may not consider the other’s behaviour of the service. This feature helps to improve the portability of architectures.
2.5 Key Feature of Web service: loose-coupling
26
27
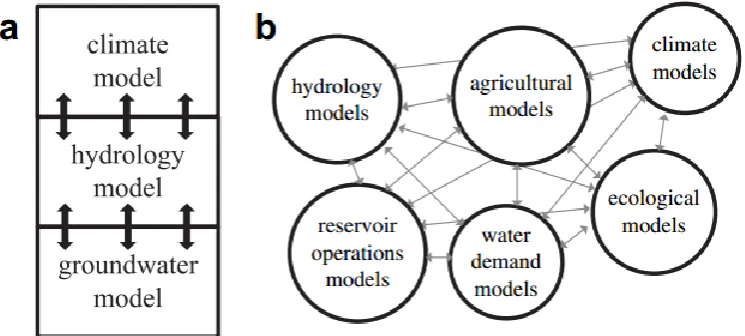
Figure 2.4 Contrasting a (a) tight-coupling and (b) loose-coupling approach for model integration (after: Jonathan et al.,2011, Modelling water resource systems using a service-oriented computing paradigm,
Page 574).
A standardization of interfaces is requirement data for development a loosely-coupled architecture. The advantages of adopting a loose-coupling, service-oriented paradigm for modelling are to enhance the interoperation between services and to provide a uniform framework for data exchange. Loose-coupling 3O-HIS will be described in next chapter.
2.6 Summary
28
29
Chapter 3 Methodology
3.1 Introduction
This chapter presents the physical and mechanical concepts of 3O-HIS platform and the methodology of encapsulating hydrodynamic modelling (e.g. Telemac) in 3O-HIS. SOA has been reviewed previously as a basic work frame for developing 3O-HIS. In this chapter, the encapsulating methodology of 3O-HIS has been discussed, including its mechanical concepts, the structure and behaviour of solutions, as well as an example of encapsulating Telemac in 3O-HIS which helps us understand encapsulating hydrodynamic modelling in technological aspects necessarily.
30
31
integrated modelling to develop 3O-HIS for preparing assessment in an interdisciplinary way.
3.2 Related works
32
service-orientation is a core concept behind distributed computing where the Internet is used for primarily spatial data analysis. For example integrative Telemac modelling with GIS in the design of SOA works, possibly with the aid of numerical predictions of the coastal morph dynamics and the flood risk analysis of the lowland such as Blackpool in England.
33
hydrologic simulation models as part of their service-oriented architecture for multi-scale and multi-object assessment and decision-making.
3.3 Overall design
Design of environmental modelling system undertaken for a vast range of reasons, one motivation of developing 3O-HIS is better understanding the processing of natural phenomenon. The goal of design 3O-HIS is the concept of reuse and interoperation between services; each layer is explicit and each component is processing separately and independently for operation. 3O-HIS has been derived from CUAHSI HIS.
3.4 CUAHSI Hydrologic Information System (HIS)
34
San Diego, 2008). Three key parts: several data storage, delivery and discovery tools and standards have been developed within the context of the CUAHSI HIS project (Tarboton et al., 2009).
35
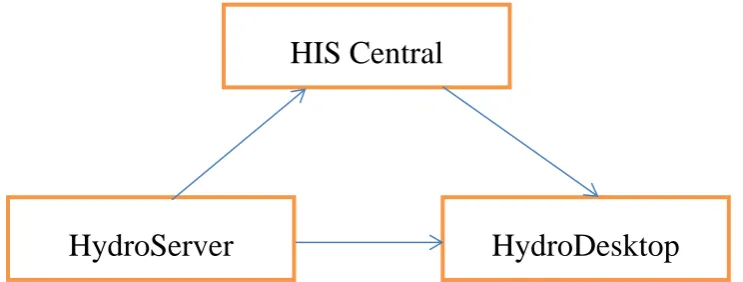
[image:52.595.123.495.345.486.2]HIS was developed as a part of advanced hydrologic research. Users can implement web services to discover and access a variety of hydrologic data sources and develop applications for the desktop and the web (Zaslavsky, et al., 2007). The goal of CUAHSI HIS is to promote data sharing and reuse through the use of standards and web services for information exchange (Horsburgh et al., 2009).
Figure 3.1 The key components of the CUAHSI HIS service-oriented architecture (after: Zaslavsky and Maidment, 2011)
From the Figure 3.1, three classes of functionality compose the CUAHSI HIS services oriented architecture: 1) data collection (HydroCatalog); 2) data transmission, including Observations Data Model (ODM), WaterOneFlow web services and WaterML;
HIS Central
36
and 3) data publication including HydroServer and representation tools Hydroseek and HydroDesktop. CUAHSI HIS integrated these functions and have the capacity of interoperation of multiple hydrologic and environmental observation data repositories.
37
database schema for use in the storage of hydrologic observations data collected by multiple investigators. Within it, a relational database is created in a geographically distributed network to effectively share hydrologic information between investigators.
38
multiple environments in particularly data-intensive hydrology research (Shams and Huang, 2009).
Under CUAHSI HIS framework, difference of hydrologic information data such as water properties, distribution and circulation on the earth’s surface and high-resolution remote sensing can be retrieved from multidisciplinary repositories at distributed locations (Goodchild, 2007). The disparate data resource is collected through a multitude of agencies including the Environmental Protection Agency (EPA), U.S. Geological Survey (USGS), and the National Oceanic and Atmospheric Administration (NOAA). However, some limitations exist when vast ontologies stored in CUAHSI HIS.
39
(Zaslavsky et al., 2007). It means that it is possible to collect hydraulic data from multidisciplinary sources at distributed locations via multiple web services. However, there is a lack of an effective and efficient method to extract expected information from massive and complex spatial databases. For example, it hinders the decision makers to manage water efficiently under the availability of partial databases.
40
reliably from multiple services. Additionally, maintaining the central metadata catalogue in synchronization with multiple sources of hydrologic data has been one of the main bottlenecks to CUAHSI HIS. In addition, CUAHSI HIS has not yet developed the capability to integrate other data such as economic, social, land use and remote sensing data.
3.5 3O-HIS architecture
41
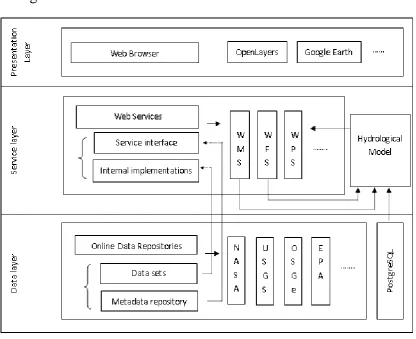
[image:58.595.90.507.211.550.2]ideas of SOA and the architecture of the system along with different layers including data layer, service layers and presentation layer. The architecture of 3O-HIS has been shown in Figure 3.2.
Figure 3.2 The 3O-HIS’s architecture
3.5.1 Data layer
42
organized, observational data repositories, including the above mentioned NASA, USGS NWIS, EPA STORET, USDA SNOTEL, and NCDC provide the hydrology data that are both spatially and temporally distributed. Two major hydrological data are point (discharge) and distributed (rainfall, runoff, evaporation) types as used in hydrological models (Leone et al., 2006).
43
44
Three modules are processed separately and independently for operation. The initial result is calculated in the first part, and GIS can handle spatial data analysis and visualize based on products in the data management block. In addition, the products from GIS can resend to the environmental modelling as a new input file. Based on the results produced by GIS, many likely future states of environmental processes can be represented by re-sending different scenario files.
Figure 3.3 The bottom structure of 3O-HIS
3.5.2 Service layer
45
46
47
designers of SOA typically use web service standards, used extensively in industrial and commercial contexts, to implement their services. These standards remarkably increase the interoperability of commercial systems.
Web service matches the ontological differences and provides the hypothesis based request/response for synchronous and asynchronous applications. We not only need to consider the information from existing repositories, but also design web services for sharing the result stored locally. We show that web services can be used as an initial block in program creation according to several indicators like accessibility, quality, cost and efficiency. After reviewing the general Web services architecture and analysis of required services for organization, we present our 3O HIS service oriented design method.
48
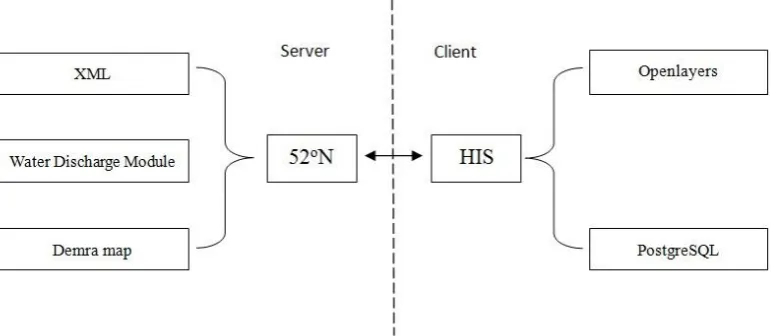
[image:65.595.106.492.373.541.2]scientists is “integrated” modelling. That is means different components of the natural other systems are modelled in a linked way representing features of system behaviour. The software architecture of server-client linkage is shown in Figure 3.4. In our designed Web service, XML is generated to solve this challenge, which ensures that the geospatial data interoperate seamlessly between web services.
Figure 3.4 52°North WPS service and HIS
49
type of data for input and output to the service. The Water Discharge Module compiled in Java is uploaded to 52°North WPS. 3O-HIS provides these standard programming paradigms that allows hydrologic modelling as components, located on any network to be discovered, published, and invoked by other modelling web service. Regardless of location of distributed network and development platform is one of contributions using 3O-HIS that any service-based application can interact with any other service-based application based on distributed components.
50
repositories. Most of hydraulic modelling were generally designed to do a particular job and are often not able to provide the features we now desire, such as flexible exchange of algorithms or connect with other models.
3.5.3 Presentation layer
51
individual workstations, and HydroDesktop platform is missing the ability to query over arbitrary hydrologic themes. Our design system have has the ability to query certain volume of available data using OGC and GML standards and the process time is limited to gather all of the actual time series data values for larger themes from distributed data services. Web services registered at the HIS Central is unrestrained. All web services are interoperable, sustainable, and extensible by using OGC and GML standards for data exchange and community semantics. These standards provide standardised ways of manipulating the GIS data so that data can be utilised more efficiently (Shams et al., 2010; Chen et al., 2010).
52
number of modelling units per simulation is tested in the OpenMI system, the execution time may increase as a nonlinear trend may occur (Castronova et al., 2013). We summarized the result of the OpenMI model execution time stated by Castronova et al. (2013) in Table 3.1.
Table 3.1 The OpenMI model execution time varies as the number of modelling elements
Table 3.1 is the result of the large-scale loading test and illustrates how performance when the number of model elements extends into the thousands in the OpenMI model scales.
The execution time is under 1.5 second when numbers of Model elements below 7000. There is no evidence of nonlinearity in the
Number of Model Elements (103) Execution Time (Sec)
0-1 0-1
1-2 ~1.1
2-3 ~1.3
3-5 ~1.5
53
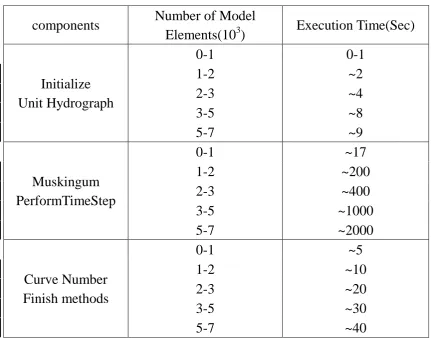
OpenMI communication itself. The component-to-component communication represents only a small fraction of the total model execution time. However, model execution time varies with different models as shown in Table 3.2 Choosing an appropriate model as component is important beyond the range of the previous test (Castronova et al., 2013). From the table 3.2 we found different components’ execution time varies. This is the major reason for time consumption. One advantage of this type of model is that the components are isolated and we can handle the computational bottlenecks by tracking the runtime of each component. Because each component is loosely coupled within the system, efforts can be made to address computational inefficiencies of a single component in isolation of the larger system. However, Khanbabaei and Asadi (2011) stated loose
coupling of services in negative side. The coupling of several
services together lowers the efficiency of the web. The
54
leads to the breakdown of the whole application. There is a
requirement that increases the accessibility of control of the
[image:71.595.81.513.237.575.2]web to prevent these breakdowns.
Table 3.2 Different components’ execution time varies as the number of modelling elements
At first, we attempted to reduce the time required to download reused data, such as those downloaded from the Hybrid maps in the VirtualEarth WMS service. Once reused data are downloaded via a web service, they are accessed as local service
components Number of Model
Elements(103) Execution Time(Sec)
Initialize Unit Hydrograph
0-1 0-1
1-2 ~2
2-3 ~4
3-5 ~8
5-7 ~9
Muskingum PerformTimeStep
0-1 ~17
1-2 ~200
2-3 ~400
3-5 ~1000
5-7 ~2000
Curve Number Finish methods
0-1 ~5
1-2 ~10
2-3 ~20
3-5 ~30
55
56
database as a part of water balance model input. The water balance model is programmed in Java; the model obtains the required data from the remote services and the local database and computes the water storage to compare it with the measured discharge in order to validate the results.
3.5.4 Specifications and protocols for supporting the design of
3O-HIS
57
to express a registry of services. Zaslavsky et al. (2007) represents one of the key requirements for a hydrologic information system is the ability to easily discover, retrieve, and interpret hydrologic time series for solving the interoperability issues between the datasets with other disparate datasets. Integrating hydrologic data across agency boundaries and combining them with an observation time series collected by multiple academic research projects has been challenging due to the extreme heterogeneity in how the different repositories are organized, described, accessed, and maintained.
3.6 Ontology in 3O-HIS
58
systems. During the processing ontology transportation, the criteria or protocol has been developed to identify the ontology for validity, classify and retrieval. It is necessary to develop concise protocols for standardization services for data interoperability. The criteria need to be in common use that the services which can meet a common criterion. Users on client face conveniently in finding suitable data to solve the semantic heterogeneities.
59
ontology development and want to establish community consensus mechanisms (Zaslavsky et al., 2007). However, the existence of huge information repositories is inconsistent created by different specifications and protocols, and prevents information flow to go further between services. For example, Zaslavsky et al. (2007) stated that the existence of huge information repositories created by traditional applications prevents information flow between the external and internal parts. After summarizing environmental modelling issues both technically and conceptually, the inconsistent issues have been one of the main bottlenecks to design modelling frameworks and component-based modelling. It is necessary that hydraulic data and modelling as services have free connection that service interface is independent implementation.
60
61
repositories and maintains ontology for synchronization with hydrologic data in repositories. These standards and structural framework necessitated towards better alignment and interaction.
3.7 Summary
This chapter presents a 3O-HIS platform and the methodology of encapsulating hydrodynamic modelling (e.g. Telemac) in 3O-HIS. A new service-oriented web application 3O-HIS which is derived from CUAHSI HIS has been developed that services interaction by full use of existing and emerging standards to aggregate heterogeneous geospatial data and observational data, and deliver rich user interface for users. This innovative way performs analysis tasks at service-side and represents results at client-side.
62
removed by fully use of SOAP, WSDL and XML standards to enable users and applications to search across a comprehensive catalog of hydrologic time series available from data repositories. Integration of hydrodynamic modelling with 3O-HIS, we need to understand the requirements in both technically and conceptually. In technical aspect, the key limitation is that models are varied and consists of different inherent codes and algorithms which are hidden. In code and preference level, inherent TELEMAC framework hardly transplant into new 3O-HIS.
63
64
Chapter 4 Data management
4.1 Introduction
65
the basis of new comprehensive infrastructures known as “cyberinfrastructure” that allow the research team to share distributed data resources through high-speed networks. Cyberinfrastructure has been developed by many activities and organizations to support the needs of multidisciplinary collaborative research, such as the National Ecological Observatory Network (NEON) (Keller et al., 2008), the Long Term Ecological Research Network (LTER) (Bain et al., 2012), the Geosciences Network (GEON) (Richard et al., 2011), Geospatial One-Stop (GOS) (Choi and Yu, 2008), and Consortium for the Advancement of Hydrologic Sciences Inc. (CUAHSI)’s Hydrologic Information System (HIS) (Maidment, 2008). And our 3O-HIS is developed based on CUAHSI HIS as a prototype.
66
usually cover U.S. ecological variability, LTER aimed at understanding processes in a wide range of ecosystems in a long-term. Geospatial One-Stop is used as geoportal to find geographic information; the prototype was the basis for the OpenGIS Portal Reference Architecture. Geoportal server used by local government consists of data of various formats. GEON is a research program for the earth science community. GEON Portal, a web-based distributed resource management system, provides integrated access to data and tools needed for knowledge discovery in the Geosciences.
67
client side or send the request information to other services depend on the data location. In addition, users also can upload the map to a service from the client side.
4.2 Major linking resource with SOA in environmental
science
SOA assists interoperation among various information resources. Different types of resources have emerged in many disciplines related environmental science, including in the solid earth sciences (The Geosciences Network, or GEON:
www.geongrid.org), ecology (The National Ecological Observatory Network, or NEON: www.neoninc. org), oceanography (The Ocean Observatories Initiative, or OOI: http://oceanobservatories.org), and atmospheric sciences (Linked Environments for Atmospheric Discovery, or LEAD:
68
database more related with ecological ecosystems, GEON is the database for the earth science. For the requirements of integration database, several systems has been developed recently such as Geospatial One-Stop (GOS) and CUAHSI HIS.
69
maintain the same or similar information because of each federal government established own standard for data collecting.
In CUAHSI HIS, HIS Central is physically composed of numerous servers and supports users to request data in ‘hydrodesktop’ clients and to get access to data through data discovery. Resource are used to define in a HIS Central service. Source schema provided by HIS Central can instance of ontologies commonly and the resources associated ontology concepts, spatial and temporal extents can be found according to a user’s query.
4.3 SOA with database
70
71
10.0 in Windows operating system. Using FORTRAN on a Linux operating system for TELEMAC calculation and service could still be consumed by a Windows client
72
73
74
running the model locally.
4.4 Challenge for design SOA with data repositories
75
76
service’s state so that it does not need to be passed to the service with each service method call.
77
78
automatic service discovery and invocation and fully machine-understandable semantic descriptions of web services are necessary to provide support for on-the-fly discovery.
4.5 Data conversion
79
implicates the requirement of conversion from a Steering file or/and a Boundary file to shapefiles.
4.5.1 Steering file conversion
80
distributed services by Java IDE.
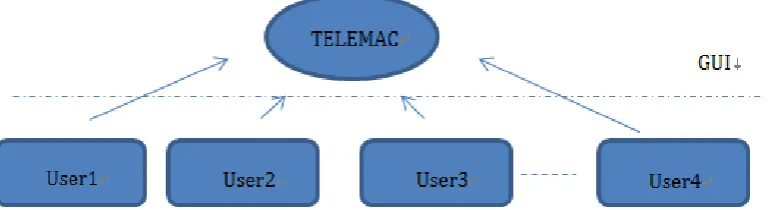
[image:97.595.108.493.391.496.2]In 3O-HIS, some parameters in Steering file may not be suitable for sharing to all users. For example, FRICTION COEFFICIENT is not appropriate to share with others because different location has different type of soil and frictional resistance is various. FRICTION COEFFICIENT parameters defined as variable type.
81
national scale analysis. The mesh is divided into several pieces; some areas with a fine mesh that researchers want to understand the environmental processing clearly such as Liverpool Bay and River Wyre in Fleetwood. And some areas may have a rough mesh; the time step may be changed in different meshes based on the complexity of topography. Therefore, it is necessary to develop a GUI interface for Steering file and Boundary file conversion.
[image:98.595.90.508.377.505.2](A): common standards or constant value for all users (B): specific value in certain service
Figure 4.2 Type of value stored in services in 3O-HIS
The function is related to the type of value stored in each service (see Figure 4.2). Common standards in (A) will be stored in SQL service and other services invoke these common standards
B A
User1 User2 User3 User4
B A B A B
82
directly under a same project. Usually the information is stored and shared in one services. It defines some specific values individually in (B), which cannot transmit to other users to ensure the services receive valid data. Because if we share the Geometry file from user1 to user2, the inconsistency between geometry file and others, such as boundary files or FORTRAN file may lead the interruption when TELEMAC model is initiated. Balancing the values stored in public or private can reduce the amount of work for data collection and facilitates using the TELEMAC model in an integrated framework for a large scale.
4.5.2 Boundary file conversion
83
be the database management system (DBMS) as the basis of the mesh database. PostgreSQL can store the geographic objects spatially and has the capability of performing complex queries and supporting various programming languages (e.g. Java).
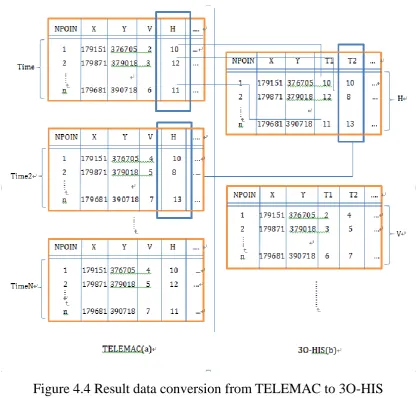
4.5.3 Result file conversion
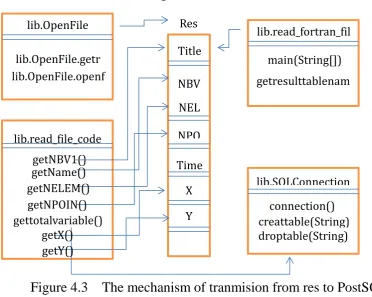
84
[image:101.595.88.461.290.587.2]indicated that a number of get functions are created for each physical variable which is linked to the item defined in res file. Most of them are mesh information such as getNELEM() is the number of elements in mesh; getNPOIN() is the number of point in mesh; getX() is the X coordinate of each point and getY() is the Y coordinate of each point.
Figure 4.3 The mechanism of tranmision from res to PostSQL Figure 4.3 shows an example which utilizes a collection of tables to represent the result of the TELEMAC and the corresponding conversion to 3O-HIS. The TELEMAC model
85
86
[image:103.595.89.506.122.520.2]Memory.
87
of array of totalvariable in container is shown in Figure 4.5. The array of totalvariable is a three-dimensional array: name of variable, number of points and the Number of time steps. NBV1 represents the name of the variable, and it determines a specific physical parameter selected for conversion. NPOIN is the value of points, and time steps are the maximum size, number of time steps for conversion. We suggested the size is no more than 200, because after 200 iterations, the array of totalvariable is bloated and time consuming. The default of iterations is 150, after 150 times, the value in the array of totalvariable will link the lib.SQLConnection and write into PostSQL. After this, the container is clean for next 150 iterations. This design in newly 3O-HIS is suitable for data storage and avoid out of Java Heap Memory.
88
4.5.4 Data transmission
Data transmission uses a uniform standard: XML that each distributed services can store geospatial data, semantic descriptions and geoprocessing service chains based on it. Based on the instructions, users can distribute meshes in different computers through web servers under the framework of 3O-HIS.
4.6 Key input files stored in service
4.6.1 Geometry file
89
2005). Topographic maps are provided by Marine Digimap (EDINA), The Bathymetry & Elevation (BE) have been used which describe the natural shape of the Earth’s surface of land and under the sea and includes height contours and digital elevation models. The coastal line gaps existing in the DEM, in the sea levelling system the reference of the depth data approximates to LAT, for land survey datum the reference of depth data related Ordnance Datum (Newlyn) which is the point of origin corresponds to the average value of Mean Sea Level (MSL) at Newlyn during the years 1915 to 1921 (EDINA) were used. The difference between two data sources were adjusted by manual editing.
4.6.2 Hydrodynamic models
90
specific benchmark events (Battjes and Gerritsen, 2002). The accuracy of the result depends on the detailed hydrodynamic models and conditions such as boundary conditions and the interpretation of hydraulic roughness and bottom topography from bathymetric surveying. Potentially, an accurate result requires a detailed description of initial boundary conditions and computational mesh. It is computational and complex that models iterate over successive time-steps using differential flow equations across the mesh. In hydrodynamic models with GIS fields, simpler finite-difference (raster) models have been developed and Bates and de Roo (2000), Horritt and Bates (2001) stated that raster models were quicker than finite-element models.
91
elevation of around 8 cells. The simple raster model takes advantage of Geographical Information Systems (GIS) which can provide an effective framework to integrate and analyse disparate environmental data sources, especially more general methods of strategic flood-risk assessment can be processed over larger areas. However the accuracy of inundation map produced by simple raster model is not as good as numeric 2D or 3D hydrodynamic models. Thus, Thumerer et al. (2000) developed another way that identifies of distinctive flood characteristics within a vector GIS. This approach can easily identify some hydraulic characteristics such as velocity, depth, features represented by points. However points, lines and polygons are difficult to represent spatial patterns in flooding.
92
spatial patterns in flooding with an appropriate resolution especially for larger areas for assessing flood risk. This chapter will explain in detail how to deploy the 3O-HIS by understanding the case study of flood risk assessment in Blackpool.
93
4.7 Summary
94
synchronized.
95
Chapter 5 Application
5.1 Introduction
This chapter presents the applications of GIS in water resources and hydrological modelling. Two Case studies: Blackpool in England and Demra in Bangladesh are presented to implicate the benefits that integrate GIS and hydrodynamic modelling in 3O-HIS platform. Assessment between GIS and hydrodynamic results under web services indicate a promising future for GIS application in hydrological modelling.
96
3O-HIS are discussed in section 5.4. Section 5.5 shows case studies such as Blackpool in England, and Demra in Bangladesh for a better understanding of the advantages of integrating GIS and hydrological models in section 5.6. Section 5.7 comparing the other open standard GIS with commercial GIS, it represents the interoperability of 3O-HIS for large distributed data analysis and modelling. Finally a summary reviewed in section 5.8.
5.2 Current states of GIS with Hydrological Modelling
97
in various fields of study. Water Resource Engineering indeed needs to present modelling and analysing spatially distributed data with different spatial resolutions (spatially and temporally distributed). Therefore, GIS is indeed a suitable tool for solving water resources problems.
98
issue was large datasets exchanging inefficiently between services in WWW platform. The issue becomes more complex when the hydrodynamic model and the mesh need a very fine resolution for consideration of different scenarios such as various boundary conditions, sea level rise and economy-societal factors (e.g. land use, cost of buildings).
99
orientation linked to GIS. The desire of creating 3O-HIS is establishing an interactive system that heterogeneity of data can be discovered from more than one observatory and hydraulic model as an encapsulated component.
5.3 User guide of 3O-HIS
In this section, a general user guide has been written for discussing how to use 3O-HIS. Lot of efforts has been made in deployment of services in 3O-HIS, to ensure other researchers can follow the deployment for creating their own hydraulic model-GIS system, there is a requirement to represent a guide including how to deployment services in 3O-HIS. The features of data in 3O-HIS can be interoperation, communication, and publication ultimately present Telemac modelling encapsulated as services.
100
preparation for input. And how to deploy the services is discussing in section 5.3.2. Finally GUI of 3O-HIS discussed in section 5.3.3.
5.3.1 Installation
For successfully managing, analysing, and publishing results of numerical models, particularly in cases when the datasets are extremely large, software which needs to install to set up the environment for services deployment is listed below.
Tomcat (test version 6.0.35) WPS-52n
Notepad++( http://notepad-plus-plus.org/ ) Geoserver (Optional)
Eclipse (Optional)
101
software implementation of the Java Servlet and JavaServer Pages (http://tomcat.apache.org/) for the client/service environment. WPS-52n is one of WPS applications for services processing (http://52north.org). Notepad++ is a free code editor which we use it for editing XML, GML and js5 files. Geoserver is a web service with OpenGIS specifications. Eclipse is a platform for Java and plug-in development plus adding new plugins. Before we test many brewers as client, Foxfire browser is the best one that has less client response times and the feature of ‘fire bug’ can have a debugging during the design step.
The mechanism of processing flow with software is shown in Figure 5.1. An assumption of software installed successfully which bundles Tomcat (6.0.32) and WPS-52n in services. Tomcat is used to deploy WPS online and WPS-52n provides
102
[image:119.595.114.513.167.347.2]the method to processing geographic features. A processing flow has been charted for understanding the relationship between software, as shown in shown in Figure 5.1
Figure 5.1 The processing flow of 3O-HIS
From the Figure 5.1, each software has own function in specific place in the chart. The orange colour box represents the general architectural and procedural components which include the following: 1) data observation infrastructure which collects observations by the sensors and telemetry systems. 2) Data storage represents data systems and software required for creating a persistent repository. 3) quality assurance is the processing that transitioning from raw data to publishable data
Observation
Quality Data storage Interoperabili
Presentation
Geoserver Notepad++
103
104
formats. Using Openlayer code for deploying hydrodynamic parameters on services. There is an example for deploying Blackpool vector map on Geoserver and representing on Openlayer, it shows in the line:
var Blackpool _2002_shp = new OpenLayers.Layer.Vector("Blackpool _2002_shp ", {
projection: new OpenLayers.Projection("EPSG:4326"),
strategies: [new OpenLayers.Strategy.BBOX()],
protocol: new OpenLayers.Protocol.WFS({
url: "http://localhost:8081/geoserver/WPS_Water_Discharge/wfs",
featureType: " Blackpool _shp",
featureNS: "http://www.opengeospatial.net/WPS_Water_Discharge",
version: "1.0.0",formatOptions: {outputFormat: 'GML3'},outputFormat: "GML3",
readFormat: new OpenLayers.Format.GML.v3(gmlOptionsIn)})
});
For successfully processing the version of Openlayer need to be defined that index.html file in the folder (apache-tomcat-6.0.35\webapps) needs to modify and change the line:
<script type="text/javascript" src="http://openlayers.org/api/OpenLayers.js"></script>
to
<script type="text/javascript" src="http://openlayers.org/api/2.9.1/OpenLayers.js"></script>
105
[image:122.595.91.507.232.488.2]have a numerical processing between services. In Eclipse, the polygon output (Geometries) are created using GML2 standard. In GML2 standard, the tag pair of the_geom use to store the polygon geometry as shown in Figure 5.2.
106
[image:123.595.94.502.275.590.2]geographic features. After the Geometry stored in services, the topological information can be retrieved from any location or remote computer under the framework of 3O-HIS. In Figure 5.3, polygon features are represented as the agricultural areas in 2002.
Figure 5.3 Display of Catchment area using 52°North WPS
5.3.2 Using the 3O-HIS
107
[image:124.595.95.504.311.539.2]linkage the results and geographical features. Setting appropriate parameters for running hydraulic models. The Shapefile is composed of geospatial vector data in 3O-HIS. Mesh files and boundary covers shapefiles and some physical parameters such as boundary files stored in PostSQL. A Shapefile usually stores geospatial vector data format.
Figure 5.4 GUI for TELEMAC
108
109
[image:126.595.107.490.127.497.2]physical parameters values.
[image:126.595.94.504.487.702.2]Figure 5.5 GUI of hydraulic model linking with 3O-HIS
110
Figure 5.7 GUI for TELEMAC (Options tag)
111
112
[image:129.595.93.502.350.646.2]analysis, boundary type has been identified for each boundary node. Therefore, ArcGIS can recognize the boundary type itself. For example, boundary node located at water levels defining open boundary node. In contrast, at the land boundary, the water level should remain zero all the time. In Figure 5.9 the open boundary nodes display as black colour and land boundary nodes show as cyan colour.
113
Figure 5.9 SQL statement – shapefiles
[image:130.595.103.494.327.680.2]