A Fast Method to Measure the
Volume of a Large Cavity
QIAN XU1, YI HUANG1, (Senior Member, IEEE), LEI XING1, ZHIHAO TIAN1, ZHOUXIANG FEI1, AND LIUJI ZHENG2
1Department of Electrical Engineering and Electronics, University of Liverpool, Liverpool L69 3GJ, U.K. 2Guangzhou Shipyard International Company Ltd., Guangzhou 510382, China
Corresponding author: Y. Huang ([email protected])
ABSTRACT How to quickly and accurately measure the volume of a large cavity is challenging. This paper presents an efficient method to measure the volume of a large conducting cavity. The proposed method is based on statistical wave theory. By measuring theQfactor in the time and frequency domains, the volume of the cavity can be extracted. In the time domain, theQfactor can be extracted directly from the time domain response, while in the frequency domain, theQfactor depends on the volume of the cavity and the transferred power; the transferred power can be measured directly. By correcting the frequency domainQ with the radiation efficiency of antennas, theQfactors obtained from both the time and frequency domains are equal in a well-stirred chamber; this provides an opportunity to measure the volume of the cavity. Measurements are conducted to verify the proposed method. Although the measurement is conducted using electromagnetic waves, acoustic waves can also be used; in this case, the approach can be applied to any cavity, not limited to a conducting cavity. The advantages and the limitations of the proposed method are also discussed.
INDEX TERMS Cavity volume measurement, statistical electromagnetics, statistical acoustics.
I. INTRODUCTION
In the shipbuilding industry, to measure the volume/capacity of a ship hold is important and useful. Once the available volume and weight are known, the cargos to be shipped can be optimised to maximise the efficiency/benefit of the shipment. And another application is, after a ship was built or modified, the available volume need to be measured to make sure that it is the same as expected. It is easy to obtain the weight information from the draft marks on the bow of a ship. However, the volume information below the deck is not easy to measure because of the complex environment. Conventionally, a laser is used to build a 3D model and the volume can be calculated from the 3D model which is time consuming and expensive [1]. Moreover, inside structures like tubes and stairs need to be removed to make sure that the laser can be applied. Similarly, the same problem exists in measuring the available volume of a large granary or storehouse (Fig. 1). Since the inner structure can be complex and irregular, conventional measurement methods could be hard to implement.
[image:1.576.305.528.455.665.2]In this paper, we present a new and efficient method to measure the volume of an electrically large conducting cavity using electromagnetic waves; the method can be applied not
FIGURE 1. Volume measurement requirement in practice.
Qfactor in both the time and frequency domains, the volume of the cavity can be obtained. However, we need to know the total efficiency of the transmitting (Tx) and receiving (Rx) antennas, which can be measured in a cavity with a known volume (as a calibration process). Although the measurement is done using electromagnetic waves in this paper, acoustic waves can also be used, and the cavity does not need to be metallic.
The paper is organised as follows: the theory of the proposed method is first introduced in Section II; Section III presents the measurement conducted in a rever-beration chamber (RC) to verify the proposed method and finally discussion and conclusions are given in Section IV.
II. THEORY
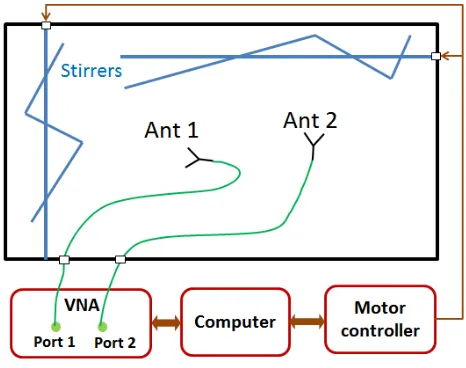
[image:2.576.41.274.417.601.2]Recently, Hollowayet alproposed three methods to measure the radiation efficiency of antennas in an RC without using a reference antenna [2]. We have found that this theory can also be applied to the volume measurement when the radiation efficiencies of antennas are known. A typical two-antenna measurement setup is shown in Fig. 2. The stirrers in the RC are driven by step motors, for each stirrer position, the S-parameters are collected by using a vector network analyser (VNA) and saved in a computer. In practice we may not have stirrers, but the source stirred approach can be applied [3]; we can use one antenna at various positions/orientations or a MIMO (multiple-input and multiple-output) antenna array.
FIGURE 2. Measurement setup in an RC.
TheQfactor in a cavity is defined as the ratio of the stored energy to the dissipated energy per cycle; the energy can be acoustic or electromagnetic
Qdef=2π Stored energy
Dissipated energy per cycle. (1)
Like Friis equation in free space, Hill’s equation reveals the relationship between the transmission coefficient and the Qfactor in a rich isotropic multipath (RIMP) environment.
We denote it as the frequency domainQFD[2], [4]
QFD=CRCh|S21|2i (2)
where S21 is the transmission coefficient, hi means the
average value using any stirring method (e.g. mechanical stir, frequency stir, polarisation stir, source stir, etc.),CRC is the chamber constant
CRC= 16π2V
λ3 (3)
V is the volume of the cavity, and λ is the free-space wavelength. It should be noted that (2) is accurate if both antennas are ideal antennas (well-matched, no line-of-sight, 100% total efficiency). If we consider the antenna effi-ciency, and the line-of-sight component, the correctedQFD becomes [2]
QFDCor =
CRCh|S21,s|2i
η1totη2tot
(4)
whereS21,sis the stirred part of theS-parameter [2]
S∗,s=S∗− hS∗i (5)
η1tot andη2tot are the total efficiency (having taken the loss and impedance matching into account) of antenna 1 and antenna 2 respectively. This measurement method has been widely used to extract the absorbing cross section of an object under test [5], [6].
Meanwhile, theQ factor can be obtained from the time domain [2]
QTD=ωτ (6)
whereτ is the decay time constant of the cavity, ωis the angular frequency. To reduce the measurement error,τ can be measured with different stirrer positions (source positions) and then averaged, thusτcan be replaced ashτi. It should be noted that it is not necessary to measure it directly in the time domain since the time domain response can be obtained from the inverse Fourier transform from the frequency domain response.
If the cavity is well-stirred (the field in the cavity is statistically uniform), the two Q factors (4) and (6) are equal [2],QFDCor =QTD, thus the volume of the cavity can be obtained as
V = λ
2c
0hτiη1totη2tot
8πh|S21,s|2i
= λ
2c
0hτiη1totη2tot
8πh|S21− hS21i|2i
(7)
wherec0is the speed of light in free space (3×10⁸m/s).
It can be seen that, if we know the total efficiency of the Tx and Rx antennas, we only need to measure the averaged
τ value andS21to obtain the volume value.
The proposed method can also use the one-antenna approach [2]. If the cavity is well-stirred, the enhanced backscatter constant [2], [7]
eb=
q
h|S11,s|2ih|S22,s|2i
.
If only one antenna is used,h|S11,s|2i = 2h|S21,s|2i[2], [7], (7) can be rewritten as
V = λ
2c 0hτiηitot2
4πh|Sii,s|2i
= λ
2c 0hτiη2itot
4πh|Sii− hSiii|2i i
=1or2 (9)
This can further simplify the measurement system, but more stirrer positions may need to realiseeb=2. In practice, it may not be easy to realise a well-stirred cavity and could increase the measurement error.
III. MEASUREMENT IN AN RC
In this section, we calibrate the total efficiency of antennas using an RC with known volume, and then we change the environment: load the RC using radio absorbing materials (RAMs), open the door of the RC. After the envi-ronment is changed we repeat the measurement to validate the proposed method.
A. CALIBRATION PROCESS
[image:3.576.300.536.65.214.2]The measurement scenario is shown in Fig. 3, two horn antennas are used as antenna 1 (Rohde & SchwarzR HF 906) and antenna 2 (SATIMOR SH2000). 100 stirrer positions with 3.5 degrees/step are used. At each stirrer position, 10001 frequency points are collected in the frequency range of 2.8 GHz to 4.2 GHz. The volume of the RC is 3.6 m×4 m×5.8 m=83.52m3.
FIGURE 3. Calibration measurement in an RC.
If we use the two-antenna method in (7), the measured QFDin (2) is given in Fig. 4, at each frequency a frequency stir/window with 100 nearest frequencies are used.
Note QFD is not accurate when the total efficiency of antennas are not excluded (QFD andQTD are not the same when the total efficiencies of antennas are not 100%), butQTD is not affected by the total efficiency of antennas. We need to knowQTDto obtainη1totη2tot[2]
η1totη2tot = QFD QFDCor =
QFD
QTD (10)
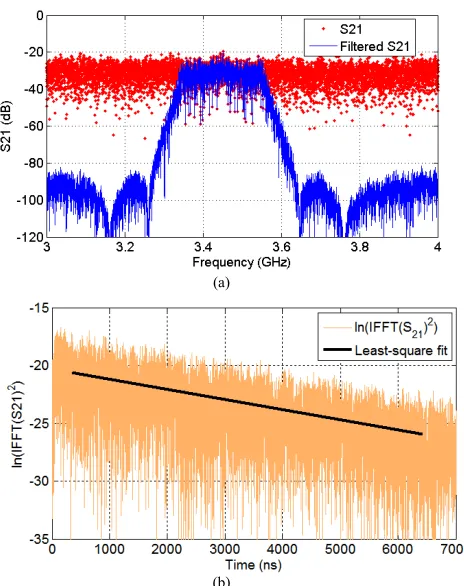
[image:3.576.300.532.251.544.2]In the time domain, the power in the cavity decays exponentially and follows P0e−t/τ where τ is the decay
[image:3.576.43.271.388.552.2]FIGURE 4. MeasuredQFDin the calibration process.
FIGURE 5. τextraction procedure. (a) measuredS21and filteredS21; (b) time domain response:ln(IFFT(S21)2) and least-square fit.
FIGURE 6. Averagedτ(black line) andτwith different stirrer positions (light lines) in calibration process.
[image:4.576.40.275.69.207.2]FIGURE 7. MeasuredQTDin the calibration process.
FIGURE 8. Calibratedη1totη2totin the calibration process.
the centre frequency of the filter, τ with different center frequencies are obtained (Fig. 6) [9], the averagedτ is used to calculateQTD(Fig. 7). Finally,η1totη2tot can be obtained using (10) and shown in Fig. 8.
B. MEASUREMENT PROCESS
After the calibration process is finished,η1totη2totis obtained, and can be used to measure other cavities. OnlyS21 andτ
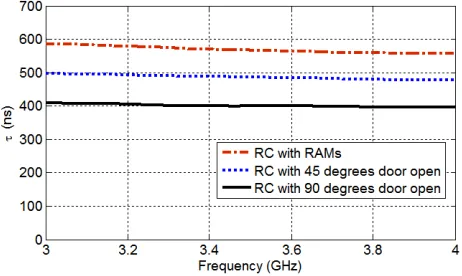
[image:4.576.41.275.251.395.2]in (7) need to be measured. To validate the pro-posed method, we change the environment: load the RC with RAMs, open the door with 45 degrees and 90 degrees
FIGURE 9. Measurement scenarios. (a) RC loaded with RAMs, (b) RC with 45 degrees door open, (c) RC with 90 degrees door open.
FIGURE 10. Measuredτin three scenarios.
(shown in Fig. 9 respectively). In practice, it may have an entrance without a conducting door, so we open the door to emulate an imperfect cavity.
[image:4.576.41.274.431.571.2] [image:4.576.303.534.494.632.2]FIGURE 11. Measuredh|S21,s|2iin three scenarios.
FIGURE 12. Measured volume value in three scenarios using two-antenna method.
FIGURE 13. Measured volume value in three scenarios using antenna 1 only.
Finally we apply (7) to obtain the volume of the cavity, shown in Fig. 12. The whole calibration and measurement procedure are also repeated by using one antenna format (9), results are shown in Fig. 13 and Fig. 14 respectively.
[image:5.576.39.274.242.382.2]It should be noted that, in practice we may not have stirrers to change the field distribution in the cavity, but source stir [3] and frequency stir are also applicable. To verify it, we keep the stirrers steady; mount antenna 2 on a rotation platform (shown in Fig. 15) and 100 platform rotation angles with 3.5 degrees/step are used. The whole calibration and measurement procedure are repeated, results are given
[image:5.576.325.509.243.428.2]FIGURE 14. Measured volume value in three scenarios using antenna 2 only.
FIGURE 15. Antenna 2 mounted on a rotation platform as a source stirrer.
FIGURE 16. Measured volume value in three scenarios using source stir and two-antenna method.
in Fig. 16 and Fig. 17. Note antenna 1 is not rotated, results from antenna 1 only is not available.
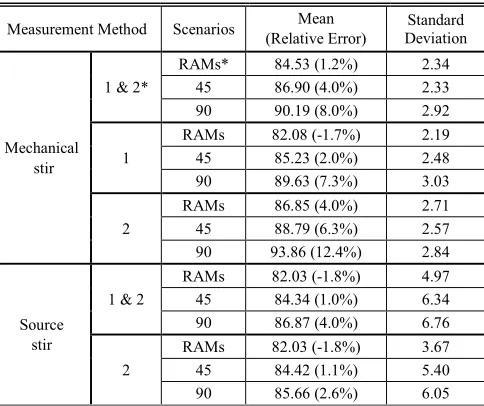
The results are summarised in Table 1 and discussed in the next section.
IV. DISCUSSION AND CONCLUSIONS
[image:5.576.40.274.424.562.2] [image:5.576.302.533.461.599.2]FIGURE 17. Measured volume value in three scenarios using source stir and antenna 2 only.
TABLE 1. Summarised measurements results.
is large compared with the wavelength of the used electro-magnetic/acoustic wave. The method is non-destructive and the system can be assembled as a portable volume probe to measure large cavities like ship, granary and storehouse. The measurement can be real-time and the shape of the cavity can be arbitrary (complex shape has better field uniformity). After the measurement system is calibrated, only τ and S-parameters need to be measured. Measured volume values in the frequency range of 3 GHz∼4 GHz are summarised in Table 1.
It is interesting to note that, although the proposed method does not depend on theQfactor of the cavity. Results from a small Q cavity tend to have a larger standard deviation. This is easy to understand, when the Qfactor reduces, the environment degrades from RIMP to free space, and the trans-mission coefficient becomes highly dependent on the antenna patterns, orientations, and the distance between antennas
(from Hill’s equation to Friis equation). Thus, it is hard to realise a well-stirred cavity and could have a large error if the measurement sample number is small (narrow band antenna). A wideband antenna/broadband frequency sweep is better.
The relative error is calculated from the deviation from 83.52m3. It can be found that when the door is open (from 45 degrees to 90 degrees), the measured volume is larger than the real value. This is because when the door is open, we have an equivalent larger cavity. This means the uncovered apertures could lead the measured volume larger than the real value. In this measurement the area of the door is 1.94 m2 (1.6% of the surface area of the inner walls). Theoretically, the RAMs have occupied a certain volume, we can see from the results of the source stir in Table 1, the measured volumes for the RC with loaded RAMs are indeed smaller, but it is not clear from the results for the mechanical stir. This may be due to the total volume of RAMs used is too small (∼0.1m3) to be sensed accurately.
For one-antenna method in (9), the condition ofeb = 2 should be met. If we compare the results from antenna 1 and antenna 2 in the mechanical stir, it can be found that the results from antenna 2 have a larger error than antenna 1, this should be due to the error fromeb, because the S-parameters are recorded in the same environment and system configuration. There is an equation similar to Hill’s equation in acoustics; we can also use sound/supersonic waves to detect the volume of a cavity (no longer limited to metallic cavities). A more general form can be written as
V =CFλ
2hτi
hTsi (11)
whereCFis the calibration factor which can be determined by using a cavity with known volume,λis wavelength (electro-magnetic or acoustic wave),hTsiis the averaged stirred power transfer function,hτi is the averaged decay time. In room acoustics, it can be converted from the 60 dB reverberation time (RT60) withτ =RT60/(6ln10) [10].
It should be noted that the method has its own limitations. Although the method is independent onQfactor, it is hard to realise a statistical uniform field in lowQcavities. Another issue is if the cavity is partially filled with liquid or dielectric materials either absorb or reflect waves completely (inhomo-geneous cavity), the wave velocity is changed which could increase the measurement error. How the inhomogeneous materials affect the results could be very complex. Future work may include on-site measurements and validation.
REFERENCES
[1] S. S. Bhat and D. J. Smith, ‘‘Laser and sound scanner for non-contact 3D volume measurement and surface texture analysis,’’ Physiological Meas., vol. 15, no. 1, pp. 79–88, 1994.
[2] C. L. Holloway, H. A. Shah, R. J. Pirkl, W. F. Young, D. A. Hill, and J. Ladbury, ‘‘Reverberation chamber techniques for determining the radi-ation and total efficiency of antennas,’’IEEE Trans. Antennas Propag., vol. 60, no. 4, pp. 1758–1770, Apr. 2012.
[image:6.576.40.282.267.470.2][4] D. A. Hill, M. T. Ma, A. R. Ondrejka, B. F. Riddle, M. L. Crawford, and R. T. Johnk, ‘‘Aperture excitation of electrically large, lossy cavi-ties,’’IEEE Trans. Electromagn. Compat., vol. 36, no. 3, pp. 169–178, Aug. 1994.
[5] G. Gradoni, D. Micheli, F. Moglie, and V. M. Primiani, ‘‘Absorbing cross section in reverberation chamber: Experimental and numerical results,’’
Prog. Electromagn. Res. B, vol. 45, pp. 187–202, Oct. 2012.
[6] U. Carlberg, P.-S. Kildal, A. Wolfgang, O. Sotoudeh, and C. Orlenius, ‘‘Calculated and measured absorption cross sections of lossy objects in reverberation chamber,’’IEEE Trans. Electromagn. Compat., vol. 46, no. 2, pp. 146–154, May 2004.
[7] J. M. Ladbury and D. A. Hill, ‘‘Enhanced backscatter in a reverberation chamber: Inside every complex problem is a simple solution struggling to get out,’’ inProc. IEEE Int. Symp. Electromagn. Compat., Jul. 2007, pp. 1–5.
[8] E. Amador, C. Lemoine, P. Besnier, and A. Laisné, ‘‘Reverberation cham-ber modeling based on image theory: Investigation in the pulse regime,’’
IEEE Trans. Electromagn. Compat., vol. 52, no. 4, pp. 778–789, Nov. 2010. [9] E. Genender, C. L. Holloway, K. A. Remley, J. M. Ladbury, G. Koepke, and H. Garbe, ‘‘Simulating the multipath channel with a reverberation chamber: Application to bit error rate measurements,’’ IEEE Trans. Electromagn. Compat., vol. 52, no. 4, pp. 766–777, Nov. 2010. [10] M. Kleiner and J. Tichy,Acoustics of Small Rooms. Boca Raton, FL, USA:
CRC Press, 2014.
QIAN XU received the B.Eng. and M.Eng. degrees from the School of Electronics and Infor-mation, Northwestern Polytechnical University, Xi’an, China, in 2007 and 2010, respectively. He is currently pursuing the Ph.D. degree in electrical engineering with the University of Liverpool, U.K.
He was an RF Engineer in Nanjing, China, in 2011, and an Application Engineer with CST, Shanghai, China, in 2012. His current research interests include statistical electromagnetics, computational electromagnet-ics, reverberation chamber, and anechoic chamber.
YI HUANG (S’91–M’96–SM’06) received the B.Sc. degree in physics from Wuhan University, China, the M.Sc. (Eng.) degree in microwave engi-neering from NRIET, Nanjing, China, and the D.Phil. degree in communications from the Uni-versity of Oxford, Oxford, U.K., in 1994.
He was a Research Fellow with British Telecom Labs in 1994, and then joined the Department of Electrical Engineering and Electronics, University of Liverpool, U.K., as a Faculty Member in 1995, where he is currently a Full Professor of Wireless Engineering, the Head of the High Frequency Engineering Research Group, and the M.Sc. Program Director. He has been conducting research in the areas of wireless communi-cations, applied electromagnetics, radar, and antennas for the past 25 years. His experience includes three years with NRIET as a Radar Engineer and various periods with the University of Birmingham, U.K., the University of Oxford, and the University of Essex, U.K., as a member of the Research Staff. He has authored over 200 refereed papers in leading international journals and conference proceedings, and the popular book entitledAntennas: From Theory to Practice(Wiley, 2008). He has received many research grants from research councils, government agencies, charity, EU, and industry, acted as a Consultant to various companies, and served on a number of national and international technical committees.
Prof. Huang has been an Editor, an Associate Editor, or a Guest Editor of four international journals. He has been a Keynote/Invited Speaker and an Organizer of many conferences and workshops (e.g., the IEEE iWAT 2010, WiCom 2006 and 2010, and LAPC 2012). He is the Editor-in-Chief of
Wireless Engineering and Technology, a U.K. National Rep of European COST-IC1102, an Executive Committee Member of the IET Electromag-netics PN, and a fellow of IET in U.K.
LEI XING received the B.Eng. and M.Eng. degrees from the School of Electronics and Infor-mation, Northwestern Polytechnical University, Xi’an, China, in 2009 and 2012, respectively. She is currently pursuing the Ph.D. degree in electri-cal engineering with the University of Liverpool, U.K.
Her current research interests include water antennas, hand-portable antennas, and reconfig-urable antennas. She received the Best Student Paper Award at the Fifth U.K./European-China Workshop on Millimeter Waves and Terahertz Technologies in 2012.
ZHIHAO TIAN received the B.Sc. degree in optic information science and technology and the M.Eng. degree in high power microwave tech-nology from the National University of Defence Technology, Changsha, China, in 2011 and 2013, respectively. He is currently pursuing the Ph.D. degree in electrical engineering with the University of Liverpool, U.K.
ZHOUXIANG FEI received the B.Eng. degree in electronics and information engineering from Northwestern Polytechnical University, Xi’an, China, in 2012, and the M.Sc. (Hons.) degree in wireless communications from the University of Southampton, Southampton, U.K., in 2013. He is currently pursuing the Ph.D. degree with the University of Liverpool, Liverpool, U.K.
His research interests include electromagnetic compatibility, signal integrity, uncertainty quan-tification, variational analysis, and variable length error correction coding.
LIUJI ZHENGreceived the B.Eng. degree from the School of Naval Architecture and Ocean Engineer-ing, Huazhong University of Science and Technol-ogy, Wuhan, China, in 2007.