This is a repository copy of
Detection of a period decrease in NN Ser with ULTRACAM:
evidence for strong magnetic braking or an unseen companion
.
White Rose Research Online URL for this paper:
http://eprints.whiterose.ac.uk/144717/
Version: Published Version
Article:
Brinkworth, C.S., Marsh, T.R., Dhillon, V.S. orcid.org/0000-0003-4236-9642 et al. (1 more
author) (2006) Detection of a period decrease in NN Ser with ULTRACAM: evidence for
strong magnetic braking or an unseen companion. Monthly Notices of the Royal
Astronomical Society, 365 (1). pp. 287-295. ISSN 0035-8711
https://doi.org/10.1111/j.1365-2966.2005.09718.x
This article has been accepted for publication in Monthly Notices of the Royal Astronomical
Society © 2005 The Authors. Published by Oxford University Press on behalf of the Royal
Astronomical Society. All rights reserved.
[email protected]
https://eprints.whiterose.ac.uk/
Reuse
Items deposited in White Rose Research Online are protected by copyright, with all rights reserved unless
indicated otherwise. They may be downloaded and/or printed for private study, or other acts as permitted by
national copyright laws. The publisher or other rights holders may allow further reproduction and re-use of
the full text version. This is indicated by the licence information on the White Rose Research Online record
for the item.
Takedown
If you consider content in White Rose Research Online to be in breach of UK law, please notify us by
Detection of a period decrease in NN Ser with ULTRACAM: evidence
for strong magnetic braking or an unseen companion
C. S. Brinkworth,
1,2⋆
T. R. Marsh,
3V. S. Dhillon
4and C. Knigge
21Spitzer Science Center, California Institute of Technology M/C 220-6, 1200 E. California Blvd, Pasadena, CA 91125, USA
2Department of Physics & Astronomy, University of Southampton, Highfield, Southampton, SO17 1BJ
3Department of Physics, University of Warwick, Coventry, CV4 7AL
4Department of Physics & Astronomy, University of Sheffield, Sheffield, S3 7RH
Accepted 2005 October 5. Received 2005 September 2; in original form 2005 July 12
A B S T R A C T
We present results of high time resolution photometry of the eclipsing pre-cataclysmic vari-able NN Ser. NN Ser is a white dwarf/M dwarf binary with a very low-mass secondary star (∼0.2 M⊙). We observed 13 primary eclipses of NN Ser using the high-speed CCD cam-era ULTRACAM and derived times of mid-eclipse, from fitting of light-curve models, with uncertainties as low as 0.06 s. The data show that the period of the binary is decreasing, with an average rate of ˙P = (9.06±0.06)×10−12s s−1, which has increased to a rate of
˙
P =(2.85±0.15)×10−11s s−1over the last 2 yr. These rates of period change appear dif-ficult to reconcile with any models of orbital period change. If the observed period change reflects an angular momentum loss, the average loss rate ( ˙J =1.4±0.6×1035erg) is con-sistent with the loss rates (via magnetic stellar wind braking) used in standard models of close binary evolution, which were derived from observations of much more massive cool stars. Observations of low-mass stars such as NN Ser’s secondary predict rates of∼100 times lower than we observe. The alternatives are either magnetic activity-driven changes in the quadrupole moment of the secondary star (Applegate’s mechanism) or a light traveltime effect caused by the presence of a third body in a long (∼decades) orbit around the binary. We show that Ap-plegate’s mechanism fails by an order of magnitude on energetic grounds, but that the presence of a third body with mass 0.0043<M3 <0.18 M⊙and orbital period 30< P3 <285 yr could account for the observed changes in the timings of NN Ser’s mid-eclipses. We conclude that we have either observed a genuine angular momentum loss for NN Ser, in which case our observations pose serious difficulties for the theory of close binary evolution, or we have detected a previously unseen low-mass companion to the binary.
Key words: binaries: eclipsing – stars: evolution – stars: fundamental parameters – stars:
individual: NN Ser – planetary systems.
1 I N T R O D U C T I O N
The evolution of close binary systems is governed by angular mo-mentum (AM) loss, driven by a combination of gravitational radi-ation (Kraft, Matthews & Greenstein 1962; Faulkner 1971), which is dominant for periodsPorb<3 h, and magnetic braking (Verbunt & Zwaan 1981), which dominates forPorb>3 h. Gravitational ra-diation is relatively well understood, with the AM loss rates simply governed by the masses and separation of the components of the binary system. Magnetic braking, however, is a more complicated issue. The mechanism is driven by the magnetic field and stellar
⋆E-mail: [email protected] (CSB)
wind of one of the binary components. As mass is driven off in the stellar wind, the ionized particles are forced to corotate with the field lines out to the Alfv´en radius. This draws AM away from the star, effectively exerting a braking force to slow its spin. In close binaries, the donor star is tidally locked to the primary, so the AM loss cannot act to slow the spin period of the secondary alone. In-stead, the AM is drawn from the binary orbit, causing it to shrink and the orbital period of the binary to decrease. The rate of AM loss by magnetic braking is governed by the mass, radius and AM of the magnetically active star, but there is also evidence to suggest that the AM loss rate saturates for low-mass stars above a certain value of AM (Sills, Pinsonneault & Terndrup 2000). This has led to a major revision in magnetic braking loss rates for binaries with low-mass secondaries, such as cataclysmic variables (CVs).
D
o
w
n
lo
a
d
e
d
fro
m
h
ttp
s:
//a
ca
d
e
mi
c.
o
u
p
.co
m/
mn
ra
s/
a
rt
icl
e
-a
b
st
ra
ct
/3
6
5
/1
/2
8
7
/1
0
7
9
6
4
7
b
y
U
n
ive
rsi
ty
o
f S
h
e
ffi
e
ld
u
se
r
o
n
0
8
A
p
ri
l 2
0
1
288
C. S. Brinkworth et al.
CV stars are mass-transferring binary systems comprising a white dwarf primary and a low-mass main-sequence secondary. The ma-jority have orbital periods between 1.3 and 10 hr, and their evolution is governed, as with all close binaries, by AM loss from the system (see Warner 1995, for a comprehensive review). CVs are useful for testing close binary evolution as any theory is constrained by two major features in the distribution of CV periods: the period gap and the value of the period minimum. The period gap is a dearth of systems with periods between 2 and 3 hr. Standard CV theory explains this gap by assuming that magnetic braking is cut-off at
P ∼ 3 h as the secondary becomes fully convective (there is no longer a radiative/convective boundary to anchor the magnetic field, so it either dissipates or is rearranged, resulting in a lowered stellar wind). Mass transfer ceases until the system evolves to a period of
∼2 h and gravitational radiation becomes strong enough to drive mass transfer, repopulating the period distribution below the gap.
The value of the minimum period is governed entirely by the AM loss rate for short-period systems. Under the standard theory, systems below the period gap are driven by gravitational radia-tion alone, which implies that the minimum period should be at
Pmin=1.1 h. In fact, the observed cut-off is at aboutPmin≃1.3 h, suggesting that gravitational radiation alone is not strong enough to reproduce the observed value ofPmin.
The standard model was developed by extrapolation from studies of braking rates of solar-type stars in clusters (Rappaport, Verbunt & Joss 1983; Spruit & Ritter 1983). However, a recent dramatic increase in the amount of data available for stars in these clus-ters (see Krishnamurthi et al. 1997; Stauffer et al. 1997; Reid & Mahoney 2000, for reviews) has shown that this extrapolation to lower masses appears to be totally wrong – low-mass stars retain more of their AM than their higher mass counterparts. This means that the new suggested ˙J is anything between 10 and 104 times smaller than assumed in the majority of CV studies. Importantly, there is also no evidence for a cut-off in magnetic braking as the secondary becomes fully convective (Andronov, Pinsonneault & Sills 2003), so the new data offer no explanation for the existence of the period gap.
We therefore need a way to directly measure the AM loss rates of CVs in order to test the standard versus reduced magnetic braking models. One way of doing this is to measure mid-eclipse timings of eclipsing binary systems to find the period change of the system and calculate the AM loss. The period changes are tiny – of the order of 5×10⁻⁴s yr−1– so this is difficult to do in CVs due to contamination of the light curve by the accretion processes. In order to overcome this problem, we have used a non mass-transferring pre-CV, NN Ser. NN Ser is ideally suited for this study as, in addition to the uncontaminated light curve, the system also displays deep primary eclipses that give rise to very sharp ingress and egress features. Given the high time resolution of ULTRACAM, we are able to estimate the times of mid-eclipse to an accuracy of∼0.15 s.
NN Ser is a white dwarf/M dwarf binary system with an ex-tremely low mass (M ∼0.15 M⊙), and therefore fully convective secondary star. The system was first studied in detail by Haefner (1989), who identified it as a deeply eclipsing (>4.8 mag) pre-CV with a strong reflection effect of∼0.6 mag, and an orbital pe-riod of 0.13 d. Wood & Marsh (1991) used low-resolutionIUE
[image:3.612.316.556.80.235.2](International Ultraviolet Explorer) spectra to derive the system parameters, which were refined by the radial velocity study of Catalan et al. (1994) to give the values in Table 1. The most re-cent study by Haefner et al. (2004) combines high-speed photome-try from the Multi-Channel Multi-Colour Photometer (MCCP) with Very Large Telescope (VLT)-trailed photometry and phase-resolved
Table 1. System parameters of NN Ser. RD=M dwarf secondary star.
Catal´an et al. 1994 Haefner et al. 2004 Wood & Marsh 1991
Binary sep. 0.95±0.025 R⊙ 0.9543±0.0233 R⊙ Inclination 84◦<i<90◦ 84.◦6±1◦.1
Mass ratio 0.18<q<0.23 0.2778±0.0297 WD mass 0.57±0.04 M⊙ 0.54±0.05 M⊙ RD mass 0.1<M⊙<0.14 0.150±0.008 M⊙ WD radius 0.017<R⊙<0.021 0.0189±0.0010 R⊙ RD radius 0.15<R⊙<0.18 0.174±0.009 R⊙ WD temp. 55 000±8000 K 57 000±3000 K
RD temp. 2900±150 K 2950±70 K
RD irr. temp. 5650<T<8150 K 7125±200 K RD spec. type M4.7–M6.1 M4.75±0.25 Distance 356<d<472 pc 500±35 pc
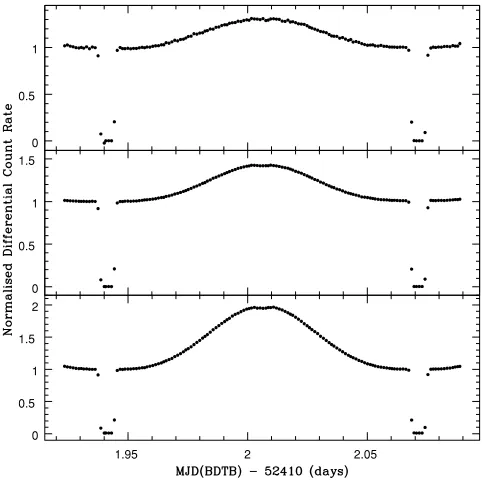
spectroscopy. This allows them to put good constraints on the tem-perature of the secondary star. They also attempt to derive accurate values for the radii and masses of the system components, but they failed to detect the secondary eclipse for NN Ser, which caused them to derive a binary inclination ofi=84◦.6±1◦.1. We have detected the
secondary eclipse in our ULTRACAM data (see Fig. 1), and our pre-liminary modelling indicates that the true inclination isi∼88◦. Full
results of our modelling will be the subject of a future paper, but we conclude from our initial results that Haefner et al. (2004) have over-estimated the radius (and therefore the mass) of the secondary star by
∼15 per cent. Nevertheless, we carry out all of our analysis for all values of mass and radius included in the uncertainties given by Catalan et al. (1994) and Haefner et al. (2004). All four studies also give eclipse timings which we have used to extend our baseline for measuring the period change to∼15 yr.
1.95 2 2.05
0 0.5
1 1.5
2 0 0.5
1 1.5
0 0.5
1
Figure 1. Differential light curves for NN Ser, taken simultaneously in the u′,g′andr′Sloan filters from top to bottom, respectively. The light curves are binned by a factor of 43. The hump in the light curve is caused by the reprocessing of light from the white dwarf by the cool secondary star. A shallow secondary eclipse can be detected at the top of the reflection hump in ther′andg′bands.
C
2005 The Authors. Journal compilationC2005 RAS, MNRAS365,287–295
D
o
w
n
lo
a
d
e
d
fro
m
h
ttp
s:
//a
ca
d
e
mi
c.
o
u
p
.co
m/
mn
ra
s/
a
rt
icl
e
-a
b
st
ra
ct
/3
6
5
/1
/2
8
7
/1
0
7
9
6
4
7
b
y
U
n
ive
rsi
ty
o
f S
h
e
ffi
e
ld
u
se
r
o
n
0
8
A
p
ri
l 2
0
1
[image:3.612.315.556.435.675.2]Table 2. Observation log for ULTRACAM observations of NN Ser.
Date Filters Number of Conditions eclipses
17/05/2002 u′g′r′ 2 Good, seeing∼1.2 arcsec
18/05/2002 u′g′r′ 1 Variable, seeing 1.2–2.4 arcsec
19/05/2002 u′g′r′ 1 Fair, seeing∼2 arcsec
20/05/2002 u′g′r′ 1 Fair, seeing∼2 arcsec
19/05/2003 u′g′z′ 1 Variable, seeing 1.5–3 arcsec
21/05/2003 u′g′i′ 1 Excellent, seeing∼1 arcsec
22/05/2003 u′g′i′ 1 Excellent, seeing<1 arcsec 24/05/2003 u′g′i′ 1 Good, seeing∼1.2 arcsec 03/05/2004 u′g′i′ 3 Variable, seeing 1.2–3.2 arcsec 04/05/2004 u′g′i′ 1 Variable, seeing 1.2–3 arcsec
2 D ATA AC Q U I S I T I O N
The data were taken with the ultrafast, triple-beam CCD camera, ULTRACAM (see Dhillon & Marsh (2001) for a review). We used the camera in conjunction with the 4.2-m William Herschel Tele-scope at the Isaac Newton Group to observe NN Ser simultaneously in the Sloanu′,g′and eitherr′,i′orz′bands. We set a time resolution
of∼2.06 s to ensure a high signal-to-noise ratio in all wavebands. The observations were taken over a period of 2 yr, in 2002–2004 May, and during those runs we observed 13 primary eclipses of the system. We were also able to observe a number of secondary eclipses as the white dwarf transited the secondary star (see Fig. 1). The pixel size for the three ULTRACAM CCDs is 13µm, with a
scale of 0.3 arcsec pixel−1. Readout noise is 3.10–3.40 e, depending on the CCD, while the gain is 1.13–1.20 e/ADU. Each ULTRA-CAM frame is time-stamped to a relative accuracy of better than 50µs and an absolute accuracy of better than 1 ms using a
ded-icated global positioning system. A full list of observations and observing conditions is given in Table 2. The weather in 2004 May was particularly variable, leading to larger errors in our measured times for that epoch.
The data were reduced using the ULTRACAM pipeline software written by TRM. Differential photometry was performed on the target, with respect to a nearby, bright, non-variable comparison star.
3 A N A LY S I S A N D R E S U LT S
All MJD times were corrected to Barycentric Dynamical Time (TDB), then additionally corrected for light traveltime to the so-lar system barycentre, i.e. barycentric corrected TDB (BTDB). All times are therefore listed in MJD (BTDB). In order to measure ac-curate eclipse times, we needed a model of the eclipse of the white dwarf, which we calculated as follows. We defined the two stars by their radii relative to the separation of the binary. Since we allowed for tidal deformation of the M dwarf (but not the white dwarf), the radius of the M dwarf was measured from its centre of mass to-wards the white dwarf. Apart from the relative radii, we also require the binary mass ratio and inclination, stellar effective temperatures and linear limb darkening coefficients to define our model binary. The two stars were divided into many small elements. The temper-atures of the elements covering the M dwarf were set, accounting for incident flux from the white dwarf by adding fluxes so that
σT′4
2 =σT
4
2 +Firr,
[image:4.612.55.295.81.212.2]whereσ is the Stefan–Boltzmann constant andFirris the flux in-cident on the secondary accounting for the projection effects and
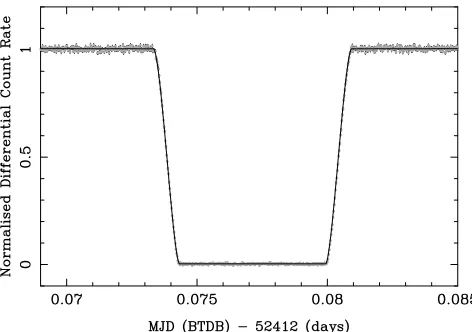
Figure 2. Differential light curve for NN Ser ing′with light-curve model
overplotted.
the distance from the white dwarf. The surface brightness of each element was then set assuming blackbody spectra, and given the ef-fective wavelength of the filter in question. Once the surface bright-nesses were set, the model light curves were computed by summing over all elements, testing for which were in view and not eclipsed and accounting for their projected areas. The eclipse by the M dwarf was computed, allowing once again for tidal distortion. Our assump-tion of blackbody spectra for the two stars is physically unrealistic, but for the eclipse times of this paper, the key element is to have a model that can match the shape of the primary eclipse, which ours does well (Fig. 2). The timings and associated errors for the mid-eclipses in all of the wavebands are given in Table 3. The errors on our mid-eclipse timings are typically∼0.15 s, but as low as 0.06 s when conditions are good.
The times of mid-eclipse in theg′band were plotted against cycle
number. We found that all 13 of the ULTRACAM points except for one (cycle 38 968) fell on a straight line, and that the one discrepant point showed a time-shift of 2.06 s – exactly the same timing as one exposure. We noted from the logs that we had GPS problems during this exposure run, therefore concluded that the GPS time-stamp had slipped by one exposure for that point, and corrected it by 2.06 s to bring it in line with the other points. Old eclipse timings from the literature (Haefner 1989; Wood & Marsh 1991; Pigulski & Michalska 2002; Haefner et al. 2004; Table 4) were then added to the plot. The residuals after subtracting a straight-line fit can be seen in Fig. 3. We derive a best-fitting linear ephemeris from all the available data for NN Ser as
MJD (BTDB)=47344.024 6049(14)+0.130 080 144 430(36)E,
where the quoted uncertainties are the 1σ uncertainties in the fit. We derive a best-fitting quadratic ephemeris as
MJD (BTDB)=47344.024 4738(16)+0.130 080 171 41(17)E −5.891(36)×10−13E2.
The data, with eclipse timestE, were fit with a parabola of the form:
tE=T0+AE+B E2. (1) The rate of period decrease can then be found using
˙
P= 2B
P . (2)
We found that the rate of period change over the 15 yr of obser-vations is increasing, so we fit all of the data to find an average rate
D
o
w
n
lo
a
d
e
d
fro
m
h
ttp
s:
//a
ca
d
e
mi
c.
o
u
p
.co
m/
mn
ra
s/
a
rt
icl
e
-a
b
st
ra
ct
/3
6
5
/1
/2
8
7
/1
0
7
9
6
4
7
b
y
U
n
ive
rsi
ty
o
f S
h
e
ffi
e
ld
u
se
r
o
n
0
8
A
p
ri
l 2
0
1
290
C. S. Brinkworth et al.
Table 3. Measured times of mid-eclipse for each of the 13 observed primary eclipses of NN Ser. Cycle numbers are counted from first measured eclipse in the literature (Haefner 1989). Times were measured for all three wavebands simultaneously observed with ULTRACAM and are given in MJD (BTDB), i.e. MJD shifted to the solar system barycentre and corrected for light traveltime. The red filter varied between nights, so the filter used is listed in the final column. The poor observing conditions during eclipse cycle 44 474 led to the loss of data in theu′band.
Cycle u′eclipse Uncertainty g′eclipse Uncertainty r′/i′/z′eclipse Uncertainty Red
number time 1σ time 1σ time 1σ filter
38 960 52 411.947 0588 0.000 0020 52 411.947 0564 0.000 0005 52 411.947 0577 0.000 0010 r′
38 961 52 411.077 1385 0.000 0016 52 412.077 1385 0.000 0005 52 412.077 1383 0.000 0010 r′
38 968 52 412.987 6761 0.000 0030 52 412.987 6977 0.000 0008 52 412.987 6721 0.000 0013 r′
38 976 52 414.028 3427 0.000 0030 52 414.028 3394 0.000 0006 52 414.028 3379 0.000 0016 r′ 38 984 52 415.068 9716 0.000 0025 52 415.068 9810 0.000 0007 52 415.068 9795 0.000 0016 r′ 41 782 52 779.033 1646 0.000 0021 52 779.033 1696 0.000 0010 52 779.033 1362 0.000 0100 z′ 41 798 52 781.114 4524 0.000 0015 52 781.114 4513 0.000 0006 52 781.114 4567 0.000 0014 i′ 41 806 52 782.155 0904 0.000 0021 52 782.155 0929 0.000 0006 52 782.155 0948 0.000 0011 i′
41 820 52 783.976 2155 0.000 0022 52 783.976 2151 0.000 0007 52 783.976 2110 0.000 0020 i′
44 472 53 128.948 6787 0.000 0070 53 128.948 6778 0.000 0040 53 128.948 6611 0.000 0800 i′
44 473 53 129.078 7555 0.000 0027 53 129.078 7597 0.000 0022 53 129.078 7487 0.000 0050 i′
44 474 No data n/a 53 129.208 8356 0.000 0020 53 129.208 8355 0.000 0027 i′
44 480 53 129.989 3197 0.000 0050 53 129.989 3229 0.000 0025 53 129.989 3148 0.000 0040 i′
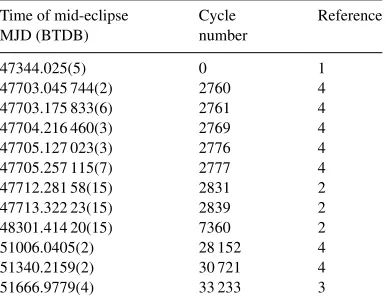
Table 4. Previous eclipse times of NN Ser (i) Haefner (1989); (ii) Wood & Marsh (1991); (iii) Pigulski & Michalska (2002); (iv) Haefner et al. (2004).
Time of mid-eclipse Cycle Reference
MJD (BTDB) number
47344.025(5) 0 1
47703.045 744(2) 2760 4
47703.175 833(6) 2761 4
47704.216 460(3) 2769 4
47705.127 023(3) 2776 4
47705.257 115(7) 2777 4
47712.281 58(15) 2831 2
47713.322 23(15) 2839 2
48301.414 20(15) 7360 2
51006.0405(2) 28 152 4
51340.2159(2) 30 721 4
51666.9779(4) 33 233 3
of period change, and just the ULTRACAM data to find the current rate. The AM of the system as a whole is given by
J =
Ga M
1/2
M1M2, (3)
whereM1,M2andMare the primary, secondary and total masses, respectively. Combining this with Kepler’s third law,
4π2
P2 =
G M
a3 , (4)
we find that, for a detached system (whereM1,M2andMare con-stant),
˙
J J =
2 3
B
P2. (5)
For NN Ser, our measured value for the average rate of period change is
˙
Pav=9.06×10⁻¹²±0.06×10⁻¹²s s−1 and for the current rate of period change
˙
Pcur=2.85×10⁻¹¹±0.15×10⁻¹¹s s−1.
-80 -60 -40 -20 0 20
-50 0
-1 0 1
0 -1
[image:5.612.319.548.162.526.2]0 1
Figure 3. The upper plot is an O–C diagram showing the period change in NN Ser. A linear fit has been subtracted from the data. The solid line is a fit through all the data (average rate of period change), while the dashed line is a fit through the ULTRACAM data only (current rate of period change). The lower three plots are (from uppermost): residuals after a fit through all the data is subtracted, showing all the points; residuals after the fit through all the data is subtracted, zoomed in on the ULTRACAM points; residuals after the fit through the ULTRACAM data is subtracted, zoomed in on those points.
Taking 0.1M20.14 M⊙and 0.15R20.18 R⊙(Catalan
et al. 1994), these correspond to AM loss rates of
0.84×1035J˙av2.09×1035erg and
2.52×1035J˙
cur6.87×1035erg,
where the relatively large allowed range is caused by the uncertainties in the system parameters, where we have assumed that
C
2005 The Authors. Journal compilationC2005 RAS, MNRAS365,287–295
D
o
w
n
lo
a
d
e
d
fro
m
h
ttp
s:
//a
ca
d
e
mi
c.
o
u
p
.co
m/
mn
ra
s/
a
rt
icl
e
-a
b
st
ra
ct
/3
6
5
/1
/2
8
7
/1
0
7
9
6
4
7
b
y
U
n
ive
rsi
ty
o
f S
h
e
ffi
e
ld
u
se
r
o
n
0
8
A
p
ri
l 2
0
1
[image:5.612.77.270.329.481.2]the system parameters are independent of each other. Obviously, this will overestimate the size of the uncertainty in our measured AM loss rate for any one value of the secondary mass. When carrying out the analysis of period loss mechanisms in Section 4, we have used a more realistic approach, relating the secondary radius to its mass, using the M–R relation for secondaries in binary stars given in Gorda & Svechnikov (1998) and calculating the resultant separation of the binary. This then gives a range of values for the AM change that are specific to each value of secondary mass.
4 D I S C U S S I O N – M E C H A N I S M S F O R P E R I O D C H A N G E
Period changes in binary systems are generally due to one of three mechanisms.
(i) Applegate’s (1992) mechanism, where period changes are caused by coupling between the binary period and changes in the shape of the secondary star.
(ii) The presence of a third body in a long orbit around the binary. This affects the light traveltime, which can be misinterpreted as a change in the binary period. For example, as the binary moves towards the observer, the eclipses are seen to occur more frequently than when the binary is moving away.
(iii) A genuine AM loss from the system.
We show below that the most common cause of measurable change in binary periods – Applegate’s mechanism – cannot work for NN Ser: the luminosity of the secondary star is too low to provide the necessary energy. We also discuss the other two mechanisms in detail, along with the ramifications for binary evolution.
4.1 Applegate’s mechanism
Applegate (1992) proposed that orbital period modulations observed in many binary stars could be induced by the gravitational coupling of the binary orbit to variations in the shape of the magnetically active secondary star. The shape changes are reflected in a change of quadrupole moment which leads to the change in period; no loss of AM from the system is necessary. The shape changes are presumed to be driven by solar-like magnetic cycles. To avoid an excessive energy budget (Marsh & Pringle 1990), Applegate (1992) proposed that the shape changes were driven by the redistribution of AM within the secondary star. He showed that the energy required was well within the capabilities of four out of five stars that he considered, and was not far off the mark for the fifth, RS CVn.
One of the reasons we chose NN Ser was that it has a particularly low-mass –and therefore low luminosity – secondary star, which should be incapable of driving large period changes under Applegate (1992) model. We now consider this in detail.
The observational fact we have to explain is the total period change, which in NN Ser amounts toP = (−4.26± 0.03)×
10−3s over the 15 yr from the MCCP to the ULTRACAM epoch. A period changePcorresponds to a change in quadrupole moment
Q, where
P P = −9
R a
2
Q
M R2, (6)
whereMandRare the mass and radius of the secondary star, respec-tively, andais the orbital separation (Applegate & Patterson 1987). Applegate (1992) calculated the change in quadrupole moment by considering the transfer of AM from the inside of the star into a thin outer shell. This increases the oblateness of the shell, and therefore
its quadrupole moment, at the expense of some energy. Applegate usedMs∼0.1 M⊙for the mass of the shell. This is immediately a
problem in the case of NN Ser because the mass of the secondary star is only 0.15 M⊙, and so 0.1 M⊙is not in any sense a ‘shell’. We therefore generalized Applegate’s work as follows. We split the star into an inner ‘core’, denoted by subscript 1 and an outer shell denoted by subscript 2. AM is transferred from the core to the shell leading to changes in their angular frequencies of1and2 such that
I11+I22=0, (7)
whereI1andI2 are the moments of inertia and given by integrals over radius of a series of thin shells of the form
I = 2
3
R2dM (8)
The change in angular frequencies changes the oblateness and there-fore quadrupole moments of the core and shell leading to an overall change in quadrupole moment of
Q=Q′1211+(1)2
+Q′2222+(2)2
(9)
where theQ′coefficients are given by integrals over shells of the
form
Q′= 1
9
R5dM
G M(R), (10)
whereM(R) is the mass inside radiusR. These equations follow from equation (25) of Applegate (1992).
For a given period change, mass and radius, equation (6) gives the change in quadrupole moment. We then use equations (7) and (9) to solve for2, and therefore for the AM transferred,J=
I22. This then leads to the energy change from Applegate (1992) equation (28)
E=drJ+ 1 2
1
I1
+ 1 I2
(J)2, (11)
wheredr=2−1is the initial differential rotation.
In order to solve the equations above, one needs first to know the run of density with radius. We calculated this from the Lane–Emden equation for ann=1.5 polytrope as an approximation to the fully convective secondary star.
In Fig. 4, we show the results of these calculations as a func-tion of the shell mass forM=0.15 M⊙,R=0.174 R⊙andP= −0.004 26 s. Applegate used a value ofdr=2, on the basis that one would expect the initial differential rotation to be of a similar order of magnitude as the changes. In order to arrive at a mini-mum energy, we have assumed thatdr =0; had we used instead
dr=2, the energies would be increased by a factor∼2. Even without this factor, the figure shows that we need at least∼4×
1040erg to drive the observed period change. The luminosity of the secondary star isL2=4πR2σT4eff, which, for NN Ser’s secondary with 2880 < Teff <3020 K, gives the energy available over the 15 yr of observations as
2.5×1039E24.5×1039erg.
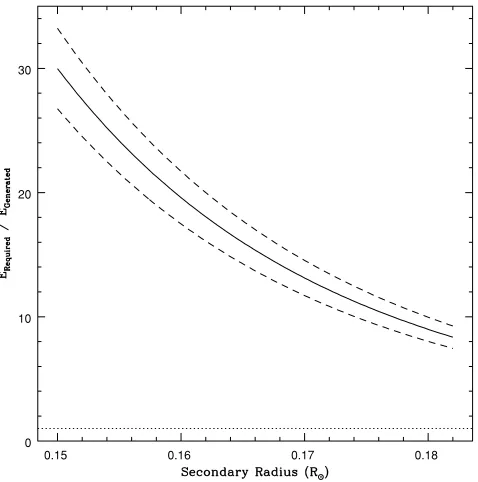
This range, which is indicated in the lower right of Fig. 4 fails by a factor of about 10 to match the energy we calculate, although it does just tally with a calculation based upon Applegate’s original calculations (dotted line). A plot of the ratio of our value of minimum energy required to drive Applegate’s mechanism over the energy available in 15 yr versus the radius of the secondary star is shown in Fig. 5. It can be seen that the ratio of energy required over energy
D
o
w
n
lo
a
d
e
d
fro
m
h
ttp
s:
//a
ca
d
e
mi
c.
o
u
p
.co
m/
mn
ra
s/
a
rt
icl
e
-a
b
st
ra
ct
/3
6
5
/1
/2
8
7
/1
0
7
9
6
4
7
b
y
U
n
ive
rsi
ty
o
f S
h
e
ffi
e
ld
u
se
r
o
n
0
8
A
p
ri
l 2
0
1
292
C. S. Brinkworth et al.
Figure 4. A plot of the energy required to effect the period change in NN Ser using Applegate’s (1992) mechanism as a function of assumed shell mass. The dotted line shows Applegate’s original calculation. The solid line shows our calculation, integrating over shells and allowing for the quadrupole moment of the inner core of the star. The dashed line shows the result if we ignore the quadrupole moment of the core. The error bar in the lower right shows the energy available to effect the change in NN Ser.
0.15 0.16 0.17 0.18
0 10 20 30
Figure 5. Ratio of energy required for Applegate’s mechanism over energy generated by the secondary star, versus secondary radius. The dashed lines show the uncertainty in energy ratio due to the uncertainties in the observed period change and the temperature of the secondary. The dotted line is at a ratio of 1, i.e. Applegate’s mechanism for period change is only possible below this line.
available is well above 1 for all values of secondary star radius (and therefore mass), i.e. for the system parameters derived by Catalan et al. (1994) and Haefner et al. (2004), NN Ser’s secondary star is not capable of generating enough energy to drive Applegate’s mechanism.
Our increased estimate is a result of the differences in our ap-proach compared to that of Applegate (1992). First, we generalize his thin-shell approximation by integration over finite ranges of
radii. Second, in equation (9), there is a positive contribution from the shell, but also a negative contribution from the core which Apple-gate did not include and which balances the shell to a considerable extent. The dashed line in Fig. 4 shows the effect of ignoring the core contribution to the energy in our calculation. This line con-verges towards Applegate’s (dotted line) at small shell masses. At large shell masses, the effect of the variation in density with ra-dius and finite shell thickness, which Applegate did not include, is important and explains the remaining difference. Ignoring the core cuts, the energy requirement by about a factor of 4, suggesting that, given the squared dependence of energy onJand henceQ, the core balances about 50 per cent of the quadrupole increase from the shell. Applegate (1992) already recognized that his approximations must break down when the shell becomes a significant fraction of the star’s mass; the counter-balancing effect of the core quadrupole moment has not been pointed out before as far as we are aware.
While we have shown that the intrinsic luminosity of NN Ser’s secondary star is too low to drive Applegate’s (1992) mechanism, we note that the secondary star is heavily irradiated by the hot, white dwarf primary, as shown by the much higher temperature on the side facing the white dwarf. In order to estimate how much of an effect this will have on the secondary star, we compared the flux from the primary that is intercepted by the secondary star with the secondary star’s intrinsic luminosity. We find that the intercepted flux from the white dwarf is∼13 times the intrinsic luminosity of the secondary, and therefore, if more than 70 per cent of this were to be absorbed by the secondary star, the extra energy provided could be enough to drive Applegate’s (1992) mechanism. However, there are a number of reasons that this should not be the case. First, very little of the energy absorbed at the stellar surface flows inwards since the opacity in this region becomes very high, the stellar surface quickly heats up, and so the heating luminosity is reradiated (Harpaz & Rappaport 1991, 1995). Instead, the main effect of the irradiating flux is to block the outflow of the radiation produced in the secondary star’s interior. The star will undergo a small expansion as some of the blocked energy is stored as internal or gravitational energy, but unlike a star undergoing isotropic irradiation, an anisotropically irradiated star diverts the energy flow in the upper layers of the convection zone to the unirradiated parts of its surface, efficiently cooling the secondary star (Vaz & Nordland 1985; Ritter, Zhang & Kolb 2000). In this case, the energy flow is decoupled from the mechanical and thermal structure, which can still be considered as spherically symmetrical, hence the structure of the secondary star below the convection zone is virtually unaffected by the irradiating flux. The irradiating flux does not penetrate deeply enough into the atmosphere to affect the deep boundary layers that must be deformed to drive Applegate’s (1992) mechanism. Finally, if the secondary star were absorbing
∼9 times its intrinsic energy from the primary star, we should see some variability in the light curves over the 3 yr of observations with ULTRACAM. We see no evidence for this as the light curves are consistent to within 3.5 per cent over that time.
We conclude that in the case of NN Ser, Applegate’s (1992) quadrupolar distortion mechanism falls short of being able to match the observed period change although we note that there may yet be ways to affect the quadrupole distortion at less energy cost (Lanza, Rodono & Rosner 1998). We now look at alternative mechanisms of producing NN Ser’s period change.
4.2 Third body
Apparent changes in the orbital periods of binary stars have of-ten been attributed to the light traveltime variation caused by third bodies although further observation usually reveals that this cannot
C
2005 The Authors. Journal compilationC2005 RAS, MNRAS365,287–295
D
o
w
n
lo
a
d
e
d
fro
m
h
ttp
s:
//a
ca
d
e
mi
c.
o
u
p
.co
m/
mn
ra
s/
a
rt
icl
e
-a
b
st
ra
ct
/3
6
5
/1
/2
8
7
/1
0
7
9
6
4
7
b
y
U
n
ive
rsi
ty
o
f S
h
e
ffi
e
ld
u
se
r
o
n
0
8
A
p
ri
l 2
0
1
[image:7.612.55.294.331.572.2]be the case. However, with the relatively limited coverage to date, this is at least a possibility for NN Ser which we investigate in this section.
Changes in eclipse timings of binary stars do not necessarily indicate a genuine change in the binary period. A third body in a long orbit around the binary can cause small but significant changes in the light traveltime from the binary system, which manifest themselves as strictly sinusoidal changes in the timings of mid-eclipse. We are able to put constraints on the mass and period of any third body which could cause the observed period change in NN Ser by fitting all possible sine waves to a plot of mid-eclipse timings versus cycle number. A function of the form
T =T0+PorbE+A3sin
2π(E−E3)
P3
was fitted to the plot for values ofP3 between 2 and 500 000 d, wherePorbwas kept fixed at the orbital period of the binary,P3is the modulation period of the period change,A3 is the amplitude of the period modulation andE−E3is a measure of the phase of the zero-point of the modulation with respect to the zero-point of the binary period. As we are interested in the minimum possible mass, we assumed that the inclination of the orbital plane of the third body is aligned with the line of sight, i.e. sini=1. This gave us the values ofA3 for all possible modulation periods between 2 and 500 000 d. From this, we were able to use Kepler’s law and the observed luminosity of NN Ser to find the range of allowable masses of the third body which could cause the observed period change in NN Ser. The minimum possible mass comes from the fact that we have not seen a reversal in the period change of NN Ser. The minimum value ofP3 is therefore∼30 yr, which corresponds to a minimum mass ofM3=0.0043 M⊙.
The maximum value of M3 comes from the luminosity of the binary system in eclipse. The luminosity of the third body must be equal to or less than the observed mid-eclipse luminosity. This means that it must have a mass equal to or less than that derived for the secondary star. If the maximum mass is 0.18 M⊙then the maximum orbital period for any third body isP3=1.04×10⁵d∼ 285 yr.
We therefore find that, on the basis of the current data at least, a low-mass companion to the binary system could cause the ob-served changes in mid-eclipse timings that we observe in NN Ser, and that the long periods suggested by our data would be able to accommodate NN Ser’s primary even before its evolution to a white dwarf. Our results also indicate that measuring eclipse timings of binary systems is potentially a very sensitive method of detecting extrasolar planets in long-period orbits. We suspect, however, that as in other instances, further observations will rule out a third body.
4.3 Comparison with AM loss models
The period decrease we have measured in NN Ser may also be ex-plained by AM loss from the binary system. AM loss in CVs and pre-CVs is governed by two mechanisms – gravitational radiation and magnetic braking. The rates of AM loss caused by both mech-anisms must be added together to find the total AM loss for the system. We compare the inferred AM loss rate for NN Ser (corre-sponding to the rate of period decrease) to both the values predicted by the standard CV magnetic braking rate (Rappaport et al. 1983), based on extrapolation from studies of braking rates of solar-type stars in clusters, and to the reduced magnetic braking rate (Sills et al. 2000), based on more recent data, for which the AM saturates at lower masses. Under the standard model, the AM,J, decreases
as ˙J ∝ −ω3 (Skumanich 1972), whereωis the angular velocity of the star. However, the reduced braking model suggests that the AM loss is best modelled as ˙J ∝ −ω3forω < ω
critand ˙J ∝ −ω forω > ωcrit, where the threshold rate,ωcrit, is much lower than the rotation rates of CVs. This means that the new suggested ˙J is anything between 10 and 104 times smaller than assumed in the majority of CV studies.
If this is correct, we require a large-scale revision of CV evolu-tion, possibly with systems staying at an approximately fixed period throughout their lifetime rather than migrating from long to short periods. However, such a model has significant problems when com-pared to observations, particularly as the mass transfer rate should be much lower than seen in the high accretion rate group of CVs known as nova-like variables.
Both models were applied to CV studies by Andronov et al. (2003), hereafter APS03.
4.3.1 Gravitational radiation
We use the same expression for AM loss due to gravitational radia-tion as used in APS03, although this was misquoted in their paper. The correct expression is given by
dJ
dt
grav
= −32
5
G7/2
c5 a
−7/2
M12M22M1/2
, (12)
whereM1, M2 andMare the white dwarf mass, secondary mass and total mass, respectively, andais the binary separation given by Newton’s form of Kepler’s third lawa=(GM/ω2)1/3. For NN Ser, this gives a range of values of 5.75×1032< J˙
grav<1.74×
1033erg, over 100 times smaller than required to drive our measured value of ˙Pfor NN Ser.
4.3.2 Standard magnetic braking model
The standard model for magnetic braking in CVs is based upon studies of the solar wind and the rotation periods of solar-type stars in open clusters (Weber & Davis 1967; Skumanich 1972; Mestel & Spruit 1987). Rappaport et al. (1983) developed an empirical pre-scription that is still commonly used in CV studies. This relationship is given by
dJ
dt
mb
≈ −3.8×10⁻³⁰M
⊙R4⊙m2r
γ
2ω
3erg
, (13)
where 0γ4 is a dimensionless parameter andωis the angular frequency of rotation of secondary star (=binary period for CVs) in rad s−1. We applied this to NN Ser to find the predicted standard AM loss rate for this pre-CV. The results can be seen in Fig. 6. APS03 cut-off the standard magnetic braking model at a secondary mass of 0.3 M⊙to satisfy the standard CV theory. This states that as the secondary becomes convective, the magnetic field is no longer locked to the stellar core and so either dissipates or is rearranged, cutting off the magnetic braking mechanism. APS03 suggested that there is no evidence for this cut-off, so we have not applied it here. We find that by ignoring the magnetic braking cut-off, this model can explain the observed loss rates seen in NN Ser.
4.3.3 Reduced magnetic braking model
The more recently proposed model for AM loss due to mag-netic braking was applied to CVs in APS03. Studies of the rota-tional periods of low-mass stars (Collier-Cameron & Jianke 1994;
D
o
w
n
lo
a
d
e
d
fro
m
h
ttp
s:
//a
ca
d
e
mi
c.
o
u
p
.co
m/
mn
ra
s/
a
rt
icl
e
-a
b
st
ra
ct
/3
6
5
/1
/2
8
7
/1
0
7
9
6
4
7
b
y
U
n
ive
rsi
ty
o
f S
h
e
ffi
e
ld
u
se
r
o
n
0
8
A
p
ri
l 2
0
1
294
C. S. Brinkworth et al.
Figure 6. Plot of the braking rates predicted by gravitational radiation and the standard and reduced braking models for NN Ser. The different plots for the standard model are for different values ofγ=0, 1, 2, 3, 4, from the top down. The shaded region shows our measured value of the braking rate of NN Ser.
Keppens, MacGregor & Charbonneau 1995; Krishnamurthi et al. 1997; Queloz et al. 1998; Sills, Pinsonneault & Terndrup 2000) all showed that the standard model overestimates AM loss rates for periods below 2.5–5 d and that a modification of the standard model was required for those high rotation rates. APS03 modelled the mod-ified AM loss rates using a prescription with the same functional form as that of Sills et al. (2000), given by
dJ
dt
mb
= −Kw
r2
m2
ω3 forωω crit
ωω2
crit forω > ωcrit
, (14)
whereωcritis the critical angular frequency at which the AM loss rate enters the saturated regime. The constantKw=2.7×1047g cm s−1
is calibrated to give the known solar rotation rate at the age of the Sun (Kawaler 1988). The values ofωcritwere calculated from the values ofωcrit⊙given in Sills et al. (2000) using the relationship
betweenωcritand convective turnover time,τ, given by
ωcrit=ωcrit⊙
τ⊙
τ . (15)
The values ofτwere taken from Kim & Demarque (1996), assuming an age of 0.2 Gyr.
Again, the prescription was applied to NN Ser. Results are shown in Fig. 6. Our plot differs significantly from the original plot in APS03 due to their miscalculation of the AM loss due to gravita-tional radiation. By applying the correct gravitagravita-tional radiation loss rate, the total AM loss rates predicted by APS03 are within∼1 order of magnitude of the standard magnetic braking model rather than
∼2 orders of magnitude lower, as they originally claimed. However, this is still too low to explain the loss rates seen in NN Ser.
5 D I S C U S S I O N
We have found that only two mechanisms can explain the observed period change in NN Ser – either a genuine AM loss from the system
or an unseen third body in the orbit around the binary. In the case of an AM loss, our observations show that the system is losing AM at the rate predicted by Rappaport et al. (1983), but only if we assume that magnetic braking is not cut off as the secondary mass reaches 0.3 M⊙. APS03 pointed out that an increase in the AM loss rate at low periods can solve a major problem regarding the theoretical versus observed values of the period minimum. If CV evolution at
P < 2 h were driven solely by gravitational radiation, Patterson (1984) found that the period minimum should be at 1.1 hr rather than the observed value of 1.3 hr. He also noted that the AM loss rates would be very low for these short-period systems, implying a low mass accretion rate and therefore a high population of CVs at the minimum period, a prediction that is contradicted by obser-vation. By adding the extra AM loss rate from magnetic braking, the cut-off is shifted to longer periods. However, our value of the magnetic braking rate causes the opposite problem. We find that at short periods, the magnetic braking rate is almost 100 times the rate of AM loss due to gravitational radiation. Paczynski (1981) showed that, for constant ˙J,
Pmin∝
˙
J Jgr
0.34
(see also Patterson 1984), bringing the minimum period up to a value of 331 min≃5.5 hr, which is clearly not correct.
We also have the continuing problem of how to explain the pres-ence of the period gap – a dearth of systems with periods 2P
3 h. If magnetic braking does not shut off as the secondary becomes fully convective then there is no reason for systems to cease mass transfer between those periods. APS03 suggested that instead of a migration of CVs from long to short period, the systems above and below the period gap might belong to two different populations, with no migration between the two. However, this is more likely for their longer time-scale AM loss, as their model depends upon the presence of an evolved secondary star, than for our measured magnetic braking rate.
6 C O N C L U S I O N S
We find that there are two possible explanations for the observed period change in the pre-CV NN Ser over the last 15 yr. If the change is due to a genuine AM loss from the system then the rate corresponds to an AM loss that agrees most closely with the standard magnetic braking rate proposed by Rappaport et al. (1983), and that the reduced magnetic braking rate of Andronov et al. (2003) underestimates the measured rate by∼2 orders of magnitude. We find no evidence for a cut-off in magnetic braking as the secondary mass drops belowM=0.3 M⊙. If the period change is instead due to a third body, we place constraints on such a body of 0.0043<
M3<0.18 M⊙and 30< P3<285 yr.
As a byproduct of this investigation, we have found that the en-ergy requirements of the Applegate (1992) quadrupolar distortion mechanism are significantly increased once one accounts for the role of the inner part of the star in counterbalancing the outer shell.
AC K N OW L E D G M E N T S
CSB was supported by a Particle Physics and Astronomy Re-search Council (PPARC) studentship. TRM acknowledges the sup-port of a PPARC Senior Research Fellowship. ULTRACAM is supported by PPARC grant PPA/G/S/2002/00092. This work is based on observations from the William Herschel Telescope, op-erated by the Isaac Newton Group at the Observatorio del Roque
C
2005 The Authors. Journal compilationC2005 RAS, MNRAS365,287–295
D
o
w
n
lo
a
d
e
d
fro
m
h
ttp
s:
//a
ca
d
e
mi
c.
o
u
p
.co
m/
mn
ra
s/
a
rt
icl
e
-a
b
st
ra
ct
/3
6
5
/1
/2
8
7
/1
0
7
9
6
4
7
b
y
U
n
ive
rsi
ty
o
f S
h
e
ffi
e
ld
u
se
r
o
n
0
8
A
p
ri
l 2
0
1
de los Muchachos of the Instituto de Astrofisica de Canarias. This research was carried out, in part, at the Jet Propulsion Labora-tory, California Institute of Technology, and was sponsored by the National Aeronautics and Space Administration.
R E F E R E N C E S
Andronov N., Pinsonneault M., Sills A., 2003, ApJ, 582, 358 (APS03) Applegate J. H., 1992, ApJ, 385, 621
Applegate J. H., Patterson J., 1987, ApJ, 322, L99
Catalan M. S., Davey S. C., Sarna M. J., Smith R. C., Wood J. H., 1994, MNRAS, 269, 879
Collier-Cameron A., Jianke L., 1994, MNRAS, 269, 1099 Dhillon V. S., Marsh T. R., 2001, New Astron. Rev., 45, 91 Faulkner J., 1971, ApJ, 170, 99
Gorda S. Y., Svechnikov M. A., 1998, ARep, 42, 793 Haefner R., 1989, A&A, 213, L15
Haefner R., Fiedler A., Butler K., Barwig H., 2004, A&A, 428, 181 Harpaz A., Rappaport S., 1991, ApJ, 383, 739
Harpaz A., Rappaport S., 1995, A&A, 294, L49 Kawaler S. D., 1988, ApJ, 333, 236
Keppens R., MacGregor K. B., Charbonneau P., 1995, A&A, 294, 469 Kim Y., Demarque P., 1996, ApJ, 457, 340
Kraft R. P., Matthews J., Greenstein J. L., 1962, ApJ, 136, 312
Krishnamurthi A., Pinsonneault M. H., Barnes S., Sofia S., 1997, ApJ, 480, 303
Lanza A. F., Rodono M., Rosner R., 1998, MNRAS, 296, 893 Marsh T. R., Pringle J. E., 1990, ApJ, 365, 677
Mestel L., Spruit H. C., 1987, MNRAS, 226, 57 Paczynski B., 1981, AcA, 31, 1
Patterson J., 1984, ApJS, 54, 443
Pigulski A., Michalska G., 2002, IBVS, 5218
Queloz D., Allain S., Mermilliod J. C., Bouvier J., Mayor M., 1998, A&A, 335, 183
Rappaport S., Verbunt F., Joss P. C., 1983, ApJ, 275, 713 Reid I. N., Mahoney S., 2000, MNRAS, 316, 827 Ritter H., Zhang Z. Y., Kolb U., 2000, A&A, 360, 969
Sills A., Pinsonneault M. H., Terndrup D. M., 2000, ApJ, 534, 335 Skumanich A., 1972, ApJ, 171, 565
Spruit H. C., Ritter H., 1983, A&A, 124, 267
Stauffer J. R., Hartmann L. W., Prosser C. F., Randich S., Balachandran S., Patten B. M., Simon T., Giampapa M., 1997, ApJ, 479, 776
Vaz L. P. R., Nordland A., 1985, A&A, 147, 281 Verbunt F., Zwaan C., 1981, A&A, 100, 7
Warner B., 1995, Cataclysmic Variable Stars. Cambridge Astrophysics Series 28. Cambridge Univ. Press, Cambridge
Weber E. J., Davis L. J., 1967, ApJ, 148, 217 Wood J. H., Marsh T. R., 1991, ApJ, 381, 551
This paper has been typeset from a TEX/LATEX file prepared by the author.
D
o
w
n
lo
a
d
e
d
fro
m
h
ttp
s:
//a
ca
d
e
mi
c.
o
u
p
.co
m/
mn
ra
s/
a
rt
icl
e
-a
b
st
ra
ct
/3
6
5
/1
/2
8
7
/1
0
7
9
6
4
7
b
y
U
n
ive
rsi
ty
o
f S
h
e
ffi
e
ld
u
se
r
o
n
0
8
A
p
ri
l 2
0
1