Transition Structure, Continent Ocean
Boundary Location and Magmatic Type at
Rifted Continental Margins
Thesis Submitted In Accordance With the Requirements of the
University Of Liverpool for the Degree of Doctor in Philosophy
By: Leanne Cowie
Acknowledgements
P a g e |i
Acknowledgements
I would like to express my deepest gratitude to Professor Nick Kusznir, my supervisor, for his patient guidance, enthusiastic encouragement, his extremely useful critique of this research, and for keeping my progress on schedule.
My grateful thanks to Professor Gianreto Manatschal for his assistance and guidance throughout the more geological aspects of my PhD, and for some memorable time spent in the field.
I wish to thank Alan Roberts and the rest of the team at Badley Geoscience for their helpful advice and useful discussions.
This work would not have been possible without funding from the MM3 consortium, and special thanks to ION-GXT for providing invaluable seismic data.
Special thanks to Michael King for his unwavering support, as well as his grammatical expertise and his knowledge of Microsoft Word during the formatting of this thesis.
I would like to thank Ludovic Jeanniot for being a constant source of entertainment for the last 4 years. Without his ‘European charm’, my PhD experience would not have been the same.
A huge thank you to friends and colleagues at the University of Liverpool over the last 8 years who have made this time in my life truly unforgettable.
P a g e |ii
Abstract
Determination of Ocean Continent Transition Structure, Continent
Ocean Boundary Location and Magmatic Type at Rifted Continental
Margins.
Leanne Cowie
Knowledge of ocean continent transition (OCT) structure, continent ocean boundary (COB) location and magmatic type are of critical importance for understanding rifted continental margin formation and evolution, and in evaluating petroleum systems in deep-water frontier oil and gas exploration. A suite of quantitative analytical techniques have been developed in order to determine the structure of the OCT, the location of the COB and magmatic type at rifted continental margins; these techniques include the use of gravity anomaly inversion, residual depth anomaly (RDA) and subsidence analysis. Gravity anomaly inversion, incorporating a lithosphere thermal gravity anomaly correction, has been used to determine Moho depth, crustal basement thickness and continental lithosphere thinning. RDA analysis has been used to investigate OCT bathymetric anomalies with respect to expected oceanic bathymetries, and subsidence analysis has been used to determine the distribution of continental lithosphere thinning. These techniques have been applied to the Iberian, Gulf of Aden, northern Angolan, and south-eastern Brazilian rifted continental margins.
Integrated quantitative analysis results have been validated using ODP well data and magnetic anomalies along the Iberian rifted continental margin. Results identify a clearly defined zone of exhumed mantle on the Iberian profiles, which is also observed in the ODP well data.
In addition to the quantitative analysis techniques, a methodology for the joint inversion of deep long offset seismic data and gravity anomaly data has been developed in order to further constrain the OCT structure and COB location. The joint inversion method solves for coincident seismic and gravity Moho in the time domain and calculates the lateral variations in crustal basement densities and velocities along profile. Integrated quantitative analysis along the northern Angolan profile suggests that exhumed mantle, corresponding to a magma-poor margin, is absent beneath the allochthonous salt and that the thickness of earliest oceanic crust is approximately 7km. Integrated quantitative analysis along the south-eastern Brazilian profile predicts that the earliest oceanic crust is between 7km and 8km thick and that there is no evidence of exhumed mantle as suggested by Zalán et al. (2011). The results from the integrated quantitative analysis have also been used together with post-breakup subsidence modelling to determine the palaeo-bathymetry of the base Loeme salt along northern Angolan profiles. The proximal autochthonous base salt restores to near sea level, but not the distal allochthonous salt. Our interpretation is that the distal salt formed during the late syn-rift while the crust under it was being actively thinned, resulting in additional tectonic subsidence.
Table of Contents
P a g e |iii
Table of Contents
1. Introduction ... 1
1.1. Aims... 1
1.2. OCT Structure, COB Location and Magmatic Type ... 5
1.3. Subsidence History at Rifted Continental Margins ... 12
1.4. Thesis Structure ... 13
1.5. References ... 16
2. Determining the COB Location along the Iberian Margin and Galicia Bank from Gravity Anomaly Inversion, Residual Depth Anomaly and Subsidence Analysis ... 20
2.1. Introduction ... 22
2.2. OCT Structure and COB Location: Profile IAM9 ... 26
2.2.1. Crustal Basement Thickness and Continental Lithosphere Thinning along IAM9 from Gravity Anomaly Inversion ... 26
2.3. Residual Depth Anomaly Analysis: Profile IAM9 ... 34
2.3.1. Sediment Corrected RDA ... 34
2.3.2. RDA Component from Crustal Basement Thickness Variations (RDACT) ... 38
2.3.3. Sediment Corrected RDA Further Corrected for Crustal Basement Thickness Variations (ΔRDA)………….. ... 40
2.4. Continental Lithosphere Thinning from Subsidence Analysis ... 41
2.5. OCT Structure and COB Location along the Lusigal 12 Profile ... 44
2.5.1. Crustal Basement Thickness and Continental Lithosphere Thinning along Lusigal 12 from Gravity Anomaly Inversion ... 44
2.5.2. RDAs corrected for Sediment Loading and Crustal Basement Thickness Variations along Lusigal 12... 46
2.5.3. Continental Lithosphere Thinning from Subsidence Analysis along Lusigal 12 ………47
2.6. OCT Structure and COB Location along Profile ISE-01 ... 49
2.6.1. Crustal Basement Thickness and Continental Lithosphere Thinning along ISE-01 from Gravity Anomaly Inversion ... 49
2.6.2. RDAs Corrected for Sediment Loading and Crustal Basement Thickness Variations along ISE-01 ... 51
2.6.3. Continental Lithosphere Thinning from Subsidence Analysis along ISE-01 ... 52
2.7. Predicting OCT Structure and COB Location ... 54
2.7.1. IAM9………. ... 55
2.7.2. Lusigal 12……….. ... 58
P a g e |iv 2.8. Conclusion ... 65 2.9. References ... 67 3. OCT Structure, COB Location and Magmatic Type of the Northern Angolan and South-eastern Brazilian Rifted Continental Margins ... 73
3.1. Introduction ... 75 3.2. OCT structure and COB location: along the CS1-2400 profile, northern Angolan margin. ... 77
3.2.1. Background: ... 77 3.2.2. Crustal basement thickness and continental lithosphere thinning from gravity anomaly inversion along the CS1-2400 profile ... 79 3.2.3. Residual depth anomaly (RDA) analysis along the CS1-2400 profile ... 84 3.2.4. Sediment corrected RDA along the CS1-2400 profile ... 85 3.2.5. RDA component from crustal thickness variations (RDACT) along the CS1-2400 profile……… ... 88 3.2.6. RDAs corrected for sediment loading and crustal thickness variations along the CS1-2400 profile………. ... 89 3.2.7. Continental lithosphere thinning from subsidence analysis along the CS1-2400 profile………. ... 91 3.2.8. Joint inversion of deep seismic and gravity anomaly data: application to the CS1-2400 profile……… ... …93 3.2.9. Interpretation of the integrated quantitative analysis results along CS1-2400
………..96 3.3. OCT structure and COB location: along the BS1-575 profile, south-eastern
Brazilian margin ... 100 3.3.1. Background: ... 100 3.3.2. Crustal basement thickness and continental lithosphere thinning from gravity anomaly inversion along the BS1-575 profile ... 101 3.3.3. Sediment corrected RDA along the BS1-575 profile ... 106 3.3.4. RDA component from crustal thickness variations (RDACT) along the BS1-575 profile……… ... 108 3.3.5. RDAs corrected for sediment loading and crustal thickness variations along the BS1-575 profile……… ... 110 3.3.6. Continental lithosphere thinning from subsidence analysis along the BS1-575 profile………. ... 110 3.3.7. Joint inversion of deep seismic and gravity anomaly data: application to the BS1-575 profile………. ... 112 3.3.8. Interpretation of the integrated quantitative analysis results along BS1-575
Table of Contents
P a g e |v
3.5. References ... 122
3.6. Supplementary Figures ... 126
4. The Palaeo-Bathymetry of Base Aptian Salt Deposition on the Northern Angolan Rifted Margin: Constraints from Flexural Backstripping and Reverse Post-Breakup Thermal Subsidence Modelling ... 131
Abstract ... 132
4.1. Introduction ... 133
4.2. Reverse post-breakup thermal subsidence modelling ... 136
4.2.1. Continental lithosphere thinning and crustal basement thickness from gravity anomaly inversion for CS1-2400 ... 137
4.2.2. Palaeo-bathymetry of the base Aptian salt deposition for the CS1-2400 profile………. ... 141
4.2.3. Reverse post-breakup thermal subsidence for CS1-2400: ... 144
4.2.4. Location of the distal salt with respect to COB location along the CS1-2400 profile……… ... 146
4.3. Reverse post-breakup subsidence for the P3 and P7+11 profiles ... 149
4.3.1. Continental lithosphere thinning factors determined from gravity anomaly inversion for the P3 and P7+11 profiles ... 149
4.3.2. Palaeo-bathymetry of the base Aptian salt deposition for the P3 profile ... 149
4.3.3. Palaeo-bathymetry of the base Aptian salt deposition for P7+11 profile ... 152
4.4. Discussion ... 155
4.5. References: ... 159
4.6. Supplementary Figures ... 164
5. Residual Topography Predictions from Residual Depth Anomaly Analysis: Applications to the Iberian, Gulf of Aden and Northern Angolan Rifted Continental Margins ... 166
5.1. Introduction ... 168
5.1.1. Summary of the Global Residual Topography Models ... 171
5.2. Residual Topography along the IAM9 Profile ... 174
5.2.1. Residual Depth Anomaly along the IAM9 Profile ... 176
5.2.2. Sediment Corrected Residual Depth Anomaly along the IAM9 Profile ... 177
5.2.3. Crustal Basement Thickness from Gravity Anomaly Inversion along the IAM9 Profile………. ... 179
5.2.4. Predicted RDA from Crustal Thickness Variations (RDACT) along the IAM9 Profile……….. ... 183
5.2.5. Residual Topography Measurements from RDA Analysis ... 183
5.2.6. Locating the Continent Ocean Boundary ... 184
P a g e |vi
5.4. Residual Topography along the Northern Angolan Margin ... 192
5.5. Comparison of Residual Topography Measurements from 2D RDA Analysis with Extracts from Global Models ... 199
5.6. Conclusion ... 205
5.7. References ... 207
5.8. Supplementary Figures ... 211
6. Discussion and Summary... 213
6.1. Introduction ... 213
6.2. Iberian Rifted Continental Margin ... 214
6.3. South Atlantic Rifted Continental Margins ... 220
6.3.1. Northern Angolan Rifted Continental Margin ... 220
6.3.2. South-eastern Brazilian Rifted Continental Margin ... 229
6.3.3. Petroleum Systems ... 236
6.4. Residual Topography... 237
6.5. Errors and Uncertainties in the Integrated Quantitative Analysis Results ... 239
6.6. Conclusions ... 241
6.7. References ... 243
Appendix A - Anomalous Subsidence at the Ocean Continent Transition of the Eastern Gulf of Aden Rifted Continental Margin ... 245
Appendix B - Crustal Thickness and the Distribution of Oceanic Lithosphere in the Western Mediterranean from Gravity Inversion………258
Appendix C - Crustal Thickness and the Distribution of Oceanic Lithosphere in the Eastern Mediterranean from Gravity Inversion………259
Chapter 1 - Introduction
P a g e |1
Chapter 1
1.
Introduction
1.1.
Aims
Chapter 1 - Introduction
P a g e |4
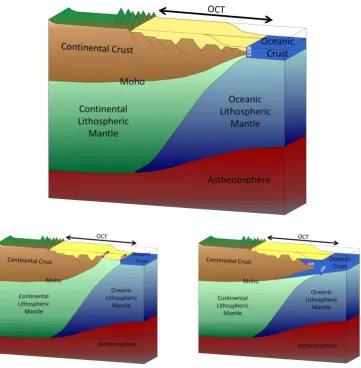
Figure 1.2 – Three schematic models showing continental rifted margin for (a) ‘normal’ magmatic (b) magma-poor and (c) magma-rich end members. The OCT and COB locations are identified in each model.
Chapter 1 - Introduction
P a g e |5 Another important term used within this thesis is continental breakup age, which within this thesis is associated with the onset of seafloor spreading. Conceptually the term continental breakup may be used to either describe the point at which the continental crust ruptures and starts to separate, or when the divergent plate boundary is localised by the onset of decompression melting and seafloor spreading. Traditionally in classical models of continental breakup, rifting is immediately followed by seafloor spreading, which implies that continental breakup can be identified as a specific spatial and temporal boundary (Peron-Pinvidic et al., 2006). The timing and location of continental breakup is often defined by the first observation of a magnetic anomaly that is generated by magma erupted from the newly formed mid-ocean ridge (Bronner et al., 2011). There are many indicators for determining continental breakup, including magnetic anomalies, the breakup unconformity, the distribution of high-angle faults, and the presence of sedimentary wedges (Peron-Pinvidic et al., 2006). However, depending on the magmatic type of a margin, some (or all) of these indicators may not be reliable for identifying the age and location of breakup.
1.2.
OCT Structure, COB Location and Magmatic Type
P a g e |6 knowledge of the geodynamic, tectonic and magmatic processes responsible for continental lithosphere stretching and thinning leading to breakup, which is critical for evaluating rifted continental margin formation and evolution. For the hydrocarbon industry, rifted continental margins are key exploration frontiers, and knowledge of the OCT structure, COB location and magmatic type are important for deep-water frontier oil and gas exploration. OCT structure, COB location and magmatic type have significant consequences for petroleum systems in terms of source rocks, reservoirs and thermal maturation. The position of the COB (i.e. determining whether we are looking at thinned continental crust or oceanic crust) is particularly important for determining the thermal maturity of a petroleum system. Petroleum systems require heat during the maturation period; this heat, in part, comes from the radiogenic heat productivity within continental crust.
Chapter 1 - Introduction
P a g e |7
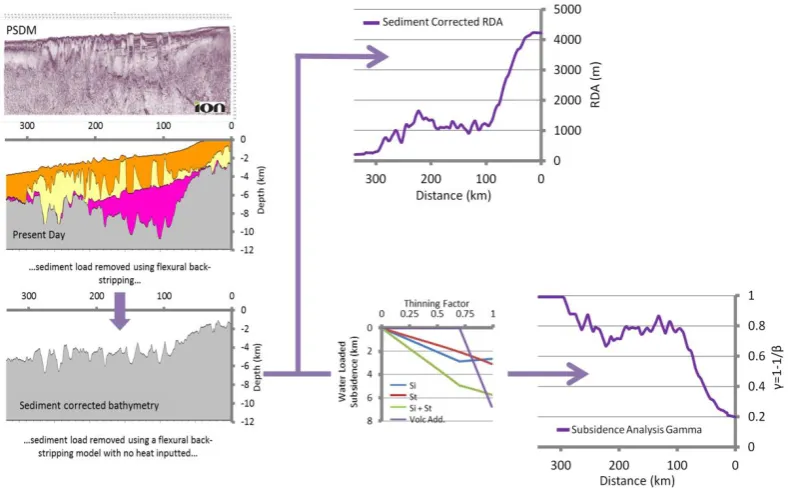
P a g e |8 A suite of quantitative analytical techniques have been developed in order to determine the structure of the OCT, the location of the COB and magmatic type at rifted continental margins; these techniques include the use of gravity anomaly inversion, residual depth anomaly (RDA) and subsidence analysis. Gravity anomaly inversion, incorporating a lithosphere thermal gravity anomaly correction, has been used to determine Moho depth (i.e. base of the crust), crustal basement thickness and continental lithosphere thinning. The gravity anomaly inversion workflow is summarised in Figure 1.3. RDA analysis has been used to investigate OCT bathymetric anomalies with respect to expected oceanic bathymetries, and subsidence analysis has been used to determine the distribution of continental lithosphere thinning; these methodologies are shown in Figure 1.4.
[image:15.595.127.523.356.600.2]Chapter 1 - Introduction
P a g e |9 In addition to the quantitative analysis techniques, a methodology for the joint inversion of deep long offset seismic data and gravity anomaly data has been developed in order to further constrain the structure of the OCT and the location of the COB. The joint inversion method solves for coincident seismic and gravity Moho, in the time domain, and calculates the lateral variations in crustal basement densities and seismic velocities. The quantitative analysis and joint inversion techniques have been applied to geological cross sections along the offshore Iberian (Figure 1.1(b)), the Gulf of Aden (Figure 1.1(c)) south-eastern Brazilian (Figure 1.1(d)) and northern Angolan (Figure 1.1(e)) rifted continental margins. The integrated use of all these techniques together is a new approach, which provides a more robust geological interpretation of the OCT structure, COB location and magmatic type at rifted continental margins. The integrated workflow is summarised in Figure 1.5.
Within the integrated quantitative analysis methodology a crustal basement density of 2850kgm–3 is assumed for both oceanic and continental crustal basement (Chappell & Kusznir 2008). Sensitivity tests of this value have been carried out within the range 2800kgm–3 to 2900kgm–3 and do not change the interpretation of the results presented within this thesis. Different values of oceanic and continental basement density are not used so as to avoid prejudicing the integrated quantitative analysis prediction of continent ocean boundary with
Chapter 1 - Introduction
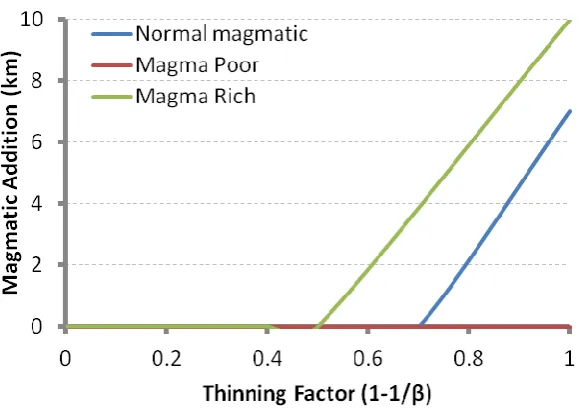
[image:18.595.170.460.330.535.2]P a g e |11 In order to determine the magmatic type of a margin, sensitivities to the amount of decompression melting have been considered (Figure 1.6). For a ‘normal’ magmatic margin, it is assumed that decompression melting begins at γ=0.7 and will produce a maximum magmatic addition of 7km at a thinning factor of 1.0 (for ß=∞). Magma-rich margins have more decompression melting and magmatic addition to the crust, with melt initiation occurring at γ=0.5 and a maximum magmatic addition of 10km at γ=1.0. We also consider the case of a magma-poor margin where no magmatic addition to the crust is generated. Within this thesis, crustal and lithosphere thinning are presented according to the depth-uniform stretching model.
P a g e |12
1.3.
Subsidence History at Rifted Continental Margins
It has been proposed (Davis and Kusznir, 2004; Lucazeau et al., 2008; Péron-Pinvidic and Manatschal, 2008; Unternehr et al., 2010) that some rifted continental margins have anomalous early subsidence histories, and that at breakup they were elevated at shallower bathymetries than the isostatic response of classical rift models (e.g. McKenzie (1978)) would predict. The existence of anomalous syn- or post-breakup subsidence of this form would have important implications for understanding the geodynamics of continental breakup, the subsidence history of the margin and the evolution of syn- and post-breakup depositional systems. In addition, an understanding of the syn- and post-breakup subsidence evolution and the resulting palaeo-bathymetries and depositional environments, are critical to deep-water hydrocarbon exploration at rifted continental margins.
The results from the integrated quantitative analysis, which have been used to determine the structure of the OCT, the location of the COB and magmatic type of rifted continental margins, have also been used to provide some constraints on margin subsidence history. The reports of anomalous subsidence at rifted continental margins may partly (or wholly) be attributed to mantle dynamic topography. We use RDAs corrected for sediment loading and crustal basement thickness variations to determine present day residual topography measurements for the offshore Iberian, northern Angolan and the Gulf of Aden rifted continental margins. We have compared residual topography extracts from global models (Crosby and McKenzie, 2009; Flament et al., 2013; Kaban et al., 2003; Steinberger, 2007) to our measurements of residual topography from RDA analysis.
Chapter 1 - Introduction
P a g e |13 analysis, have been used together with continental lithosphere thinning factors predicted from gravity anomaly inversion and reverse post-breakup subsidence modelling to determine the palaeo-bathymetry of the base Aptian salt and its context within the OCT structure.
1.4.
Thesis Structure
The core of this thesis (chapters 2 ‒ 5) is presented as a series of journal papers. Due to this format, some background material and key concepts are repeated and re-introduced in each chapter.
Chapter 2 is presented in the form of a paper, entitled “Determining the COB Location along the Iberian Margin and Galicia Bank from Gravity Anomaly Inversion, Residual Depth Anomaly and Subsidence Analysis”. This paper describes the methodologies and applications of a suite of quantitative analytical techniques, which include gravity anomaly inversion, RDA and subsidence analysis, at the Iberian rifted continental margin. The work has focussed along three key profiles: ISE-01 along Galicia Bank and profiles IAM9 and Lusigal 12 (with the inclusion of the TGS extension) along the Iberian Abyssal Plain. Integrated quantitative analysis techniques have been used in order to determine the crustal structure of the OCT, locate the COB and determine magmatic type along the Iberian margin. The Iberian rifted continental margin is a natural laboratory, which has abundant observational data. As a consequence, we have used the Iberian margin to demonstrate and test the integrated quantitative analysis methodologies and techniques used in this thesis.
P a g e |14 location and magmatic type of the northern Angolan and south-eastern Brazilian rifted continental margins. In addition to the quantitative analysis techniques, a joint inversion technique using deep seismic reflection and gravity anomaly data has also been applied to these margins. The joint inversion method solves for coincident seismic and gravity Moho, in the time domain, and calculates the lateral variations in crustal basement densities and seismic velocities along profile, which provides further constraints on the OCT structure and COB location.
Chapter 4 is presented as a paper, entitled “The Palaeo-bathymetry of the Base Aptian Salt Deposition on the Angolan Rifted Margin: Constraints from Flexural Backstripping and Reverse Post-breakup Thermal Subsidence Modelling”. The bathymetric datum with respect to global sea level for Aptian salt deposition in the South Atlantic is hotly debated. Some models propose that the salt was deposited in an isolated ocean basin in which local sea level was between 2km and 3km below the global level. In this paper we propose several interpretations of the palaeo-bathymetric results for the depositional environment of the salt along the northern Angolan margin.
Chapter 1 - Introduction
P a g e |15 and at shorter wavelengths. We compare our detailed measurements of residual topography made using RDA analysis for Iberia, Gulf of Aden and northern Angola with measurements extracted from these global models of residual topography.
Chapter 6 is a discussion and summary of the methodologies and results obtained in this thesis.
P a g e |16
1.5.
References
Boillot, G., Feraud, G., Recq, M., and Girardeau, J., 1989, Undercrusting by serpentinite beneath rifted margins: Nature, v. 341, no. 6242, p. 523 - 525.
Boillot, G., Grimaud, S., Mauffret, A., Mougenot, D., Kornprobst, J., Mergoil-Daniel, J., and Torrent, G., 1980, Ocean-continent boundary off the Iberian margin: A serpentinite diapir west of the Galicia Bank: Earth and Planetary Science Letters, v. 48, no. 1, p. 23-34.
Bronner, A., Sauter, D., Manatschal, G., Peron-Pinvidic, G., and Munschy, M., 2011, Magmatic breakup as an explanation for magnetic anomalies at magma-poor rifted margins, Nature Geoscience, Volume 4, Nature Publishing Group, a division of Macmillan Publishers Limited. All Rights Reserved., p. 5.
Brun, J. P., and Beslier, M. O., 1996, Mantle exhumation at passive margins: Earth and Planetary Science Letters, v. 142, no. 1–2, p. 161-173.
Coffin, M. F., and Eldholm, O., 1994, Large igneous provinces: Crustal structure, dimensions, and external consequences: Reviews of Geophysics, v. 32, no. 1, p. 1-36.
Contrucci, I., Matias, L., Moulin, M., Géli, L., Klingelhofer, F., Nouzé, H., Aslanian, D., Olivet, J.-L., Réhault, J.-P., and Sibuet, J.-C., 2004, Deep structure of the West African continental margin (Congo, Zaïre, Angola), between 5°S and 8°S, from reflection/refraction seismics and gravity data: Geophysical Journal International, v. 158, no. 2, p. 529-553.
Crosby, A. G., and McKenzie, D., 2009, An analysis of young ocean depth, gravity and global residual topography: Geophysical Journal International, v. 178, no. 3, p. 1198-1219.
Davis, M., and Kusznir, N., 2004, Depth Dependant lithospheric Stretching at Rifted Continental Margins, in Karner, G. D., Taylor, B., Driscoll, N. W., and Kohlstedt, D. L., eds., Rheology and Deformation of the Lithosphere at Continental Margins, Columbia University Press, p. 408.
Dean, S. M., Minshull, T. A., Whitmarsh, R. B., and Louden, K. E., 2000, Deep structure of the ocean-continent transition in the southern Iberia Abyssal Plain from seismic refraction profiles: The IAM-9 transect at 40°20′N: Journal of Geophysical Research: Solid Earth, v. 105, no. B3, p. 5859-5885.
Chapter 1 - Introduction
P a g e |17 Franke, D., 2013, Rifting, lithosphere breakup and volcanism: Comparison of magma-poor and volcanic rifted margins: Marine and Petroleum Geology, v. 43, no. 0, p. 63-87.
Hinz, K., 1981, A hypothesis on terrestrial catastrophes: wedges of very thick oceanward dipping layers beneath passive continental margins - their origin and paleoenvironmental significance. : Geologisches Jahrbuch Reihe E, p. 3-28.
Hopper, J. R., Funck, T., Tucholke, B. E., Louden, K. E., Holbrook, W. S., and Christian Larsen, H., 2006, A deep seismic investigation of the Flemish Cap margin: implications for the origin of deep reflectivity and evidence for asymmetric break-up between Newfoundland and Iberia: Geophysical Journal International, v. 164, no. 3, p. 501-515.
Huismans, R., and Beaumont, C., 2011, Depth-dependent extension, two-stage breakup and cratonic underplating at rifted margins: Nature, v. 473, no. 7345, p. 74-78.
Kaban, M. K., Schwintzer, P., Artemieva, I. M., and Mooney, W. D., 2003, Density of the continental roots: compositional and thermal contributions: Earth and Planetary Science Letters, v. 209, no. 1–2, p. 53-69.
Kusznir, N. J., Hunsdale, R., Roberts, A. M., and i, S. T., 2005, Timing and magnitude of depth-dependent lithosphere stretching on the southern Lofoten and northern Vøring continental margins offshore mid-Norway: implications for subsidence and hydrocarbon maturation at volcanic rifted margins: Geological Society, London, Petroleum Geology Conference series, v. 6, p. 767-783.
Lavier, L. L., and Manatschal, G., 2006, A mechanism to thin the continental lithosphere at magma-poor margins: Nature, v. 440, no. 7082, p. 324-328.
Lucazeau, F., Leroy, S., Bonneville, A., Goutorbe, B., Rolandone, F., d’Acremont, E., Watremez, L., Düsünur, D., Tuchais, P., Huchon, P., Bellahsen, N., and Al-Toubi, K., 2008, Persistent thermal activity at the Eastern Gulf of Aden after continental break-up: Nature Geoscience, v. 1, no. 12, p. 854-858.
Manatschal, G., 2004, New models for evolution of magma-poor rifted margins based on a review of data and concepts from West Iberia and the Alps: International Journal of Earth Sciences, v. 93, no. 3.
Manatschal, G., Froitzheim, N., Rubenach, M., and Turrin, B. D., 2001, The role of detachment faulting in the formation of an ocean-continent transition: insights from the Iberia Abyssal Plain: Geological Society, London, Special Publications, v. 187, no. 1, p. 405-428.
P a g e |18 Manatschal, G., Sutra, E., and Péron-Pinvidic, G., The lesson from the Iberia-Newfoundland rifted margins: how applicable is it to other rifted margins?, in Proceedings 2nd Central & North Atlantic Conjugate Margins: Rediscovering the Atlantic, New Insights, New winds for an old sea2010, Volume 2, p. 27 - 37.
McKenzie, D., 1978, Some Remarks on the Development of Sedimentary Basins Earth and Planetary Science Letters, v. 40, p. 25-32.
Moulin, M., Aslanian, D., Olivet, J.-L., Contrucci, I., Matias, L., Géli, L., Klingelhoefer, F., Nouzé, H., Réhault, J.-P., and Unternehr, P., 2005, Geological constraints on the evolution of the Angolan margin based on reflection and refraction seismic data (ZaïAngo project): Geophysical Journal International, v. 162, no. 3, p. 793-810.
Pérez-Gussinyé, M., 2012, A tectonic model for hyperextension at magma-poor rifted margins: an example from the West Iberia–Newfoundland conjugate margins: Geological Society, London, Special Publications, v. 369.
Péron-Pinvidic, G., and Manatschal, G., 2008, The final rifting evolution at deep magma-poor passive margins from Iberia-Newfoundland: a new point of view: International Journal of Earth Sciences, v. 98, no. 7, p. 1581-1597.
Peron-Pinvidic, G., Manatschal, G., Minshull, T., and Sawyer, D., 2006, How is continental break-up recorded in magma-poor rifted margins?, American Geophysical Union, Fall Meeting: San Francisco, AGU.
Péron-Pinvidic, G., Manatschal, G., Minshull, T. A., and Sawyer, D. S., 2007, Tectonosedimentary evolution of the deep Iberia-Newfoundland margins: Evidence for a complex breakup history: Tectonics, v. 26, no. 2, p. TC2011.
Pickup, S. L. B., Whitmarsh, R. B., Fowler, C. M. R., and Reston, T. J., 1996, Insight into the nature of the ocean-continent transition off West Iberia from a deep multichannel seismic reflection profile: Geology, v. 24, no. 12, p. 1079-1082.
Reston, T., 2007, Extension discrepancy at North Atlantic nonvolcanic rifted margins: Depth-dependent stretching or unrecognized faulting?: Geology, v. 35, no. 4, p. 367-370.
Reston, T. J., 2009, The structure, evolution and symmetry of the magma-poor rifted margins of the North and Central Atlantic: A synthesis: Tectonophysics, v. 468, no. 1–4, p. 6-27. Steinberger, B., 2007, Effects of latent heat release at phase boundaries on flow in the Earth’s mantle, phase boundary topography and dynamic topography at the Earth’s surface: Physics of the Earth and Planetary Interiors, v. 164, no. 1–2, p. 2-20.
Chapter 1 - Introduction
P a g e |19 White, R. S., McKenzie, D., and O'Nions, R. K., 1992, Oceanic Crustal Thickness From Seismic Measurements and Rare Earth Element Inversions: Journal of Geophysical Research, v. 97, no. B13, p. 19683-19715.
P a g e |20
Chapter 2
2.
Determining the COB Location along the
Iberian Margin and Galicia Bank from Gravity
Anomaly Inversion, Residual Depth Anomaly and
Subsidence Analysis
Preface
Chapter 2 - Determining the COB Location along the Iberian Margin and Galicia Bank from Gravity Anomaly Inversion, Residual Depth Anomaly and Subsidence Analysis.
P a g e |21
Abstract
P a g e |22
2.1.
Introduction
Knowledge of the structure of the ocean continent transition (OCT), the location of the continent ocean boundary (COB), magmatic type (i.e. the volume of magmatic addition, whether the margin is ‘normal’ magmatic, magma-poor or magma-rich) and the distribution of oceanic and continental lithosphere are key to understanding present day rifted continental margin architecture and evolution. The determination of rifted continental margin magmatic type and OCT structure, which show great diversity globally, are important for understanding the geodynamic, tectonic and magmatic processes involved in rifted continental margin formation and their evolution to the present day. Understanding structure and formation processes of rifted continental margins is important, not only because they are a key component of the plate tectonic Wilson cycle (Wilson, 1966) but also for deep-water hydrocarbon exploration. In this chapter, we present a set of integrated quantitative analysis techniques for determining OCT structure, COB location and magmatic type at rifted continental margins, which have been applied and tested on the Iberian rifted continental margin, where independent observations from ODP wells are available for ground-truthing.
Chapter 2 - Determining the COB Location along the Iberian Margin and Galicia Bank from Gravity Anomaly Inversion, Residual Depth Anomaly and Subsidence Analysis.
P a g e |23 and the presence of any isolated ribbons of thinned continental crust and (iii) determining the magmatic type of a rifted continental margin.
The Iberian rifted continental margin has abundant observational data; including seismic reflection and refraction surveys, magnetic anomalies and ODP well data. As a consequence it is a good natural laboratory for studying rifted continental margin evolution and has been used to demonstrate and test the methodologies and techniques used in this chapter to determine OCT structure, COB location and magmatic type. On the Iberian rifted continental margin, there have been many studies, which have addressed these and other questions. The application of seismic reflection and refraction data (e.g. Dean et al. (2000); Pickup et al. (1996); Whitmarsh et al. (1996)) and also seismic tomography (e.g. Zelt et al. (2003)) has focussed on the determination of the OCT structure and the identification of the inner and outer bounds of the OCT. Detailed seismic mapping and borehole data have also been applied in order to further constrain the crustal type (e.g. Péron-Pinvidic et al. (2007)), whilst magnetic anomalies have been used to tentatively locate the COB (e.g. Bronner et al. (2011)). The determination of the magmatic type of a margin has been further constrained using seismic reflection data, magnetic anomalies and ODP well data as discussed in Pickup et al. (1996).
P a g e |24 been interpreted individually and together to identify the distribution of oceanic and thinned continental crust, in order to determine the structure of the OCT and locate the COB.
Chapter 2 - Determining the COB Location along the Iberian Margin and Galicia Bank from Gravity Anomaly Inversion, Residual Depth Anomaly and Subsidence Analysis.
[image:32.595.206.434.80.481.2]P a g e |25
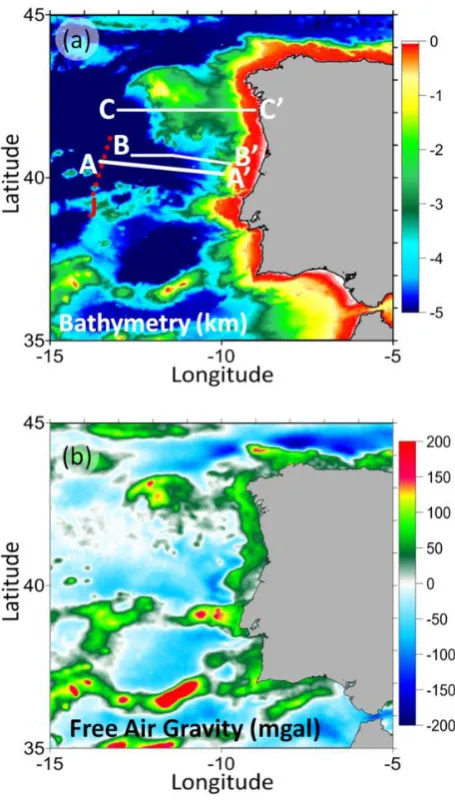
Figure 2.1 – Data used in the gravity anomaly inversion, RDA and subsidence analysis for the Iberian Abyssal Plain and Galicia Bank. (a) Bathymetry (km) (Amante and Eakins 2009). Locations of profiles IAM9 (A-A’), Lusigal 12 (with the TGS extension) (B-B’) and ISE-01 (C-C’) are indicated. The red dashed line indicates the location of the J anomaly (Bronner et al., 2011; Dean et al., 2000; Whitmarsh et al., 2001). (b) Free air gravity (mgal) (Sandwell and Smith 2009).
P a g e |26 determining the location of the COB is made difficult by the presence of exhumed mantle and complex tectonics. Another important term used is continental breakup age, which within this chapter is associated with the onset of seafloor spreading. Conceptually the term continental breakup may be used to either describe the point at which the continental crust ruptures and starts to separate, or when plate boundaries are localised by the onset of decompression melting and the onset of seafloor spreading.
2.2.
OCT Structure and COB Location: Profile IAM9
Integrated quantitative analysis has been used to determine OCT structure, COB location and magmatic type along profile IAM9 (A-A’). Profile IAM9 has been used to describe the gravity anomaly inversion, RDA analysis and subsidence analysis techniques in detail due to the availability of reliable seismic Moho depths (Dean et al., 2000), which are required for calibration of the reference Moho depth.
2.2.1. Crustal Basement Thickness and Continental Lithosphere Thinning along
IAM9 from Gravity Anomaly Inversion
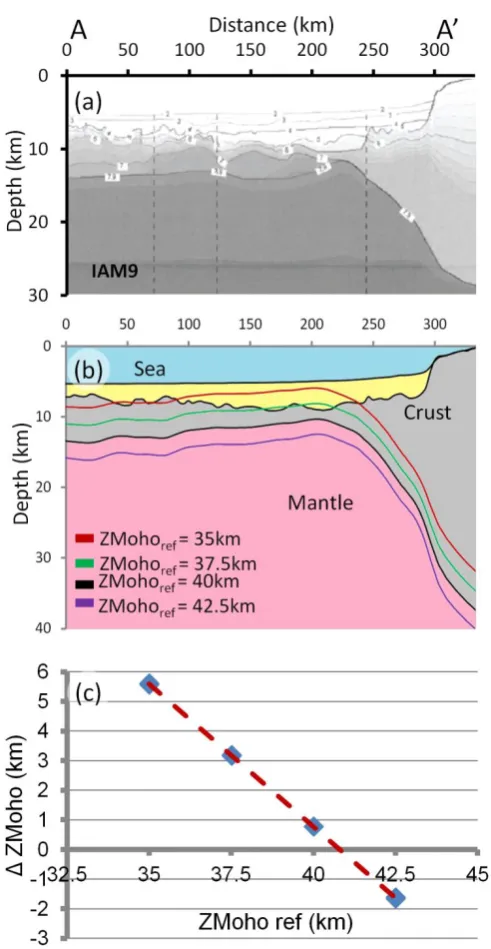
Gravity anomaly inversion has been used to determine crustal basement thickness, Moho depth and continental lithosphere thinning, which in turn give the distribution of oceanic and continental lithosphere. The data used within the gravity anomaly inversion are bathymetry (Amante and Eakins, 2009) (Figure 2.1(a)), satellite derived free air gravity (Sandwell and Smith, 2009) (Figure 2.1(b)), 2D sediment thickness from wide angle seismic data (Dean et al., 2000) (Figure 2.2(a)) and ocean age isochrons from Müller et al. (2008).
Chapter 2 - Determining the COB Location along the Iberian Margin and Galicia Bank from Gravity Anomaly Inversion, Residual Depth Anomaly and Subsidence Analysis.
P a g e |27 thickness. As the gravity anomaly inversion has been applied to rifted continental margin lithosphere, a lithosphere thermal gravity anomaly correction is incorporated to account for the elevated geothermal gradient within oceanic and rifted continental margin lithosphere. Failure to include the correction for the lithosphere thermal gravity anomaly can lead to predictions of Moho depth and crustal basement thickness at rifted continental margins, which are substantially too great. The results from gravity anomaly inversion are dependent on the age of continental breakup due to the lithosphere thermal gravity anomaly correction being dependent on the lithosphere thermal re-equilibration time. Some papers consider the age of breakup for the Iberian margin to be at the Aptian-Albian boundary, 112Ma (Péron-Pinvidic et al., 2007); whereas others consider an older breakup age of 126Ma, (Manatschal, 2004; Russell and Whitmarsh, 2003). As the gravity anomaly inversion requires a definitive breakup age, a Cretaceous breakup age of 120Ma, which is within this proposed range, has been examined. Changing the breakup age used within the gravity anomaly inversion to the maximum breakup age proposed, 126Ma, or to the minimum breakup age proposed, 112Ma, has a small effect on the results, but does not substantially change the overall conclusions. A more detailed methodology of the gravity anomaly inversion technique is described in Cowie and Kusznir (2012), Alvey et al. (2008), Chappell and Kusznir (2008) and Greenhalgh and Kusznir (2007).
P a g e |28 basement density of 2850kgm-3 (Carlson and Herrick, 1990; Christensen and Mooney, 1995) and a mantle density of 3300kgm-3 are used in the gravity anomaly inversion; sensitivity tests to these values have been made.
Chapter 2 - Determining the COB Location along the Iberian Margin and Galicia Bank from Gravity Anomaly Inversion, Residual Depth Anomaly and Subsidence Analysis.
[image:36.595.196.442.72.547.2]P a g e |29
Figure 2.2 - Calibration of the reference Moho depth used in the gravity anomaly inversion along profile IAM9. (a) Wide-angle seismic data for IAM9 (Dean et al. 2000) showing Moho depth. (b) Moho depths predicted from gravity anomaly inversion have been calculated using reference Moho depths of 35km, 37.5km, 40km and 42.5km. (c) Calibration of the reference Moho depth for profile IAM9 shows that a reference Moho depth of 41km is required.
P a g e |30 (A-A’) shows the distribution of oceanic and continental crust and hence the structure of the OCT. The red dashed line shows the 7.9kms-1 iso-velocity contour (Dean et al., 2000) representing the seismic Moho depth. There is a good correlation between the Moho depths predicted from gravity anomaly inversion, using the calibrated reference Moho depth of 41km, and the seismic Moho depths; crustal basement thicknesses between 5km and 7km are predicted at the western end of the profile. In the centre of the profile (between 100km and 200km) the crustal basement thicknesses predicted from gravity anomaly inversion thin considerably, to between approximately 1.5km and 2km, and the gravity anomaly inversion predicts a shallower Moho depth than predicted by the 7.9kms-1 iso-velocity contour. The start of the margin hinge region again shows a good correlation between the Moho depths predicted from gravity anomaly inversion and the seismic Moho depths. Under the continental crust inboard of the margin hinge there is a significant difference between the gravity anomaly inversion predicted Moho depths and the seismic Moho depths. This difference can be attributed to the poor seismic resolution and too thin estimate of sediment thicknesses in this region. A thicker sedimentary package at the continental end of the profile (A’) would cause the Moho depths predicted from gravity anomaly inversion beneath the continental crust to become shallower. The difference could also be due to errors in the seismic Moho depth in this region, as there are no OBS stations this far inboard of the hinge.
Chapter 2 - Determining the COB Location along the Iberian Margin and Galicia Bank from Gravity Anomaly Inversion, Residual Depth Anomaly and Subsidence Analysis.
P a g e |31
γ = 1 −1β (1)
Chapter 2 - Determining the COB Location along the Iberian Margin and Galicia Bank from Gravity Anomaly Inversion, Residual Depth Anomaly and Subsidence Analysis.
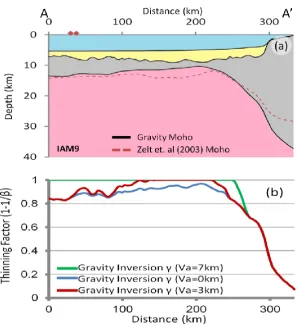
[image:40.595.173.472.76.406.2]P a g e |33
Figure 2.3 - (a) Crustal cross section (A-A’) along profile IAM9 is constructed using bathymetry (Amante and Eakins 2009), 2D sediment thickness (Dean et al. 2000) and Moho depth from gravity anomaly inversion. The red dashed line shows the 7.9kms-1 iso-velocity contour (Dean et al. 2000) representing the seismic Moho
P a g e |34
2.3.
Residual Depth Anomaly Analysis: Profile IAM9
2.3.1. Sediment Corrected RDA
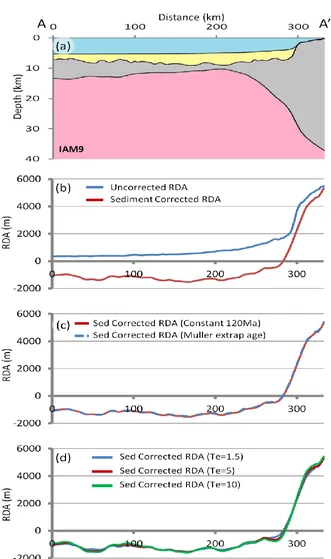
Residual depth anomaly (RDA) analysis has been applied to the Iberian rifted continental margin in order to examine OCT bathymetric anomalies with respect to expected oceanic bathymetries at the rifted continental margin. A RDA for oceanic crust is the difference between observed (bobs) and ocean age predicted bathymetry (bpredicted). Age predicted bathymetric anomalies have been calculated using the thermal plate model predictions from Crosby and McKenzie (2009). Sensitivities to the thermal plate model predictions from Parsons and Sclater (1977) and Stein and Stein (1992) have also been examined; RDA results computed using these different thermal plate model predictions do not vary significantly.
RDA = bobs− bpredicted (2)
Chapter 2 - Determining the COB Location along the Iberian Margin and Galicia Bank from Gravity Anomaly Inversion, Residual Depth Anomaly and Subsidence Analysis.
[image:42.595.152.483.70.629.2]P a g e |35
Chapter 2 - Determining the COB Location along the Iberian Margin and Galicia Bank from Gravity Anomaly Inversion, Residual Depth Anomaly and Subsidence Analysis.
P a g e |37
Figure 2.5 – 2D flexural backstripping comprises the successive removal of the sedimentary load and decompaction of the remaining sediments, considering the flexural isostatic response along profile IAM9. A Te=1.5km is assumed. (a) Present day depth section along the IAM9 profile, offshore Iberian Abyssal Plain. The sedimentary layer is highlighted in pink and the crust is in grey. (b) Flexurally backstripped to top basement with no thermal input to determine the sediment corrected bathymetry along IAM9.
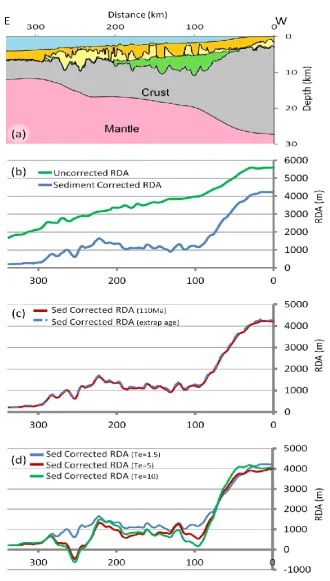
Age predicted oceanic bathymetries, used to calculate the sediment corrected RDA, are dependent on the oceanic lithospheric age. The Müller et al. (2008) global ocean age isochrons do not extend the entire length of profile IAM9; it is therefore necessary to consider sensitivities to oceanic lithospheric age. Two approaches have been examined: the first uses a constant value of 120Ma for the profile, whilst the second uses Müller et al. (2008) age isochrons with their age gradient extrapolated inboard. A comparison and sensitivity of the sediment corrected RDA results to ocean age isochrons is shown in Figure 2.4(c), both approaches produce similar results.
P a g e |38 determined for syn-rift extensional settings (Roberts et al., 1998). Te depends on the bending stresses applied to the plate, the rate of stress application, the lithosphere composition and the geothermal gradient (Kusznir and Karner, 1985). The sensitivity to Te is shown for the Iberian Abyssal Plain sediment corrected RDA results in Figure 2.4(d); sensitivities to Te’s of 1.5km, 5km and 10km have been examined. Te’s of 1.5km, 5km and 10km produce sediment corrected RDAs of similar magnitude; a Te of 1.5km has been used due to the negligible difference in the magnitude of the sediment corrected RDAs.
2.3.2. RDA Component from Crustal Basement Thickness Variations (RDACT)
In addition to the RDA corrected for sediment loading, the RDA component from variations in crustal basement thickness (RDACT) has also been computed, which is the result of the presence of anomalously thick or thin crust. Crustal basement thicknesses from gravity anomaly inversion are used to predict departures from the average global oceanic crustal thickness of 7km (White et al., 1992). The RDACT has been computed using the difference between the gravity anomaly inversion predicted crustal basement thickness (tcgrav) and the average global oceanic crustal basement thickness (tcref) together with Airy isostasy. The local isostatic response to variation in gravity inverted non-continental crustal thickness, from the 7km global average oceanic crustal thickness (tcref) is given by:
RDACT = (tcref−tcgrav)(ρm−ρc)
(ρm−ρinfil) (3)
where ρm is the density of the mantle (3300kgm-3), ρc is the density of the crust (2850kgm-3)
and ρinfill is the density of the water infill (1000kgm-3). Crust, which is approximately 7km
Chapter 2 - Determining the COB Location along the Iberian Margin and Galicia Bank from Gravity Anomaly Inversion, Residual Depth Anomaly and Subsidence Analysis.
P a g e |39
Figure 2.6 - (a) Crustal cross section A-A’ along the IAM9 profile. (b) Sediment corrected RDA and the RDA component from crustal thickness variations (RDACT) along IAM9. Both the sediment corrected RDA and the
RDACT are negative; the sediment corrected RDA ranges between -1500m and -1000m, whereas the RDACT
ranges between -500m and zero. (c) The negative sediment corrected RDA, further corrected for variations in crustal basement thickness (ΔRDA), implies mantle dynamic subsidence.
P a g e |40
2.3.3. Sediment Corrected RDA Further Corrected for Crustal Basement
Thickness Variations (ΔRDA)
Figure 2.6(b) shows the sediment corrected RDA and the RDACT along profile IAM9, with reference to the crustal cross-section (Figure 2.6(a)). In unequivocal oceanic regions it is expected that the RDA signal, from both the sediment corrected RDA and the RDACT, will be constant and near zero, whereas for regions of thicker continental crust it is expected that the RDA signals will show a positive trend. Changes in the RDA signal may be used to identify the change in crustal type and hence locate the COB. Figure 2.6(b) shows that at the western end of the profile and in the peridotite ridge region the sediment corrected RDA ranges between -1000m and -1500m, implying either the presence of crust which is thinner than 7km, or anomalous subsidence. The RDACT ranges between zero and -800m at the western end of the profile, which becomes more negative in the peridotite ridge region, between -800m and -1000m; the negative RDACT corresponds to either the presence of crust, which is thinner than 7km, or the presence of exhumed mantle. Both the sediment corrected RDA and the RDACT along profile IAM9 are negative in the western and central region and show the same general trend along the profile although they have different magnitudes.
The difference (ΔRDA) between the sediment corrected RDA and the RDACT has been computed in order to determine whether there is any anomalous subsidence or uplift along the Iberian rifted continental margin.
∆RDA = sediment corrected RDA − RDACT (4)
Chapter 2 - Determining the COB Location along the Iberian Margin and Galicia Bank from Gravity Anomaly Inversion, Residual Depth Anomaly and Subsidence Analysis.
P a g e |41 between -300m and -1000m at the western end of the profile, which is equated to mantle dynamic subsidence.
2.4.
Continental Lithosphere Thinning from Subsidence Analysis
Subsidence analysis has been used to determine the distribution of continental lithosphere thinning and the distal extent of continental crust in order to locate the inner and outer bounds of the OCT. Subsidence analysis involves the conversion of water loaded subsidence into continental lithosphere thinning factors, assuming McKenzie (1978). Flexural backstripping is used to give the sediment corrected bathymetry to top pre-rift and top oceanic crust. It is assumed that the initial datum of original continental pre-rift surface was at or near to sea level; therefore the sediment corrected bathymetry can be equated to water loaded subsidence. Water loaded subsidence is interpreted as the sum of initial (Si) and thermal (St) subsidence in the context of the McKenzie (1978) intra-continental rift model. A correction for magmatic addition due to adiabatic decompression (White and McKenzie, 1989) during continental rifting and seafloor spreading has been included and uses the same scheme as described earlier in the gravity anomaly inversion section. Magmatic addition from decompression melting results in thicker crust due to volcanic intrusion and extrusion, which isostatically reduces the initial subsidence as predicted by McKenzie (1978) and corresponds to the formation of oceanic crust. Magmatic addition also increases the thickness of the crust thinned by lithosphere stretching.
Péron-P a g e |42 Pinvidic et al., 2007). Sensitivity tests using upper and lower bounds of the time of breakup (126 and 112 Ma) have been examined and the results are not significantly different. The crustal thinning load is assumed to be constant after rifting, while the thermal subsidence varies with time due to the dissipation of the syn-rift lithosphere thermal anomaly. Instantaneous rifting is assumed, which allows the comparison of the numerically calculated total subsidence from flexural backstripping with that analytically calculated using McKenzie (1978) modified for magmatic additions. Magmatic additions due to decompression melting modify the predicted relationship between thinning factor (γ) and water loaded subsidence. Water loaded subsidence is inverted using the curves (Figure 2.7(a)) to give continental lithosphere thinning factors.
Chapter 2 - Determining the COB Location along the Iberian Margin and Galicia Bank from Gravity Anomaly Inversion, Residual Depth Anomaly and Subsidence Analysis.
P a g e |43
P a g e |44 Changes in continental lithosphere thinning factors calculated from subsidence analysis, from high thinning factors (between 0.8 and 1.0) to lower thinning factors can be used to determine the distribution of continental lithosphere thinning and further constrain the COB location along profile IAM9. The quantitative analytical method assumes depth uniform stretching and thinning, as a consequence thinning factors for continental lithosphere and crust are identical.
2.5.
OCT Structure and COB Location along the Lusigal 12 Profile
2.5.1. Crustal Basement Thickness and Continental Lithosphere Thinning along
Lusigal 12 from Gravity Anomaly Inversion
Chapter 2 - Determining the COB Location along the Iberian Margin and Galicia Bank from Gravity Anomaly Inversion, Residual Depth Anomaly and Subsidence Analysis.
P a g e |45
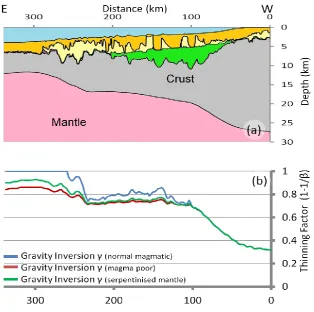
P a g e |46 Continental lithosphere thinning factors (γ) predicted from gravity anomaly inversion are shown in Figure 2.8(c). Sensitivities to a magma-poor solution (Va=0 km), a 'normal' magmatic solution (Va=7 km) and a solution for serpentinized mantle have been examined. Continental lithosphere thinning factors from gravity anomaly inversion show high thinning factors for all three solutions at the western end of the profile. At the western end of the profile, the 'normal' magmatic solution and the serpentinized mantle solution predict continental lithosphere thinning factors of a similar magnitude (approximately 1.0) indicating no continental lithosphere remains, whereas the magma-poor solution predicts continental lithosphere thinning factors of 0.9 for the same region.
2.5.2. RDAs corrected for Sediment Loading and Crustal Basement Thickness
Variations along Lusigal 12
Chapter 2 - Determining the COB Location along the Iberian Margin and Galicia Bank from Gravity Anomaly Inversion, Residual Depth Anomaly and Subsidence Analysis.
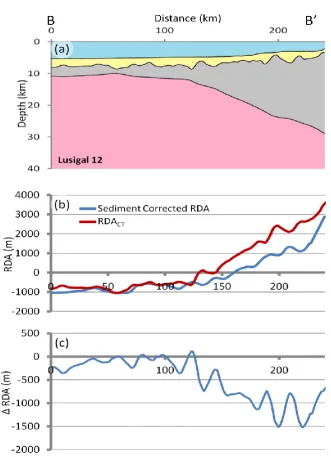
[image:54.595.154.486.72.530.2]P a g e |47
Figure 2.9 - (a) Crustal cross section B-B’ along Lusigal 12. (b) Sediment corrected RDA and the RDA component from crustal thickness variations (RDACT) along Lusigal 12. Both the sediment corrected RDA and the RDACT are
negative; the sediment corrected RDA ranges between -1500m and -500m, whereas the RDACT ranges between
-1000m and -800. (c) The sediment corrected RDA, further corrected for variations in crustal basement thickness (ΔRDA), is negative implying mantle dynamic subsidence.
2.5.3. Continental Lithosphere Thinning from Subsidence Analysis along
Lusigal 12
P a g e |48 factors from subsidence analysis are between 0.85 and 1.0, indicative of oceanic crust or possibly exhumed mantle. Sensitivities to the three magmatic solutions have been examined. Assuming a ‘normal’ magmatic solution, subsidence analysis predicts continental lithosphere thinning factors of 1.0 at the western end of the profile, indicating the presence of oceanic crust. The magma-poor (Va=0km) solution and the solution for serpentinized mantle are of similar magnitude, with negligible difference between them, and predict continental lithosphere thinning factors that range between 0.9 and 1.0. The negligible difference between the solution for serpentinized mantle and a magma-poor (Va=0km) solution implies the presence of exhumed mantle.
Chapter 2 - Determining the COB Location along the Iberian Margin and Galicia Bank from Gravity Anomaly Inversion, Residual Depth Anomaly and Subsidence Analysis.
P a g e |49
2.6.
OCT Structure and COB Location along Profile ISE-01
2.6.1. Crustal Basement Thickness and Continental Lithosphere Thinning along
ISE-01 from Gravity Anomaly Inversion
P a g e |50
Chapter 2 - Determining the COB Location along the Iberian Margin and Galicia Bank from Gravity Anomaly Inversion, Residual Depth Anomaly and Subsidence Analysis.
P a g e |51 Figure 2.11(d) shows continental lithosphere thinning factor (γ) estimates from gravity anomaly inversion for profile ISE-01 assuming a magma-poor model (Va=0 km); a ‘normal’ magmatic solution (Va=7 km) and a solution for serpentinized mantle. Continental lithosphere thinning factors from gravity anomaly inversion show high values of thinning factors for all three magmatic solutions at the western end of the profile. A ‘normal’ magmatic solution (Va=7km) predicts thinning factors of 1.0 at the western end of the profile, whereas a solution for serpentinized mantle predicts thinning factors that increase from 0.8 to just less than 1.0 and a magma-poor solution predicts thinning factors that increase from 0.8 to 0.9 in the same region.
2.6.2. RDAs Corrected for Sediment Loading and Crustal Basement Thickness
Variations along ISE-01
P a g e |52
Figure 2.12 - (a) Crustal cross section C-C’ along ISE-01. (b) Sediment corrected RDA and the RDA component from crustal thickness variations (RDACT) along ISE-01. Both the sediment corrected RDA and the RDACT are
negative; the sediment corrected RDA ranges between -800m and zero, whereas the RDACT ranges between
-1000m and zero. (c) The sediment corrected RDA, further corrected for variations in crustal basement thickness (ΔRDA), is zero at the western end of the profile implying that there is no mantle dynamic topography.
2.6.3. Continental Lithosphere Thinning from Subsidence Analysis along ISE-01
Chapter 2 - Determining the COB Location along the Iberian Margin and Galicia Bank from Gravity Anomaly Inversion, Residual Depth Anomaly and Subsidence Analysis.
P a g e |53 serpentinised mantle have been examined. A ‘normal’ magmatic solution predicts continental lithosphere thinning factors of 1.0 at the western end of the profile; the solution for serpentinized mantle and a magma-poor solution are of similar magnitude, with negligible difference between them, and predict thinning factors that range between 0.9 and just less than 1.0 in the west implying the presence of exhumed mantle.
P a g e |54
2.7.
Predicting OCT Structure and COB Location
The previous sections have shown the results from integrated quantitative analysis using gravity anomaly inversion, RDA and subsidence analysis, applied to IAM9 and Lusigal 12 in the Iberian Abyssal Plain and ISE-01 on Galicia Bank. Gravity anomaly inversion has been used to predict Moho depth and crustal basement thickness, whilst departures from the standard oceanic water depths are derived from RDA analysis. Continental lithosphere thinning factors are determined from both subsidence analysis and gravity anomaly inversion. These techniques may all be used to predict the transition from continental to oceanic crust. However, the results from each technique need to be examined together, to constrain our interpretation of the OCT structure, COB location and magmatic type of the Iberian margin. For each of the three profiles considered a composite analysis plot is used to summarize the results from gravity anomaly inversion, RDA analysis and subsidence analysis, as shown in Figures 2.14, 2.15 and 2.16. The composite analysis plot consists of (i) a crustal cross section from gravity anomaly inversion, (ii) sediment corrected RDA and RDACT along profile and (iii) a comparison of the continental lithosphere thinning factors predicted from gravity anomaly inversion and subsidence analysis. The analysis of the composite plot allows for an informative interpretation of the OCT structure, COB location and magmatic type to be made, when the crustal domains are clearly defined.
Chapter 2 - Determining the COB Location along the Iberian Margin and Galicia Bank from Gravity Anomaly Inversion, Residual Depth Anomaly and Subsidence Analysis.
P a g e |55 structure and COB location determined from integrated quantitative analysis with that inferred from direct well observations.
2.7.1. IAM9
The composite analysis plot for profile IAM9 in the Iberian Abyssal Plain (Figure 2.14) is interpreted as showing three distinct crustal zones: zone A - oceanic crust; zone B - serpentinised exhumed mantle; and zone C - thinned continental crust. The location of each of these three zones is based on crustal basement thickness from gravity anomaly inversion, variations in the RDA signal from the sediment corrected RDA and RDACT, and continental lithosphere thinning factors derived from subsidence analysis and gravity anomaly inversion.
P a g e |56
Figure 2.14 – Composite analysis plot along IAM9, showing interpretations of crustal zones made from the integrated quantitative analysis. (a) Crustal cross section along profile IAM9 (A-A’) from gravity anomaly inversion (b) Sediment corrected RDA and the RDA component from crustal thickness variations (RDACT) along
Chapter 2 - Determining the COB Location along the Iberian Margin and Galicia Bank from Gravity Anomaly Inversion, Residual Depth Anomaly and Subsidence Analysis.
P a g e |57 Zone A – oceanic crust
In zone A, the crustal basement thicknesses from gravity anomaly inversion are between 6km and 7km. The sediment corrected RDA and RDACT are both negative in this region. The negative sediment corrected RDA is indicative of crust which is thinner than 7km or anomalous subsidence, whilst the negative RDACT corresponds to the presence of thin crust derived from gravity anomaly inversion. The continental lithosphere thinning factors in zone A derived from gravity anomaly inversion and subsidence analysis using ‘normal’ magmatic solution (Va=7km) are 1.0, implying the presence of oceanic crust. If a magma-poor solution (Va=0km) is assumed, the thinning factors range between 0.85 and 1.0, which implies very thin continental crust or serpentinised exhumed mantle. However, at the western end of zone A, a ‘normal’ magmatic solution is preferred.
The interface between zones A and B corresponds to the boundary between oceanic crust and serpentinised exhumed mantle and is located by the inflection points in Moho depth, RDA signal and continental lithosphere thinning factors determined assuming magma-poor solution.
Zone B – exhumed mantle
P a g e |58 factors from gravity anomaly inversion and subsidence analysis range between 0.9 and 1.0 assuming a magma-poor solution, whereas similarly to zone A, a ‘normal’ magmatic solution predicts thinning factors of 1.0.
The interface between zones B and C corresponds to the boundary between thinned continental crust and exhumed mantle and is located by the inflection points in Moho depth, RDAs and continental lithosphere thinning factors determined assuming magma-poor solution. Gravity anomaly inversion, RDA and subsidence analysis results show that the OCT along IAM9 is relatively narrow, with the distance between the COB and the margin hinge (the point at which the continental crust starts to thin) measuring approximately 100km.
Zone C- thinned continental crust
In zone C, the crustal basement thicknesses increase gradually to approximately 35km at the eastern end of the profile, although the poor resolution of sediment thickness in this region may result in an overestimate of Moho depth. Both the sediment corrected RDA and RDACT increase eastwards. The continental lithosphere thinning factors from gravity anomaly inversion and subsidence analysis show a corresponding eastwards decrease. Continental lithosphere thinning factors predicted from gravity anomaly inversion are generally in good agreement with the continental lithosphere thinning factors predicted from subsidence analysis. At the eastern end of the profile, zone C, a magma-poor solution is preferred.
2.7.2. Lusigal 12
Chapter 2 - Determining the COB Location along the Iberian Margin and Galicia Bank from Gravity Anomaly Inversion, Residual Depth Anomaly and Subsidence Analysis.
P a g e |59 the zones of serpentinised exhumed mantle and thinned continental crust, and their boundary, along Lusigal 12 can be validated against ODP well data.
Figure 2.15 - Composite analysis plot along Lusigal 12 (with TGS-extension) showing interpretations of crustal zones made from the integrated quantitative analysis, which have been compared to observations from ODP well data. (a) Crustal cross section along profile Lusigal 12 (B-B’) from gravity anomaly inversion. Locations of the ODP wells are indicated. (b) Sediment corrected RDA and the RDA component from crustal thickness variations (RDACT) along Lusigal 12. (c) Continental lithosphere thinning factors from subsidence analysis and
P a g e |60 Zone B – exhumed mantle
In zone B, the crustal basement thicknesses predicted, from gravity anomaly inversion, range between 2km and 4km (Figure 2.15(a)). These very low values of crustal thickness are interpreted as being indicative of serpentinised exhumed mantle (see earlier discussion for IAM9). Both the sediment corrected RDA and RDACT are negative in this region, ranging between -500m and -1500m (Figure 2.15(b)). The sediment corrected RDA is negative between -500m and -1500m, implying that the crust in this region is less than 7km or that there is anomalous subsidence. The RDACT ranges between -800m and -1000m, corresponding to the presence of thin crust or serpentinised exhumed mantle. The continental lithosphere thinning factors are high in zone B (Figure 2.15(c)); if a ‘normal’ magmatic solution (Va=7km) is assumed, the continental lithosphere thinning factors from gravity anomaly inversion and subsidence analysis are 1.0, implying the presence of oceanic crust. If a magma-poor solution is assumed, continental lithosphere thinning factors from subsidence analysis and gravity anomaly inversion range between 0.8 and 1.0 with an average of approximately 0.9, implying either very thin continental crust or serpentinised exhumed mantle. Continental lithosphere thinning factors predicted from gravity anomaly inversion and subsidence analysis are generally in good agreement. For zone B, a magma-poor solution is preferred, as it predicts high thinning factors without the requirement of magmatic addition (and the formation of oceanic crust).
Chapter 2 - Determining the COB Location along the Iberian Margin and Galicia Bank from Gravity Anomaly Inversion, Residual Depth Anomaly and Subsidence Analysis.
P a g e |61 Zone C - thinned continental crust
In zone C, crustal thicknesses predicted from gravity anomaly inversion increase eastwards towards the continent, as do the sediment corrected RDAs and RDACT, whilst the continental lithosphere thinning factors from gravity anomaly inversion and subsidence analysis decrease (Figure 2.15). This is indicative of zone C corresponding to thinned continental crust. A magma-poor solution for the prediction of RDA and continental lithosphere thinning factors is preferred for this zone.
Comparison with ODP well observations
P a g e |62
ODP Well
Depth (m)
Description
1070 719 Serpentinized peridotite
897 837 Serpentinized mantle
899 562 Serpentinized breccias
1069 959 Carbonates, upper crust
1068 956 Serpentinised peridotite (overlain by polymict breccias)
1067 856 Amphibolite, Minor tonalite, Meta-gabbros
1065 631 Pre-tectonic sediments (carbonates) over upper crust 901 248 Pre-tectonic sediments (carbonates) over upper crust
Table 2.1 – ODP well observations along Lusigal 12 (Boillot et al., 1987; Sawyer et al., 1994; Tucholke et al., 2007; Whitmarsh et al., 1998; Whitmarsh and Sawyer, 1996).
2.7.3. ISE-01
Interpretation of the composite analysis plots of profile ISE-01 on Galicia Bank (Figure 2.16) suggests that there are two crustal zones along the profile; these are zones B and C. Zone B is interpreted as thin oceanic crust (which may correspond to proto-oceanic crust) or exhumed mantle and zone C is interpreted as thinned continental crust. These interpretations, based on gravity anomaly inversion, RDA and subsidence analysis, are consistent with ODP well data on profile ISE-01. As with Lusigal 12, no unequivocal oceanic crust of normal thickness (corresponding to zone A on the IAM9 profile) is evident on ISE-01.
Zone B – exhumed mantle