158
Ta (N
= 85)
Thesis submitted in accordance with the requirements of the University of
Liverpool for the degree of Doctor in Philosophy
by
Robert John Carroll
Oliver Lodge Laboratory
Professor Martin L. Perl, Winner of the 1995 Nobel Prize in Physics
“The things one feels absolutely certain about are never true.”
“The Picture of Dorian Gray” by Oscar Wilde
“Impossible is just a word to let people feel good about themselves when they quit.”
I would like to say a huge thank you to my supervisor Dr. David Joss for providing
the opportunity to work at the cutting edge of nuclear physics research and for his
many words of help and encouragement during my studies.
I would like to thank Prof. Robert Page for many useful and interesting discussions,
which often changed my perspective of the problems at hand.
I am incredibly grateful for the example set by Dr. Heidi Watkins, who was always
looking out for me. You have been a great role model and much valued friend.
Many thanks to Dr. David O’Donnell, Dr. Paul Sapple, John Revill and Liam
Gaffney for putting up with me bouncing ideas off you. Your thoughts have
al-ways been appreciated.
Thanks to all members of the Nuclear Physics group at the University of Liverpool
for being a very positive influence on my experiences here. Experiments,
confer-ences, the summer school and daily life would have been less use and much less
enjoyable without such a good group of friendly and intelligent people.
I would like to thank the staff at the University of Jyv¨askyl¨a for many a patient
explanation of the more subtle aspects of the experimental apparatus.
I would like to recognise the collaborators involved in this research and thank them
for their contributions.
I would also like to acknowledge the financial support of the STFC, which has
facil-itated my involvement in this research.
Finally, I would like to say a big thank you to all of my friends and family for their
support. In particular, members of the Liverpool University Fencing Club have
made this time a very enjoyable one for me and have provided an effective relief to
Excited states in 155Lu and 158Ta have been populated in fusion evaporation
reac-tions at the Accelerator Laboratory at the University of Jyv¨askyl¨a. Gamma-ray
spectroscopy techniques have been employed, using both the Jurogam spectrom-eter at the target position and the GREAT spectromspectrom-eter at the focal plane of the
RITU separator, and level schemes have been constructed.
Gamma-ray spectroscopy performed on155Lu has revealed new structures at high
spin and has confirmed spin isomerism as the mechanism by which the decay of the
155m2Lu
(25/2−) state is hindered. The previous level scheme has been revised and
compared with systematic trends acrossN = 84 isotones. Single-particle configura-tions have been assigned to low-lying states and mechanisms expected to construct
structures at higher spin are discussed.
Previously, no excited states in the doubly odd 158Ta nucleus were known above
the two low-lying α-decaying states, which are proton unbound. For the first time, excited states built on the 158m1Ta
(9+) α-decaying state have been observed.
Com-parisons with N = 85 isotones are made and the interactions between nucleons in the πh11/2,νh9/2 and νf7/2 orbitals are discussed.
A new isomeric state, which decays by both α-particle and γ-ray emission, has been observed at high spin in 158Ta. No proton decay is observed from this state,
despite a large proton Q-value. This hindrance to proton decay can be understood
to be an effect of the centrifugal barrier at high spin. This introduces the possibility
1 Introduction 8
2 Physics background 12
2.1 Nuclear models . . . 12
2.2 The drip lines . . . 16
2.3 Gamma-ray transitions . . . 18
2.4 Radioactive α decay . . . 22
3 Experimental Apparatus and Methodology 27 3.1 Heavy-ion fusion evaporation reactions . . . 27
3.2 Challenges for spectroscopy . . . 30
3.3 Experimental Apparatus . . . 31
3.3.1 The Jurogamspectrometer . . . 31
3.3.2 The RITU separator (Recoil Ion Transport Unit) . . . 34
3.3.3 The GREAT spectrometer (Gamma Recoil Electron Alpha Tagging) . . . 36
3.3.4 Total Data Read-out (TDR) . . . 39
3.4 Experimental Techniques . . . 40
3.4.1 The Recoil Decay Tagging (RDT) Technique . . . 40
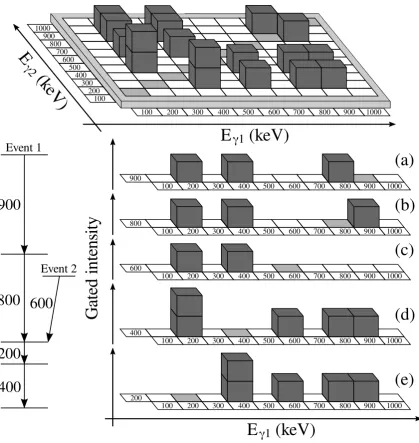
3.4.2 Gamma-ray correlations . . . 44
3.4.5 Doppler-shift correction . . . 52
3.4.6 Gamma-ray coincidences . . . 53
3.4.7 Background and contamination . . . 56
4 Multiparticle configurations of excited states in 155Lu 61 4.1 Results . . . 64
4.1.1 Transitions feeding the (3/2+) isomer . . . 67
4.1.2 Levels above the (11/2−) isomer . . . 69
4.1.3 Levels above the (25/2−) isomer . . . 77
4.2 Discussion . . . 85
4.2.1 Nucleon configurations of low-lying states . . . 86
4.2.2 The (25/2−) isomer configuration . . . 88
4.2.3 Systematic trends of low-lying states across N = 84 isotones . 89 4.2.4 Configurations above the (25/2−) isomer . . . 91
4.3 Conclusions . . . 93
5 First observation of excited states and radioactive decays in 158Ta 96 5.1 Results . . . 98
5.1.1 Identification of 158Taγ rays . . . 98
5.1.2 Transitions below the high-spin isomer . . . 102
5.1.3 Transitions feeding the high-spin isomer. . . 110
5.1.4 Transitions bypassing the high-spin isomer . . . 117
5.1.5 Decays from the high-spin isomer . . . 123
5.2 Discussion . . . 130
5.2.1 Nucleon configurations of low lying states . . . 130
5.2.2 The (19−) isomer configuration . . . 133
5.2.5 High-spin isomerism beyond the proton drip line . . . 140
5.3 Conclusions . . . 140
Introduction
The atomic nucleus is a unique system that is home to phenomena that cannot be
found in any other known system. It is a many-body system whose properties are
defined by the behaviour of its constituent nucleons, which are strongly interacting
fermions. The nucleus is poorly understood on a microscopic level. The interactions
between nucleons themselves is a many-body problem that has yet to be solved
and so a “bottom up” approach to understanding the nucleus is of limited use.
Furthermore, the amount of computing time required to perform such calculations
on all but the lightest nuclei is completely unfeasible.
The solution to this problem has been to develop nuclear models that describe the
observed phenomena as closely as possible and today the field of nuclear physics is
concerned with the development of such models and the acquisition of experimental
data with which to test their validity [1].
Although developing nuclear models vastly simplifies and streamlines the
prob-lems associated with describing the nucleus, there are still many difficulties facing
their development. There are thousands of different known nuclei [2] and the
dif-ference of a single nucleon can make large changes to the properties of the nucleus.
im-N
Z
N
SF
Unknown
Stable
EC+β+
β-α
P
84 85 82
Decay mode
164Ir 165Ir 166Ir 163Os164Os165Os 161Os162Os
161Re162Re163Re
159Re160Re 164Re
161W 162W 163W 159W 160W
157 158W
161Ta 162Ta 159Ta 160Ta
157Ta 155Ta 156Ta
161Hf 159Hf160Hf 157Hf 158Hf
153Hf154Hf 155Hf 156Hf
152Lu153Lu154Lu155Lu156Lu157Lu158Lu 159Lu160Lu
152Yb 159Yb
152Tm
150Tm151Tm 153Tm154Tm155Tm156Tm157Tm158Tm 151Yb 153Yb154Yb155Yb156Yb157Yb158Yb
W
[image:10.595.87.507.100.343.2]158Ta
Figure 1.1: The chart of nuclides indicating the mode by which nuclei decay [3]. The region aboveN = 82 close to the proton drip line is enlarged.
provements in accelerator and detector technology have pushed back the observable
limits, enabling more rigorous testing of the current models far from stability. Nuclei
under conditions such as extreme isospin, spin, mass and deformation are examples
of conditions where new phenomena may emerge resulting in stringent tests of
nu-clear models.
The chart of nuclides, shown in Figure 1.1, shows known nuclei as a function
of proton number Z and neutron number N. The chart depicts a line of stability for particular combinations of Z and N. The chart clearly shows separate regions, either side of the line of stability, which correspond to nuclei that are deficient in
either protons or neutrons. At the extremes of these regions are the proton and
neutron drip lines, beyond which protons and neutrons, respectively, are unbound
within the nucleus.
Such extremes provide an interesting testing ground for nuclear models because
Furthermore, the range of nuclides make it possible to study systematic trends across
chains of nuclei, displaying the effects of repeatedly adding or removing individual
nucleons from a system.
This work is concerned with nuclei close to the proton drip line and theN = 82 shell closure. In this region, nuclei can be considered as a number of valence particles
coupled to a semi-magic146Gd core and the orbitals available for nucleon occupation
are 1h11/2, 2d3/2 and 3s1/2 for protons, and 2f7/2, 1h9/2 and 1i13/2 for neutrons. The
experimental investigation of isotone chains in such neutron-deficient nuclei is a
probe of the dependence of single-particle states, based on the coupling of a small
number of valence nucleons, on the atomic numberZ.
The 155Lu nucleus is the lowest Z isotone (N = 84) in which a high-spin 25/2− isomer, built upon a configuration of aligned neutrons, has been observed [4].
Al-though the nature of the isomerism is Al-thought to be due to the large spin change
between the initial and final states this has not been verified. The lowering in
excita-tion energy of the 25/2−state with respect to the 23/2−state acrossN = 84 isotones with increasing Z is considered to be the cause of such a spin change occurring in
155Lu but not in the lighter isotones. Gamma-ray spectroscopy has been performed
on excited states in 155Lu in order to confirm the nature of the high-spin isomer,
identify states above the isomer and assess the evolution of structure approaching
the proton drip line with increasing Z.
Experimental studies of N = 85 isotones have also been extended to excited states in doubly-odd158Ta, which is the lowest inZ beyond the proton drip line [5].
Prior to this work, nothing was known about excited states above the α-decaying (2−) and (9+) states, however, many of its isotones have been studied and show a
lowering in excitation energy of configurations involving ah9/2 neutron as a function
not been confirmed in nuclei as high inZ as159W (Z = 74) or160Re (Z = 75) [6], nor
has it been observed in156Lu [4]. Spectroscopy of excited states in158Ta has revealed
structures that have never been seen before and comparison with previously studied
isotones show how these structures have been affected by the increasing proton
Physics background
2.1
Nuclear models
The atomic nucleus is a complex system that comprises from one to hundreds of
nucleons all of which interact strongly with neighbouring nucleons but weakly with
those at distances greater than∼1 fm. This is a particularly difficult system to
de-scribe using the interactions of the individual particles and using calculations of this
sort to describe heavy elements would require an unfeasible amount of computing
power. The solution to this problem has been to develop mathematical models that
describe phenomena displayed by the nucleus. This reduces the problems associated
with calculating the properties of heavy nuclei by forming a more tractable problem.
One of the main assumptions is that each nucleon in the nucleus moves in a mean
field potential, which describes an effective interaction, rather than interacting with
many particles simultaneously. A particle confined within a potential is restricted
to discrete energies. Nucleons cannot transfer energy when they scatter due to the
limited availability of potential final states. The only unoccupied levels are at higher
excitation energies, usually out of the range of scattering energies.
of shell structure. Large energy differences between groups of levels, which are
close in energy or degenerate, form regions of high level density, or shells. When
a shell has vacancies, nucleons can be excited into higher energy states within the
shell with relative ease. When a shell is full, available levels for nucleon excitation
are much higher in energy and so the nucleus is more stable against excitation.
Experimental evidence for shell structure is abundant, in particular, the evidence
for magic numbers is indicative of the large energy differences that would be incurred
by the closure of a shell [1].
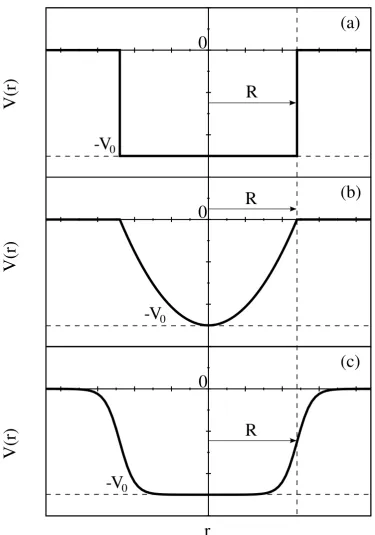
The choice of potential will affect the calculated magic numbers due to
differ-ences in the relative positions of the levels and so the development of a potential that
adequately describes this phenomenon is particularly important. Commonly
consid-ered potentials are the square well, harmonic oscillator and Woods-Saxon potentials,
Figure 2.1.
The square well potential is defined as
V(r) =
−V0 r≤R
0 r > R
, (2.1)
where r is the distance from the centre of the nucleus, R is the nuclear radius and
V0 is the depth of the well. The base of this potential is flat, which is representative
of the short range of the strong interaction. The edges of the square well are sharp
and offer no realistic description regarding the effective interaction at the surface
of the nucleus. The first two magic numbers can be correctly reproduced using the
square well potential [1].
The harmonic oscillator potential can be defined as
V(r) =
−V0[1−(r/R)2] r ≤R
0 r > R
r
V(r)
V(r)
V(r)
(c)
(b)
(a)
R
R
0
0
0
-V
0-V
0-V
0 [image:15.595.110.486.117.653.2]R
The sharp edges inherent to the square well are not present in this potential,
how-ever, a number of features of the harmonic oscillator do not accurately represent
nuclear behaviour. The potential gradually increases from the centre of the nucleus,
reminiscent of longer range forces that would cause nucleons to be attracted to the
centre of the nucleus, which is not the case. The first three magic numbers can be
reproduced using the harmonic oscillator potential [1].
As neither of these potentials correctly describe the nucleus improvements must
be made. The Woods-Saxon potential is an example of such an improvement and
describes the nucleus using well depth, nuclear radius and skin diffuseness terms [7].
It can be written as
V(r) = −V0
1 +exp[(r−R)/a], (2.3)
where a is the diffuseness term. The flat base of this potential is an appropriate description of the mean field as all nucleons away from the surface should feel a
similar short ranged attraction. The smooth edge describes the decrease in the
at-tractive force acting on nucleons at the surface of the nucleus. As with the harmonic
oscillator, the Woods-Saxon potential can be used to reproduce the first three magic
numbers.
Levels calculated using the Woods-Saxon potential are shown in Figure 2.2 [1].
Only the first three magic numbers are reproduced and so further modifications
must be made to the potential to extend this model to heavier nuclei. The
spin-orbit interaction is such a modification and alters the force acting on a nucleon
depending on the coupling of itsl andsquantum numbers, relieving the degeneracy of spin-orbit partners [1, 8, 9]. The spin-orbit modification can be written as
V(r)⇒V(r) +Vso(r)~l·~s, (2.4)
112 92 58 40 8 2 20 2 8 20 28 50 82 126 184 1s 1p 1d 2s 1f 2p 1g 2d 3s 1h 2f 3p 1i 2g 3d 4s
2 2 4 6 2 8 6 14 2 16 4 20 8 28 4 32 6 38 2 40 10 50 8 58 6 64 4 68 2 70 12 82 10 92 8 100 6 106 4 110 2 112 14 126 10 136 6 142 12 154 8 162 2 164 4 168 16 184
1s1/2 1p3/2 1p1/2 1d5/2 1d3/2 1f7/2 2p3/2 1f5/2 2p1/2 1g9/2 2s1/2 1g7/2 2d5/2 2d3/2 3s1/2 1h11/2 2f7/2 2f5/2 2p3/2 3p1/2 1i13/2 1h9/2 1i11/2 2g7/2 4s1/2 2d3/2 1j15/2 3d5/2 2g9/2
2 2 6 8 10 18 2 20 14 34 6 40 18 58 10 68 2 70 22 92 14 106 6 112 26 138 18 156 10 166 2 168
Intermediate form with spin orbit Intermediate
[image:17.595.112.484.103.459.2]form
Figure 2.2: Levels calculated using the Woods-Saxon potential (left) without the spin-orbit interaction and(right)with the spin orbit interaction [1]. The experimen-tally verified magic numbers are better reproduced with the spin-orbit interaction included.
quantum number and s is the spin quantum number. The effect of including the spin-orbit term on calculated values is shown in Figure 2.2. This modification is
crucial in order to match nuclear models with observed phenomena.
2.2
The drip lines
The nucleus is held together by a total binding energy, which is defined as the
the system
B(A, Z) = ZMP + (A−Z)MN −M(A, Z), (2.5)
whereB is the binding energy, Z and A are the atomic and mass numbers, respec-tively, ZMP and (A−Z)MN are the sums of the individual proton and neutron
masses, respectively and M is the total mass of the nucleus. The differences in the binding energy between one system and another, one nucleon lighter, enable the
separation energy of an individual nucleon to be defined as
SP(A, Z) = B(A, Z)−B(A−1, Z−1),
SN(A, Z) =B(A, Z)−B(A−1, Z),
(2.6)
whereSP andSN are the separation energies for a single proton or neutron,
respec-tively. For nuclei subject to extreme neutron or proton deficiency, the single-particle
separation energies can fall below zero resulting in nuclei that are unbound. This
occurs when (
∂B ∂Z
)
N=const
= 0,
(
∂B ∂N
)
Z=const
= 0,
(2.7)
forSP andSN, respectively, whereN is the neutron number. These limits are called
the drip lines. The nuclides that are the focus of this work lie close to and beyond
the proton drip line.
Beyond the proton drip line no additional energy is required to remove a proton
from the nucleus, however, the presence of the Coulomb and centrifugal barriers
ensure that decay by proton emission is hindered. For this reason it is possible to
2.3
Gamma-ray transitions
The study of excited states in atomic nuclei is crucial for gaining insight into nuclear
behaviour, revealing arrangements of nucleons within the nucleus and the energies
required for such arrangements to occur. The nucleus can be produced in excited
states upon formation in a nuclear reaction or a radioactive decay. Where possible,
γrays are emitted in order to lose both energy and angular momentum. Theseγrays are a valuable probe of the structure of the nucleus as they are a direct consequence
of the de-excitation process.
The emission ofγ rays accounts for differences between the initial and final states that must be conserved, including energy, angular momentum and parity. This gives
rise to selection rules that determine the properties of the emittedγrays. The energy carried by the transition is approximately equal to the difference in the excitation
energies of the initial and final states. A small fraction of this energy is transferred
to the nucleus to conserve momentum as theγ ray is emitted, however, this energy is negligibly small for γ-ray energies < 5 MeV and so, in this work, the energy of the transition is considered to be
Eγ =Ei−Ef, (2.8)
whereEiandEf are the excitation energies of the initial and final states respectively.
Measuring the energy of an emitted γ ray indicates the difference in excitation energy between the initial and final states. The difference in the angular momentum
between the initial and final states must also be conserved such that
~
L=I~i−I~f, (2.9)
I
f
I
i
|L| = 1
|L| = 2
|L| = 3
|L| = 4
I
f
I
f
I
f
|I | = 5/2
i
|I | = 3/2
f
Figure 2.3: A vector diagram corresponding to the selection rule in Equation 2.10, demonstrating the angular momentumL~ that can be carried away from the nucleus by a γ-ray transition when the nucleus de-excites from an initial state to a final state with angular momentumIi = 5/2 and If = 3/2.
angular momentum carried from the nucleus by theγ-ray transition. A consequence of Equation 2.9 is that a range of possible angular momenta are available for the
γ-ray transition to carry away from the nucleus and gives rise to the selection rule
|Ii−If| ≤L≤Ii+If, (2.10)
where Ii and If are the initial and final state angular momentum and L is the
multipolarity of the γ-ray transition. This is demonstrated diagrammatically in Figure 2.3.
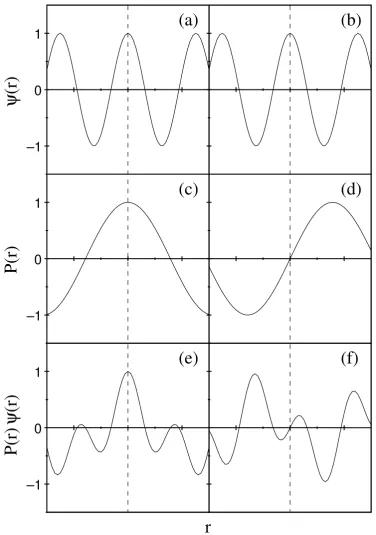
The conservation of parity during the decay from the initial state to the final
states is also accounted for by the γ-ray transition. The parity of a wavefunction can be defined by reflecting its co-ordinates about the origin as indicated by
ψ(x) =
ψ(−x) (even parity, π = 1)
−ψ(−x) (odd parity, π=−1)
r
P
(r
)
ψ
(r
)
ψ
(r
)
P
(r
)
(e)
–1
0
1
(f)
(c)
–1
0
1
(d)
(a)
–1
0
1
[image:21.595.109.486.98.634.2](b)
Figure 2.4: The effect of ∆π =noand ∆π=yestransitions on the parity difference between an initial and final state. (a) and (b) An initial state ψ(r) with even parity. (c)A ∆π =nofunction, P(r). (d) A ∆π =yes function,P(r). (e)A final state following the ∆π =no transition. The parity remains even. (f ) A final state following the ∆π =yes transition. The parity has changed from even, πi, to odd,
L Tel (s) Tmagn (s)
1 6.73A−2/3 E−3
γ ×10−15 2.24 A0 Eγ−3×10⁻¹⁴
2 9.37A−4/3 Eγ−5×10⁻⁹ 3.12 A−2/3 Eγ−5×10⁻⁸ 3 1.98A−2 E−7
γ ×10−2 6.60 A−4/3 Eγ−7×10⁻²
4 6.30A−8/3 E−9
γ ×104 2.10 A−2 Eγ−9×10⁵
5 2.83A−10/3 Eγ−11×1011 9.43 A−8/3 E−11
γ ×1011
Table 2.1: Half-lives based on Weisskopf estimates for electric and magnetic transi-tions for the first five orders of multipolarity [10], whereA is the mass number and
Eγ is the γ-ray energy in MeV.
and can be determined using
π = (−1)l, (2.12)
wherel is the orbital angular momentum quantum number of the state. The parity change incurred by a particular γ-ray multipolarity is given by
∆π(EL) = (−1)L,
∆π(M L) = (−1)L+1,
(2.13)
where
∆π= 1 =no, ∆π =−1 = yes,
labelsE and M denote electric and magnetic transitions, respectively, and Lis the angular momentum carried away by the transition. The effect of ∆π = no(yes) on the parity of the final state is demonstrated in Figure 2.4. Equations 2.10 and 2.13
form the selection rules for allowed γ-ray multipolarites for transitions between an initial stateIπi
i and final state I πf
f .
these estimates are crude, they are considered in this work when constraining the
multipolarities ofγ-ray transitions and assessing the single-particle nature of a tran-sition. Weisskopf estimates are shown in Table 2.1.
2.4
Radioactive
α
decay
The phenomenon of radioactiveαdecay is of great importance to the field of nuclear physics, providing insight into the structure of nuclei from which they are emitted
and identifying nuclei due to their distinct decay energies. The α particle itself is identical to a 4He nucleus and is a strongly bound system as indicated by the
difference between the total mass of the system and the mass of its constituent
nucleons. It can exist unbound within the nucleus, that is, its separation energy
can be such that it does not require any additional energy to escape. This gives rise
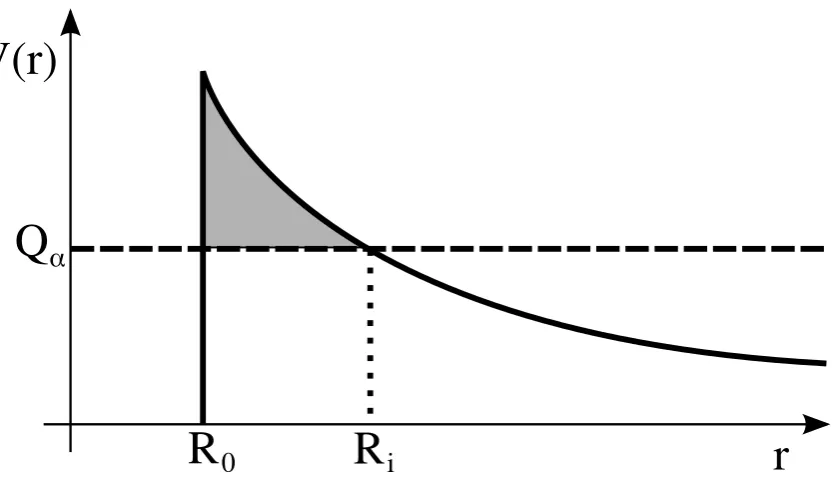
to the currently accepted mechanism by which α decay occurs, which requires that theα particle be contained within the nucleus by a Coulomb barrier through which it must quantum tunnel in order to escape [12], as illustrated in Figure 2.5. This
prevents the decay from occurring immediately, but also provides a means by which
the particle may not only escape but, due to variations in the energy and barrier
conditions, may have a unique half life.
The probability of α-particle emission from a nucleus is:
Pα decay =Ppref orm.Ptunnel (2.14)
where Ppref orm is the probability of the α particle existing within the nucleus and
Ptunnel is the probability of the α particle penetrating the Coulomb barrier. The
tunnelling probability can be calculated using models of the Coulomb barrier and
V(r)
r
R
0
R
i
[image:24.595.96.513.98.339.2]Q
α
Figure 2.5: Schematic plot of an α particle tunnelling through a Coulomb barrier.
R0represents the nuclear radius andRiindicates the distance at which theαparticle
has effectively escaped the nucleus. The shaded region indicates the barrier through which theα particle must quantum tunnel in order to escape the nucleus.
The probability of the α particle forming in the nucleus prior to decay can be used as a probe into the structure of the decaying nucleus. For a given potential
barrier and Q-value, the half-life is dependant on the probability of the α particle forming and so longer half-lives would suggest structural hindrance. The opposite
would be true of decays with shorter half-lives. This can be discussed in terms of
the reduced decay width
δ2 = λexph
Ptunnel
[eV], (2.15)
where λexp is the experimental partial decay constant. As a guide, unhindered
decays have a δ2 of ∼40 keV while for hindered decays it is ∼1 keV [13], although
comparison with neighbouring nuclei would provide more useful values.
As previously stated, the tunnelling probability can be obtained by modelling
be written as
Ptunnel =e−2G, (2.16)
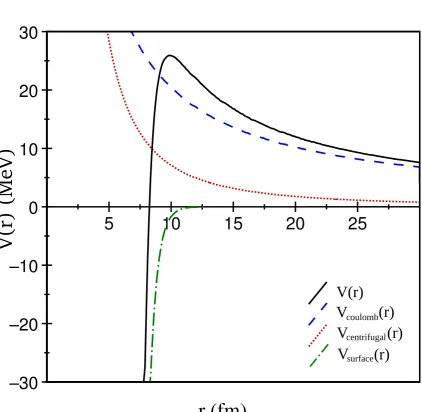
whereGis the Gamow factor, which represents the barrier that must be penetrated before theα particle can escape from the nucleus, as indicated by the shaded region in Figure 2.5. Appropriate theoretical calculations to construct such a barrier,
as-suming a spherical nucleus, are discussed by Rasmussen [14] and have been adopted
here. The Coulomb barrier can be constructed using an electric potential
VCoulomb(r) =
ZDZαe2
4π0r
, (2.17)
whereris the distance from the centre of the nucleus andZDe andZαe indicate the
charge on the daughter nucleus and theα particle respectively.
In addition to the Coulomb barrier,αdecays that carry angular momentum from the nucleus face additional resistance to their emission due to the increase in the
potential barrier. This can be accounted for by adding a centrifugal term
Vcentrif ugal(r) =
¯
h2
2mr2l(l+ 1), (2.18)
to the barrier, where m is the reduced mass of the α particle and l is the angular momentum it carries from the nucleus.
The potential barrier is considered to drop rapidly at the surface of the nucleus
due to the short-range strength of the nucleon-nucleon interaction. An appropriate
modification to the barrier potential [15] to incorporate a smooth transition at the
edge of the nucleus has been adopted,
Vsurf ace(r) = −1100 exp
(
−
[
r−1.17A13
0.574 ])
[M eV], (2.19)
This modification is only valid for distances close to the surface of the nucleus, with
r≥7 fm. The total potential barrier and its constituents are plotted in Figure 2.6. The greater the Q-value of the α particle, the greater the tunnelling probability.
Radioactiveαdecay occurs when theαparticle has successfully tunnelled through the barrier. The mass of the α particle is such that an observable fraction of the Q-value, ∼2.5 % near A = 158, is transferred to the daughter nucleus due to con-servation of momentum. The kinetic energy available to theαparticle after losing a fraction of the Q-value to the daughter nucleus, assuming that the mother nucleus
was at rest, is given by
Tα =
Q
1 + (
Mα
MD
) (2.20)
where Mα and MD are the masses of the α particle and the daughter nucleus
r (fm)
V
(r
)
(Me
V
)
5
10
15
20
25
–30
–20
–10
0
10
20
30
V(r)
V
V
V
(r)
coulomb
centrifugal
surface
[image:27.595.88.511.167.579.2](r)
(r)
Experimental Apparatus and
Methodology
In order to successfully perform γ-ray spectroscopy on neutron-deficient nuclei a number of challenges must be met. The difficulties involved regarding the efficient
detection ofγ rays are somewhat over-shadowed by the challenges introduced when synthesising and isolating nuclei of interest. Only when these challenges have been
met can analytical techniques be applied for the purposes of furthering nuclear
structure research. In this chapter, the experimental apparatus and techniques used
to meet these challenges are described with the purpose of providing the relevant
experimental background for the analysis that follows.
3.1
Heavy-ion fusion evaporation reactions
The study of nuclear structure at the extremes of neutron deficiency requires that
nuclei be synthesised artificially. The production of neutron-deficient nuclei can be
achieved using fusion evaporation reactions in which a beam of accelerated nuclei
result in their fusion into a compound nucleus. As the line of nuclear stability falls
below the Z = N line, with increasing mass, the fusion of two stable nuclei will usually result in the production of a compound nucleus deficient in neutrons. Such
compound nuclei are particularly unstable systems as they are highly excited and
carry a large amounts of angular momentum.
Particle evaporation enables the compound nucleus to lose energy and will
de-excite the system to within a fraction of the proton and neutron separation energies
of the yrast line. Any further particle emission would result in the yrast line being
crossed. The yrast line, shown in Figure 3.1, occurs when the maximum angular
momentum has been achieved for a given excitation energy (hence the use of the
Swedish word “yrast”, whose literal meaning is “dizziest”) and so states cannot exist
below this line. A consequence for fusion evaporation reactions is that once within
a fraction of the proton and neutron separation energies of the yrast line, particle
emission is no longer a valid mode of de-excitation.
At this stage the nucleus is considered to be an evaporation residue. The product
has been synthesised and is highly excited with a large angular momentum. The
reaction exit channels depend very much on the amount of energy and angular
momentum the compound nucleus has upon formation as they define its proximity
to the yrast line, determining the amount of particle evaporation possible. As such,
a single choice of beam and target can produce a variety of reaction channels, some
of which may be populated preferentially with an appropriate choice of beam energy.
The emission ofγ rays enables energy and angular momentum to be transferred away from the nucleus, which enables it to draw closer in energy to the yrast line.
Initially, γ-ray emissions are statistical, that is, the density of states is high and the resulting transitions do not form resolvable peaks. The emission of statistical
transitions brings the evaporation residue close to the yrast line.
Yrast line
Compound nucleus
formation
Particle
evaporation
Statistical
γ rays
Yrast γ rays
E
x
ci
ta
ti
o
n E
n
er
g
y
Angular Momentum
Figure 3.1: Representation of the de-excitation of the compound nucleus in a heavy-ion fusheavy-ion evaporatheavy-ion reactheavy-ion. Particle emissheavy-ion carries energy from the nucleus until the evaporation residue is within the proton and neutron separation energies of the yrast line. Statistical γ rays continue to de-excite the nucleus towards the yrast line. Cascade ofγ-ray transitions between states close to the yrast line further de-excite the nucleus.
energy and angular momentum from the system. Unlike statistical γ rays, these transitions can be resolved due to the rather limited availability of states close to
the yrast line. As the emission of γ rays is a response to the changing structure of the nucleus, yrast cascades provide an opportunity to observe a variety of nuclear
3.2
Challenges for spectroscopy
Fusion evaporation reactions make it possible to synthesise neutron-deficient nuclei
in excited states close to the proton drip line, however, a number of challenges must
be addressed beforeγ-ray spectroscopy can be performed effectively.
The probability of fission following the fusion of beam and target nuclei is
signif-icant in heavy neutron-deficient nuclei. This introduces a large γ-ray background, which obscures γ-ray transitions from the desired reaction channels. Competing reaction channels will also introduce a source of background, as does Coulomb
ex-citation of the target material by the beam, which further obscure the transitions
originating from a particular channel of interest.
While production of nuclei close to the proton drip line can be achieved, the
large background contributions prevent the study of nuclei with the lowest
cross-sections and so the suppression of the γ-ray background is of great importance. These challenges can be met by coupling a γ-ray spectrometer to a recoil separator with a focal plane detection system and utilising selective tagging techniques.
A spectrometer at the target position is required to detect emitted γ-ray transi-tions, however, as previously stated, the background contributions will be very high.
The use of a recoil separator to suppress fission products and unreacted beam makes
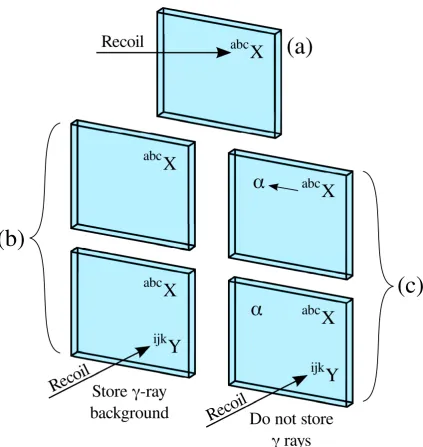
recoil-γ correlations, between spectrometers at the focal plane of the separator and at the target position, possible. Recoil-γ correlations are dependant on temporal relationships and require that data from each detector be stored with an associated
time stamp.
Recoil-γ correlations enable the contributions from fission and Coulomb excita-tion to be suppressed, however, the background that arises from the range of possible
Decay Tagging (RDT) technique [16] is employed, which identifies nuclei by their
characteristic radioactive decays. Decays are correlated spatially and temporally
with the mother nuclei and conditions are placed on the energy and half-life
charac-teristics to complete the identification process. RDT correlations ensure thatγ rays that are not accompanied by appropriate signals are discarded.
3.3
Experimental Apparatus
Efficient high-resolution spectroscopy is of tremendous importance when studying
the structure of the nucleus, however, the large γ-ray background associated with fusion evaporation reactions presents a far more immediate problem. High-resolution
spectroscopy is of limited use if theγ-ray emissions of interest cannot be separated from the background. The experimental apparatus at the Accelerator Laboratory
at the University of Jyv¨askyl¨a can be used in conjunction with selective tagging
techniques in order to suppress this large γ-ray background and obtain relevant nuclear structure information.
The apparatus used at the University of Jyv¨askyl¨a will be described with
refer-ence to the requirements that must be met to enable the techniques performed in
this work.
3.3.1
The Jurogam spectrometer
The hyper-pure germanium (HPGe) detector array Jurogam [17, 18], shown in Figure 3.2, is the primary tool for performingγ-ray spectroscopy in this work. The
Jurogamspectrometer comprises 43 HPGe detectors, with an energy resolution of
∼1.9 keV at 356 keV, focused on a single target position and covering a large solid
angle to optimise efficiency. Detectors are arranged in a “honeycomb” pattern and
Figure 3.2: Schematic diagram of the Jurogam array [19]. Detectors arranged in rings at six different angles from the beam direction are distinguished by colour.
uncovered as possible.
Each detector is equipped with a Compton-suppression shield of bismuth
ger-manate (BGO) [20]. Signals in a detector that are in coincidence with a signal
in the BGO shield are discarded as they correspond to γ rays that have Compton scattered out of the detector and have not deposited their full energy into the Ge
crystal. Heavy-metal collimators shield the front faces of the BGO scintillators in
order to prevent transitions that are completely absorbed in the germanium crystal
from being discarded due to coincidences with separate γ rays entering the BGO shields directly.
The relative energy efficiency of the Jurogam array is shown in Figure 3.3. It is
Energy (keV)
Relative energy efficiency
(c)
0
200
400
600
800
1000
1200
1400
(b)
(a)
Fold
Counts
0
1
2
3
4
5
6
7
8
9
10 11 12 13
10
010
110
210
310
410
510
610
710
810
9Figure 3.4: Recoil gated fold detected by Jurogam during a fusion evaporation reaction in which a 58Ni beam is incident on a 102Pd target with a beam energy of 255 MeV.
event, the fold, forJurogam is shown in Figure 3.4.
3.3.2
The RITU separator (Recoil Ion Transport Unit)
The RITU separator [21] is used to separate fusion evaporation residues (recoils)
from unreacted beam and fission fragments and transport them to a spectrometer
at the focal plane for identification.
RITU, illustrated in Figure 3.5, is operated as a gas-filled separator for the
pur-pose of efficient transmission of recoils to the focal plane while suppressing
trans-mission of unreacted beam and fission fragments. Recoils leaving Jurogam do so at a range of angles from the beam axis, due to particle evaporation and scattering
within the target, forming a narrow conical shape. A quadrupole magnet at the
entrance of RITU focuses these recoils vertically, reducing the width of the cone and
(a)
(b)
(c)
(d)
Figure 3.5: Schematic diagram of the RITU gas-filled separator [19]. Recoils exit
Jurogamand are vertically focused by the quadrupole magnet at(a)matching the
recoil cone to the acceptance of the dipole magnet. (b) The unreacted beam is sup-pressed when deflected by the dipole magnet at and recoils are focused horizontally at(c)and vertically at(d)by quadrupole magnets, for efficient transmission to the focal plane.
magnet.
Suppression of the unreacted beam is achieved by deflecting nuclei in a magnetic
field produced by the dipole magnet. In a vacuum mode separator, the field produced
by a dipole magnet will separate nuclei depending on their mass to charge ratio. Such
a separation technique can be used for the identification of nuclei, but is inefficient,
transporting only a fraction of the available reaction channels to the focal plane.
RITU is a gas-filled separator, normally employing helium gas, and when beam
and recoils are deflected in the magnetic field collisions with the gas cause them to
scatter, removing their mass to charge ratio information. This enables far greater
recoil transmission efficiency than a vacuum separator, at the expense of mass to
charge ratio separation.
rigidity,
Bρ= mv
eq , (3.1)
which determines the deflection of a particle in a magnetic field. A further two
quadrupole magnets are employed to focus the recoils and guide them to the focal
plane detector.
3.3.3
The GREAT spectrometer (Gamma Recoil Electron
Alpha Tagging)
The identification of nuclei following heavy-ion fusion evaporation using the RDT
technique requires a spectrometer capable of detecting both the recoils and their
subsequent radioactive decays. The GREAT spectrometer [22] is a diverse tool for
performing spectroscopy at the focal plane of RITU. It is comprised of a number
of detectors, which make it suitable for the detection of recoils,α decays, electrons, X-rays and γ-ray emissions.
Although different configurations are possible, in this work the GREAT
spec-trometer was comprised of five main detector components: the Multi-wire
propor-tional counter (MWPC); the double-sided silicon strip detectors (DSSDs); the PIN
diode array; the planar germanium detector; and the clover germanium detector.
These components are shown in Figure 3.6.
The MWPC is a gas counter located at the entrance of the GREAT spectrometer.
Recoils transported via RITU will pass through this detector, ionising the isobutane
gas resulting in their detection. One of the primary roles of the MWPC is to
enable distinctions to be made between DSSD events that originated from the target
position and those that originated inside the GREAT spectrometer. It also serves
to suppress scattered beam that reaches the focal plane. This will be described in
Clover Ge detector
Double-sided Si
strip detectors
Si PIN diode
[image:38.595.87.511.96.412.2]array
Planar Ge detector
Figure 3.6: Main constituents of the GREAT spectrometer [22].
The DSSDs are a pair of silicon detectors, each of area 60 mm × 40 mm with
a thickness of 300 µm and an energy resolution of ∼30 keV at 5730 keV, in which recoils become implanted. Charge collection is achieved using contacts arranged in
strips vertically on the front face and horizontally on the back face of the silicon and
the combination of signals in the front and back strips allow for the determination
of the origin of the radiation within the DSSDs. With two detectors consisting of
40×60 strips, the DSSDs have 4800 pixels. This high level of pixelation allows
accurate spatial correlations to be made between multiple DSSD events, enabling
correlations at much higher implantation rates than would otherwise be possible.
The PIN diode array consists of 28 silicon detectors. Although capable of
is detected by the PIN diodes, the majority of the energy is shared between these
detectors. This makes it possible to reconstruct the energy of anα decay, although energy losses between detectors limit the accuracy of such measurements.
The planar germanium detector, positioned behind the DSSDs, is most efficient
for detecting X-rays and low-energy γ rays. Like the DSSDs, signals in the planar detector are read from vertical and horizontal contact strips on the front and back
of the detector. The lowest energy transitions do not penetrate very far into the
germanium and will produce only small amounts of charge. As such, the strips on
the front face of the detector are better suited to detecting X-rays and γ rays of energy Eγ < 100 keV. The energy resolution is ∼2.1 keV from the front face and
∼2.4 keV from the back face of the planar detector at 80 keV.
The clover germanium detector is comprised of four separate HPGe crystals [22]
and is accountable for γ-ray spectroscopy of isomer delayed transitions, capable of detecting transitions in the energy range ∼100-2000 keV. The energy resolution is
∼2.6 keV at 356 keV. The clover detector was positioned directly above the DSSDs
providing a large surface area for the detection ofγ-ray emissions originating from within the GREAT spectrometer.
Unlike the HPGe detectors at the target position, the focal plane clover is not
equipped with a Compton suppression shield. Instead, transitions that have
Comp-ton scattered between the individual crystals can be added together to reconstruct
the original energy of aγ-ray emission, rather than simply discarding the event. Al-though this procedure improves the peak-to-total ratio in the regionE <500 keV, as demonstrated in Figure 3.7, the total intensity of the majority ofγ-ray peaks is not greatly affected. As such, the focal plane clover detector is suitable for coincidence
Energy (keV)
Counts (0.5 keV/ch)
0
200
400
600
800
1000
1200
1400
0
500
1000
1500
2000
2500
With add-back Without add-back
Figure 3.7: Energy spectrum of γ rays detected in the focal plane clover detec-tor. The peak-to-background ratio is significantly improved in the add-back (blue) spectrum forE <500 keV in comparison to the spectrum without add-back (black).
3.3.4
Total Data Read-out (TDR)
Total Data Read-out (TDR) is a triggerless data acquisition system [23] that requires
that events be built up in software [24] rather than following a hardware trigger.
It is common in data acquisition to only collect signals from detectors for a period
of time after a triggering condition has been passed. This incurs a system wide
dead time in which further events may be missed. When the triggering rates are
low or when the desired events are frequent compared to background events this is
an effective method of data acquisition. However, when triggering rates are high
or when the desired events are infrequent in comparison with background such a
system will serve to miss useful data.
The TDR system combats this by reading from all detectors individually with
no requirement of a triggering condition. Each signal is then assigned a time stamp
determined by a system wide clock to a precision of 10 ns. This eliminates common
Events are built in software and correlations can be made with a software trigger.
An inherent advantage of this is that observations may be made prior to a triggering
event with ease, and correlations can be made over relatively long time periods
without missing events that may have occurred during this time. This is a necessity
for the RDT technique, in which it shall be seen that the γ-ray data, which is of interest, precedes the triggering conditions by several milliseconds.
Collecting and storing all data output over the course of an experiment would
incur large amounts of stored data, much of which is of little use or interest. In
order to limit the amount of unwanted data stored a pre-filter is employed decide
which data to store. In this work the pre-filter only stored data that could be
correlated with an event in the DSSDs. As such, when performing offline analysis
all correlations must be made relative to events in the DSSDs.
3.4
Experimental Techniques
The data provided by the apparatus described in the previous section allows for a
range of experimental techniques to be utilised. Such techniques are necessary in
order for data associated with the desired reaction channel to be identified.
3.4.1
The Recoil Decay Tagging (RDT) Technique
The use of heavy-ion fusion evaporation reactions enables the synthesis of
neutron-deficient nuclei, however, an inherent feature of this process is a range of possible
reaction channels, which contribute to a rather largeγ-ray background. The Recoil Decay Tagging (RDT) technique [16] is a means of identifying a specific reaction
channel by requiring that the measured decay properties of an evaporation residue
conform to the characteristic energy and decay time of the nucleus of interest.
Store event
No
Signal in DSSDs
Decay event?
Recoil event?
Previous event
a recoil?
Decay passes
energy gate?
Recoil-decay time
passes time gate?
No
Yes
Recoil identified
Collect associated data
Store event
Yes
Yes
Store event
Yes
Store event
No
Store event
No
Store event
No
Yes
Await signal
in DSSDs
process signals in the DSSDs to distinguish between recoil and decay events, check
whether decay events are preceded by recoil and to determine whether the energy
and decay time properties of the decay match those of the desired nucleus. Once
a decay has passed these conditions, the corresponding recoil is considered to have
been identified and so correlations with signals in other detectors can be made.
In order to distinguish between recoil and decay events each is assigned an
ex-perimental definition. As recoil events are transported to the DSSDs via the RITU
separator, they must pass through the MWPC before becoming implanted in the
DSSDs. While a recoil event would result in an MWPC signal accompanying the
signal in the DSSDs, the same is true of any remnants of the beam that have eluded
the separation process. In order to ensure that unreacted beam is not treated as a
recoil, further distinctions must be made between DSSD signals accompanied by an
MWPC signal. Differences in the charge and velocity of the unreacted beam and
recoils enable these distinctions to be made.
The greater charge carried by recoils causes more ionisation in the MWPC than
scattered beam. Furthermore, the velocity of the unreacted beam is generally greater
than that of recoils and so the time between signals in the MWPC and DSSDs will
differ. The separation of unreacted beam from the DSSD signals is demonstrated
in Figure 3.9. By demanding that events pass a 2-dimensional gating condition,
encompassing the time-of-flight (TOF) between the MWPC and the DSSD and the
deposited energy in the MWPC corresponding to recoil events, scattered beam can
be distinguished from recoils.
Decays are more simply defined as events that are not accompanied by a signal
in the MWPC as they originate from recoils that have already entered the GREAT
spectrometer. Recoil and decay events can been identified a treated separately using
these definitions.
Time of flight TAC
E
n
er
g
y d
epo
si
te
d
Recoil events
Scattered
beam
Figure 3.9: Energy deposited in the MWPC against the flight time between the MWPC and the DSSDs. Scattered beam and recoiling evaporation residues can be distinguished by differences between the amount of energy they deposit and their flight times.
stored for ease of correlation. This is achieved in software using a “tagger”,
Fig-ure 3.10, which is a 3-dimensional array in which two of the dimensions correspond
to DSSD pixel coordinates and the length of the third dimension is based on time.
When an event occurs, it is stored in an element of the tagger that corresponds to
that pixel. This event will be stored until a pre-specified time has passed.
Fur-ther events detected in a pixel will be stored in the tagger in addition to those
already stored and when a decay event is detected previous events from that pixel
are readily available for correlation. As events from different pixels are stored
sep-arately, spatial correlations between events are inherent, and as all events carry a
time stamp, temporal correlations are very simple. The operation of the tagger is
α
α
α
α
α
α
α
r
α
r
Δt
-t
(a)
(b)
(c)
(d)
Figure 3.10: The storing and correlation of events in one DSSD pixel, using the tagger, is represented by this figure. The tagger stores DSSD events for a pre-specified period of time during which correlations between events can be made. (a)
A decay event is detected and stored, as directed by the procedure illustrated in Figure 3.8, by being placed in the tagger. (b) Another decay event is detected. As the previous event was not a recoil, it is only stored. (c) A recoil event is detected and stored. (d) A decay event is detected. As the previous event was a recoil, energy and time gates are applied before storing the event. After the pre-specified storage time runs out, events are discarded.
3.4.2
Gamma-ray correlations
A practical purpose for the RDT technique is the correlation of data associated with
Time of flight TAC
R
ec
o
il
-γ
t
im
e (
μs
)
High density of γ rays
(RITU flight time)
Cyclotron
periodicity
0
0.5
1.0
1.5
Figure 3.11: Recoil-γ time difference against the flight time between the MWPC and the DSSDs. At the average recoil-γ time difference a high density of γ rays collects corresponding to the RITU flight time. The regular dark patches indicate the cyclotron frequency, where there is a higher probability of a reaction resulting in the detection of a greater number ofγ rays.
identified recoil and decay events.
As the periodicity of the cyclotron is significantly lower than the RITU flight
time,∼70 ns and ∼0.5 µs respectively, many fusion evaporation reactions may take place at the target position in the time it takes a recoil to reach the focal plane
thereby introducing a largeγ-ray background.
The correlation of recoil events with γ-ray emissions at the target position can be achieved by taking account of the flight time of a recoil through the RITU
separator and ignoring data that deviate from this flight time. An average flight
time through RITU can be obtained by plotting the time difference between DSSD
recoil events and Jurogam data. Although this will cover a broad range of time differences, over a large number of events a peak will build at the average flight
time due to the increased probability of transitions being observed at that time
267 332 406 537 606 633
Energy (keV)
(c)
0 200 400 600 800 1000 1200 1400 0 1000 2000 3000 4000 5000
(b)
0 5 10 15 20(a)
0 5 10 15 20 25 30 35 254 258 3 58 412 4 35 /8 5 03 5 25 599 6 34 7 16 747 7 78 3 25 3 83 1 47 1 87 2 74 3 36 5 83 4 74 1 20 4 1 28 9 1 21 8 8 69 8 76 8 43 3 88 1003 267 332406 537 606 633Counts (0.5 keV/ch)
Counts x10
(0.5 keV/ch)
5
Counts x10
(0.5 keV/ch)
5
Figure 3.12: Gamma-ray spectra fromJurogam. (a)Pre-filtered spectrum contain-ing all γ-ray data in Jurogam corresponding to any focal plane signal. Emissions from the strongest reaction channels are visible as is the de-excitation of the target material. Labelled peaks belong to the strongest fusion evaporation channel,157Lu.
(b) Recoil gated spectrum. Target de-excitation events have been suppressed. (c)
RDT spectrum using the 158m1Ta α decay as a tag. The strongest channels have
events in software using the triggerless TDR system as sorting data once will enable
an average RITU flight time to be obtained and this can be used in subsequent
sorts to correlate identified recoils in delayed coincidence withγ rays. The effects of correlating identified recoils with γ-ray data is shown in Figure 3.12.
As recoils can be correlated with γ rays detected byJurogam, so too can they be correlated withγ rays detected by the GREAT spectrometer. The requirements for correlations at the focal plane differ to those at the target position as instead of
an average flight time there is only the decay time to consider. As such, focal plane
γ rays are collected if they occur within a specified time of a DSSD event.
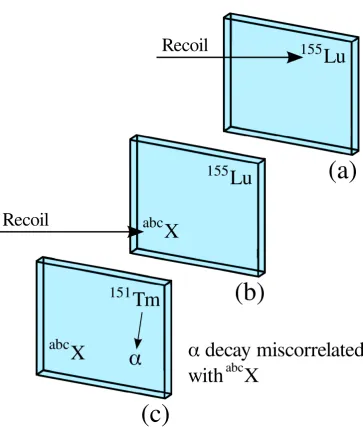
A major limitation to the RDT technique is the decay time of the nucleus.
Significant losses will occur for nuclei with short half-lives, less than ∼0.5 µs, as they will often decay before reaching the focal plane spectrometer, preventing the
identification of the nucleus using its characteristic decay. Identification of nuclei
with longer half lives, ∼100 ms or more, can also be problematic if the recoil rates
at the focal plane are high. The longer the decay time and the higher the recoil
rate, the more likely it is for miscorrelations to occur. This is described in more
detail in Section 3.4.7. Further limitations for the RDT technique are nuclei with
lowα-decay branching ratios.
Where the RDT technique is applicable it is possible to perform γ-ray spec-troscopy despite relatively low production cross sections and largeγ-ray backgrounds incurred in these reactions.
3.4.3
Recapturing escaped
α
decays for tagging
Following the decay of an implanted recoil, it is possible for α particles to escape from the DSSDs having deposited only a fraction of their energy. In such a scenario
the energy deposited would not pass the selection criteria for RDT and the data
DSSD energy (MeV)
2 4 6
DSSD + PIN energy (MeV)
P
IN
e
n
er
g
y (
M
eV
)
0 6 12
8
2 4 8 10
0 6
2 4 8
P
IN
e
n
er
g
y (
M
eV
)
0 0 6
2 4 8
(a)
(b)
Energy (keV)
Counts (0.5 keV/ch)
Counts (0.5 keV/ch)
Counts x10
(0.5 keV/ch)
(c)
0 200 400 600 800 1000 1200 1400
0 200 400 600
(b)
0 2000 4000 6000(a)
0 5 10 15 20 25 5 3 58 267 332406 537 606 633 254 258 412 4 35 /8 5 03 5 25 599 7 16 747 7 78 3 58 254 258 412 4 35 /8 5 03 5 25 599 7 16 747 7 78Figure 3.14: Energy spectra of γ rays in Jurogam. (a)Recoil gated. (b) Tagged using 158m1Ta α decays (6046 keV) in the DSSDs with a 175 ms correlation time.
A number of these α particles will deposit their remaining energy in the PIN diodes, presenting an opportunity to recapture these events. The energy deposited
in the PIN diodes is inversely proportional to the energy deposited in the DSSDs,
as shown in Figure 3.13, although some consideration for energy losses between
detectors must be made and, as such, decays cannot be expected to pass the original
energy conditions by simply adding the DSSD and PIN diode energies together.
While the full energies of the α particles cannot be reliably reconstructed, fea-tures corresponding to specific decays can be distinguished and used as a selective
tag. A comparison of a spectrum of α decays in the DSSD with the reconstructed energies enables these features to be identified, thus escaped α decays can be re-captured.
A 1-dimensional energy condition around the reconstructed energies would
ad-dress the issue of energy loss between detectors, however, such a condition would
also include a number of DSSD events coincident with random PIN diode signals.
This can be addressed by employing a 2-dimensional gate around the reconstructed
energies and the energy deposited in the PIN diodes, cutting off the energy region
in whichα decays deposit their full energy in the DSSDs.
Using recapturedα particles for RDT makes it possible to increase the number of γ-ray correlations. This is demonstrated in Figure 3.14, which shows that this technique can be used to obtain further γ-ray data in addition to data obtained by tagging on full energy peaks in the DSSDs.
3.4.4
Calibrations
The output of all detectors in this work is a voltage proportional to the collected
charge and thus the deposited energy. The spectroscopy of all detected radiation is
reliant on the ability to convert this electrical output into a corresponding energy.
in detector crystals and radiation damage ensure that a signal from a detector has
limited meaning without calibration. The most practical method of obtaining an
accurate voltage to energy conversion is to regularly calibrate detectors using known
sources of radiation as a reference.
The two most common methods of obtaining such a calibration using this
ex-perimental set up are done using either known stationary sources to perform an
external calibration or decays from known reaction products to perform an internal
calibration. In both cases, data from the calibration sources are collected and the
detector outputs are compared with the known energies. Fitting a function to this
comparison, for each detector output, enables conversion from output voltage to
energy to be accomplished in software.
At the Accelerator Laboratory at the University of Jyv¨askyl¨a, a compound
152Eu133Ba source is the most commonly used stationary external source of γ rays
and is suitable for calibration of theJurogamarray and the focal plane germanium detectors. The152Eu nucleiβ-decay to excited states in 152Sm and152Gd [25].
Sub-sequent γ-ray emissions cover an energy range of 122-1408 keV. The 133Ba nuclei
β-decay to excited states in 133Cs [26]. The range of energies is 80-384 keV, nar-rower than the152Eu contribution, however this particular range is a region of large
variation in the energy efficiency of theJurogamand Clover germanium detectors and so additional data points in this region are important. In practice, Jurogam detects γ-ray emissions from moving sources and so requires a Doppler correction, as described in Section 3.4.5, in addition to the external calibration.
The silicon detectors at the focal plane can not be accurately calibrated using
an external source as there are significant decay energy losses in the dead layer
of the detector. Furthermore, the range of calibration energies available from an
external source is very narrow and considerably lower than required for an accurate
![Figure 1.1: The chart of nuclides indicating the mode by which nuclei decay [3].The region above N = 82 close to the proton drip line is enlarged.](https://thumb-us.123doks.com/thumbv2/123dok_us/8065890.226684/10.595.87.507.100.343/figure-chart-nuclides-indicating-nuclei-region-proton-enlarged.webp)
![Figure 2.2: Levels calculated using the Woods-Saxon potential (left)tally verified magic numbers are better reproduced with the spin-orbit interaction without thespin-orbit interaction and (right) with the spin orbit interaction [1]](https://thumb-us.123doks.com/thumbv2/123dok_us/8065890.226684/17.595.112.484.103.459/figure-calculated-potential-veried-reproduced-interaction-interaction-interaction.webp)
![Figure 3.6: Main constituents of the GREAT spectrometer [22].](https://thumb-us.123doks.com/thumbv2/123dok_us/8065890.226684/38.595.87.511.96.412/figure-main-constituents-great-spectrometer.webp)