Students Brief
•RICH HAN, POOR NAN . . . » (DISTRIBUTION OF INCOME)
Karen Hancock
Income in Scotland is far from evenly distributed. In 1977 the poorest 20 per cent of households received less than 1 per cent of total Scottish income while the richest 20 per cent received almost 50 per cent. Income largely determines material welfare (well-being) and in Scotland, as elsewhere, the distribution of income between the rich and the poor is an emotive issue. What is the evidence on income distribution for Scotland? How far can the government affect income distribution? Why does income remain unequally distributed?
Distribution of Income
The poorest 20 per cent (or quintile) of Scottish households received an average income of £2.30 in 1977 (see Table 1). This contrasts sharply with the average of £176 per week received by households in the richest quintile. Only 0.6 per cent of total income was shared among the 20 per cent of poorest Scottish households. The share going to the next group (8.5 per cent) was more than fourteeen times greater while that going to the richest group (46 per cent) was about seventy-five times greater. These comparisons are based on weekly original income per household.
Original income is income from employment, self-employment, investments and private pensions schemes.
Weekly rather than monthly or annual data are used because poorer households, for whom even small changes in income can be of great importance, often find it difficult to obtain credit facilities and are generally concerned about income in the short period.
Households rather than individuals are used as the income-receiving unit. Distributions based on individuals' incomes are not very meaningful since there are large numbers of people who have no income. Most of these are children, who depend on their parents' incomes, and housewives, who depend on their spouses' incomes. The incomes received by individuals are assumed to be shared within households.
that the shares of each group will have changed much since the distribution of original income changes only slowly over time.
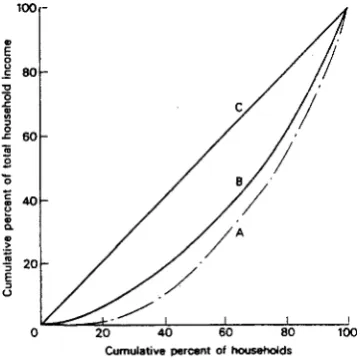
FIGURE 1 LORENZ CURVES FOR SCOTLAND, 1977
100
-20 40 60 80 Cumulative percent of households
Lorenz curves for Scotland, 1977. A: Original weekly income per household. B: Nel weekly income per household
(1) Qttintiles "f households Bottom Second Third Fourth T o p
Original income
(2)
Average income per
Itouschold
(£ P" w«k)
2.30 32.60 72.14 100.11 176.44 (3) Shares of original income (%) 0.6 8.5 18.8 26.1 46.0 100.0 Net <<) Average net income per household (£ per week)
23.90 43.23 59.39 90.67 134.25 income (5) Shares of net income (%> 6.8 12.3 16.9 25.8 38.2 100.0 (6) Implied average tax rates (%)
- 9 3 9 . 1 - 3 2 . 6 17.6 9.4 23.9
Income distribution is frequently illustrated using a Lorenz curve (see Figure 1). The diagonal represents 'complete equality1 with each household
having the same original income. The actual distribution of original income in Scotland is shown by curve A. The shape of the distribution for Scotland is typical of that for many industrialized countries with large numbers of people receiving low incomes and a small number receiving very high incomes. The area between the diagonal and curve A highlights the extent of income inequality and amounts to 0.45 of the area 0CD. This simple numerical measure of inequality is know as the Gini coefficient. The Gini coefficient for original incomes in Scotland is very similar to that for the UK as a whole, although the levels of money income for each quintile are lower.
Causes of Inequality
Differences in earnings from employment are the main source of inequality in original incomes. In general, non-manual workers earn more than manual workers and full-time males earn more than full-time females. Within occupational groups pay tends to vary with the age of the worker. Workers in their early twenties generally earn less than workers aged between 30 and 40. Non-manual male workers in their twenties usually earn less than manual male workers of the same age, but manual worker1 pay increases little after
that age. Peak earnings for non-manual male workers are not reached until the 40-49 age range. Such differences in workers' earnings are determined by the following.
Differences in human capital. Education and training represent investment
in human c a p i t a l or p o t e n t i a l l i f e - t i m e e a r n i n g power. A young doctor undergoing a l e n g t h y period of t r a i n i n g would expect to earn l e s s than a manual worker of the same age. The same i s true for apprentices t r a i n i n g to be s k i l l e d workers such as j o i n e r s , e l e c t r i c i a n s and mechanics. Acquiring s k i l l s , i.e. investing in human c a p i t a l , brings rewards l a t e r in the form of enhanced earnings power.
Differences in employment s t a t u s . Although there i s a well-known tendency for the self-employed to u n d e r s t a t e t h e i r incomes for tax p u r p o s e s , the average recorded income for t h i s group in t h e UK i s about 70% higher than for non-self-employed workers. Part of these higher earnings represents the reward for e n t r e p r e n e u r i a l a b i l i t y and r i s k - t a k i n g , p a r t i s the r e t u r n on t h e i r labour which often embodies considerable human c a p i t a l . The highest-paid self-employed workers are those providing professional services, e.g. a r c h i t e c t s and lawyers.
Changes in market c o n d i t i o n s . Wages for workers with p a r t i c u l a r s k i l l s or for workers in a p a r t i c u l a r region may change r e l a t i v e to the wages of other workers as market conditions change. The r e s u l t i n g dynamic d i f f e r e n t i a l s tend to disappear as the labour market adjusts. After the discovery of o i l in the North Sea, for example, wages rose in t h e n o r t h - e a s t of S c o t l a n d . These higher wages a t t r a c t e d labour from o t h e r p a r t s of Scotland such as S t r a t h c l y d e r e g i o n where t r a d i t i o n a l a c t i v i t i e s such as s h i p b u i l d i n g and steel-making were declining.
Barriers to entry. The numbers of people able to enter c e r t a i n occupations are limited by the educational standards required and/or by the a v a i l a b i l i t y of a p p r e n t i c e s h i p s and p l a c e s on s p e c i a l i s t c o u r s e s . These b a r r i e r s to entry r e s t r i c t the supplies of p a r t i c u l a r s k i l l s and allow those completing t h e i r t r a i n i n g to earn r e l a t i v e l y high wages. Perhaps the best example of b a r r i e r s to entry and t h e i r effects are in the medical profession. The high educational standards needed for admission and the few places available in medical s c h o o l s r e s t r i c t the number of g r a d u a t e s in medicine and help explain the r e l a t i v e l y high earnings of qualified doctors.
Trade union power. Trade unions may be a b l e to r a i s e t h e i r members1
earnings by bargaining on t h e i r members' behalf and by using the t h r e a t of s t r i k e s to exercise i n d u s t r i a l 'muscle1. A union's 'muscle' i s g r e a t e r , the
more highly organised i s the workforce in terms of union membership and the more i m p o r t a n t i s t h e i n d u s t r y in which members are employed. Organised 'key' workers in t h e e l e c t r i c a l power i n d u s t r y have c o n s i d e r a b l e ' m u s c l e ' . In c o n t r a s t , the t h r e a t of a s t r i k e by u n i v e r s i t y t e a c h e r s i s a much l e s s p o t e n t weapon. Although f a i r l y w e l l - o r g a n i s e d and p r o v i d i n g e s s e n t i a l s e r v i c e s , health workers have done badly in terms of pay awards because of t h e i r t r a d i t i o n a l unwillingness to withdraw services from the sick.
Special t a l e n t s or a b i l i t i e s . Some i n d i v i d u a l s have t a l e n t s or a b i l i t i e s which a t t r a c t high rewards. Most notable examples are some pop-stars and p r o f e s s i o n a l f o o t b a l l e r s . Sheena Easton, for example, probably e a r n s far more as a pop-singer than she would earn in the a l t e r n a t i v e occupations to which she i s next-best suited. The difference between her actual earnings and the income she could obtain elsewhere i s her economic rent.
have different earnings because of differences in hours of overtime and in overtime rates of pay.
Unpleasant working conditions. Certain groups, for example miners, have to be rewarded for working in unpleasant, and often dangerous, conditions.
These factors help to explain differences in earnings, but differences in original incomes may also arise from differences in wealth. Income may be obtained from owning a stock of wealth. Wealth can be accumulated in one's own lifetime or it can be obtained through marriage or inheritance. If wealth is defined in terms of marketable assets then the distribution of marketable wealth among the adult population in Britain is much more unequal than the distribution of income. The top 1 per cent of the wealth-owning population own around 25 per cent of total marketable assets, while the bottom 80 per cent own less than 25 per cent. In total the top 10 per cent owns 60 per cent of the wealth.
These factors help explain the relatively high original incomes received by some and the relatively low incomes received by others. But the low pay received by some individuals is not, at least in the short-run, an important source of poverty for households. Less than 20 per cent of all low-paid workers in the UK find themselves in the bottom 25 per cent of households. This is for two reasons. First, most low-paid workers are not the main earners in their households. Secondly, poverty is due more to absence of earnings than to low levels of earnings.
A low-paid worker may be defined as someone who works at least 30 hours per week, while earning less than someone one-tenth of the way up the male manual-worker's earnings distribution. On this definition, about 72 per cent of the low-paid workers in the UK are women. These low-paid women tend to have relatively unskilled jobs and to be concentrated in particular industries. Large numbers of low-paid are to be found in agriculture, clothing and footwear, the distributive trades, public administration, the health service and defence.
There are several explanations for the predominance of women among the low paid:
(1) There is usually a low degree of unionization among women.
(2) Women are often geographically immobile. They cannot move to better-paid jobs in other areas because they are tied to the areas in which their husbands work.
(3) Women find themselves in low-skill occupations partly because they often take time out of the labour force to raise families and partly because of inequality of opportunity.
Robin Hood and Redistribution
Original incomes are low for many households because these households contain few wage-earners. Many of the households in the poorest group are
pensioner households which, unless they benefit from a private pension scheme, have no original income. Even in 1977 £2.30 would have bought little and certainly not enough to sustain even a one-person household. The government, however, intervenes to redistribute income through the tax and transfer system.
A large number of households in the poorest group rely on state transfers such as pensions, unemployment benefits and Family Income Supplement. These transfers meant that in 1977 the typical household in the poorest group has a net income, ie income after taking account of direct redlstributive measures ten times as great as its original income (see Table 1). In contrast, richer households find themselves worse off. Households in the richest group received an average net income £32 lower than their average original income.
Ideally, analysis of the impact of taxes and transfers should include the effects of indirect taxes, eg VAT, and of government expenditure on, for example, health and housing. However, there are conceptual problems in determining the incidence of these items and their effects cannot be considered here. For those taxes and benefits whose effects we considered in Table 1, implied average tax rates have been calculated as:
average original income - average net income
. 100 average o r i g i n a l income
The average tax r a t e s for the bottom two groups are negative because these groups a r e net r e c i p i e n t s of cash b e n e f i t s . Average tax r a t e s r i s e with o r i g i n a l income, r e f l e c t i n g the p r o g r e s s i v e n a t u r e of the tax and b e n e f i t system.
The system of taxes and benefits gave the two poorest groups higher shares in net income than in orginal income. This reduction in inequality s h i f t s the Lorenz curve for Scotland inwards to B on F i g u r e 1 and reduces the Gini c o - e f f i c i e n t to 0.31: However, even a f t e r the government has taken r e d i s t r i b u t i v e measures, considerable inequality remains. For example, the r i c h e s t group s t i l l receives about six times as much income as the poorest group. The question of whether the government ought to r e d i s t r i b u t e further i s largely a p o l i t i c a l i s s u e .
A fundamental issue when considering r e d i s t r i b u t i v e p o l i c i e s i s the t r a d e -off between equity and efficiency. I t may be the case t h a t if incomes were made more equal some i n d i v i d u a l s would wish t o work l e s s , would have l e s s i n c e n t i v e t o save and i n v e s t and would take fewer e n t r e p r e n e u r i a l r i s k s . The t o t a l income t o be r e d i s t r i b u t e d might then be reduced. The r e l a t i v e importance attached to equity as against efficiency d i f f e r s among p o l i t i c a l p a r t i e s and over time.
(1) Not all households have identical needs. If attempts were made to equalize households' net incomes, individuals would still not have indentical living standards. Smaller households require lower incomes to achieve a given living standard.
(2) The relationship between household size, household income and individual living standards is not a simple proportionate one. Larger households can achieve economies of scale in their purchases of, for example, housing. A two-bedroomed flat costs less than two one-bedroomed flats of similar quality. Thus, a two-adult household does not need twice the income of a one-adult household for its members to achieve the standard of living enjoyed by the one-adult household.
(3) Some households receive 'unrecorded' income from the 'black' or •informal' economy. It is not known whether such incomes make households more or less equal.
(4) Households differ in the extent to which they receive 'unrecorded' income through government expenditure. The benefits to households of public expenditures on health and education, for example, are only felt indirectly. Again it is unclear whether their impact is progressive or regressive.
(5) The transfer and income-tax system does not directly affect the distribution of wealth.
Income and Wealth
Rather than the narrow definition in terms of marketable assets, wealth may be defined to cover all assets capable of producing income including human capital, durable consumer goods and state and occupational pension rights. Income derived from human capital and durable goods is difficult to measure but if wealth is defined broadly to include the present values of pension rights the distribution becomes more even. Nevertheless the share of the top 1 per cent is still about 14 per cent of total UK wealth while the share of the bottom 80 per cent is about 45 per cent.
Differences in individuals' abilities to acquire wealth may be related to differences in income. Life-cycle theories suggest that while their incomes may vary over time, individuals wish to maintain a steady flow of consumption expenditures. During their working lives individuals finance consumption expenditure out of current income but some part of their income is saved to finance consumption during retirement. These savings are used to accumulate assets and the individual's stock of assets reaches a peak at retirement age. Thus, individuals nearer retirement age will have greater stocks of wealth. Clearly individuals with higher incomes will be able to save more and acquire greater stocks of wealth.
Much of the distribution of wealth may be related to factors other than income. Inheritance and gifts made by living relatives may account for about 25 per cent of total UK wealth. Generally, wealth is more equally distributed now than at the beginning of the century. In part this is due to a rearrangement of wealth holdings among the wealthier families rather than to a redistribution from wealthy to poor families. Some redistribution has taken place because of the spread of home ownership and the relative
rise in house prices. Those individuals who hold their wealth in company shares have experienced a fall in the real value of their assets during the 1970s and this will also cause a move towards greater equality in wealth distribution.
How to Become Well-Off
There seem to be several important steps to becoming well off. It is important to pick the right job: become a hospital doctor, solicitor or higher executive rather than a farm worker or shop assistant. It helps if your spouse works and if you do not have a large number of children. And when you retire, make sure that you and your spouse have contributed to good occupational pension schemes. To avoid being poor, ensure that at least one adult in your household works full-time, and for preference two. But if you want to be really well-off, it is a matter of choosing your parents or spouse carefully, earning a lot when you are younger so that you can live off investment income later, owning your own business, although that can be risky, or winning the football pools.
UNDERSTANDING
THE SCOTTISH
ECONOMY
E d i t e d by
K INGHAM & J LOVE
Understanding the Scottish Economy is written by members of the Economics Department, which includes the Fraser of Allander Institute for Research on the Scottish economy, at the University of S t r a t h c l y d e . The book presents information in a straightforward and readily understandable form, and employs this information to explain the concepts underlying economic analysis. Across a wide range of topics, the authors demonstrate how theory can be related to the "real world" of Scotland in the 1980»s. Overall, the book provides an excellent basis for an informed appraisal of important aspects of the Scottish economy.
Published by Martin Robertson Price £ 5.95 (paper back) £17.00 (hard back)