The Evaluation of
Education Maintenance
Allowance Pilots: Three
Years Evidence
A Quantitative Evaluation
Sue Middleton, Sue Maguire, Karl Ashworth, Kate Legge,
Tracey Allen and Kim Perrin
Centre for Research in Social Policy (CRSP), Loughborough
University
Erich Battistin, Lorraine Dearden, Carl Emmerson,
Emla Fitzsimons and Costas Meghir
The Institute for Fiscal Studies (IFS)
Research Report No 499
The Evaluation of
Education Maintenance Allowance
Pilots: Three Years Evidence
A Quantitative Evaluation
Sue Middleton, Sue Maguire, Karl Ashworth, Kate Legge, Tracey Allen and Kim Perrin
Centre for Research in Social Policy (CRSP), Loughborough University
Erich Battistin, Lorraine Dearden, Carl Emmerson, Emla Fitzsimons and Costas Meghir
The Institute for Fiscal Studies (IFS)
The views expressed in this report are the author’s and do not necessarily reflect those of the Department for Education and Skills.
© Queen’s Printer and Controller of HMSO 2003. Published with the permission of DfES on behalf of the Controller of Her Majesty's Stationery Office. Applications for reproduction should be made in writing to The Crown Copyright Unit, Her Majesty's Stationery Office, St Clements House, 2-16 Colegate, Norwich NR3 1BQ.
EXECUTIVE SUMMARY i
1 INTRODUCTION 1
1.1 The Education Maintenance Allowance 3
1.2 The Evaluation of EMA 5
1.2.1 Design of the statistical evaluation 5
1.2.2 Questionnaires 6
1.2.3 Sample sizes and response rates 8
1.2.4 Weighting 11
1.2.5 Analytic strategy 14
1.2.6 Measuring Achievement 17
1.2.7 Measuring socio-economic group 20
2 PARTICIPATION AND RETENTION IN POST-16 EDUCATION 24
2.1 Destinations 1999 – 2001: EMA Eligible Young People and the
National Picture 25
2.1.1 Participation in full-time education 26
2.1.2 Participation in employment and training 29
2.1.3 NEET and NET 29
2.2 Impact of EMA on Participation and Retention in Education in
Years 12 and 13 30
2.2.1 Impact of EMA on destinations in Years 12 and 13 31
2.2.2 Impact of EMA on Year 12 and 13 transitions and retention in
education 35
2.2.3 EMA and a national roll-out 39
2.3 Impact of EMA on Participation and Retention in Education in Year
14 41
2.3.1 Impact on Year 14 destinations 42
2.3.2 Impact of EMA on Year 12, 13 and 14 transitions and retention 44
2.3.3 Transitions, retention and gender: Descriptive analysis 46
2.4 EMA Weekly Payments and Retention Bonuses 49
2.4.1 Weekly payments 50
2.4.2 Termly retention bonuses 59
3 PARTICIPATION AND RETENTION, SOCIO-ECONOMIC GROUP AND
YEAR 11 ACHIEVEMENT 70
3.1 EMA and Socio-Economic Group (SEG) 71
3.1.1 Measuring SEG 71
3.1.2 SEG and the impact of EMA in Years 12 and 13 72
3.1.3 SEG and EMA in Years 12, 13 and 14: Descriptive analysis 76
3.2 EMA and Year 11 Achievement 81
3.2.1 Measuring Year 11 achievement 81
3.2.2 Year 11 achievement and the impact of EMA in Years 12 and 13 82 3.2.3 Year 11 achievement and EMA in Years 12, 13 and 14:
4 COURSES CHOSEN IN POST-16 EDUCATION AND ACHIEVEMENT
DURING YEAR 12 91
4.1 Introduction 91
4.1.1 Methodological issues 92
4.2 Year 11 Qualification Achievement 93
4.3 Post-16 Courses 97
4.3.1 Post-16 courses started at Year 12 97
4.3.2 Post-16 courses passed at Year 12 104
5 EMA AND ACHIEVEMENT TWO YEARS AFTER COMPULSORY
EDUCATION 114
5.1 Introduction 114
5.1.1 Measuring achievement 115
5.2 Impact of EMA on Post-16 Achievement by Year 14: Propensity
Score Matching 117
5.2 Achievement and Progression - Descriptive Analysis 127
5.3 Achievement and Education Trajectories – Descriptive Analysis 133
5.3.1 Post-16 Education Trajectories 133
5.3.2 Year 11 High Achievers 135
5.3.3 Year 11 Moderate Achievers 139
5.3.4 Year 11 Low Achievers 145
5.4 Discussion 149
5.5 Achievement Bonuses 151
5.5.1 Qualification for an achievement bonus 152
5.5.2 Receipt of an achievement bonus 155
5.5.3 Reason for non-receipt of an achievement bonus 156
5.6 Conclusion 156
6 ENTRY INTO HIGHER EDUCATION 158
6.1 Introduction 159
6.1.1 Entry into ‘higher education’ 160
6.1.2 Data considerations – descriptive analysis 161
6.2 Impact of EMA on HE entry decisions: Propensity Score Matching 161
6.3 Entry into Higher education– Descriptive Analysis 162
6.3.1 Higher education entry in academic year 2001-2002 163
6.3.2 Deferring entry into higher education 164
6.4 Higher Education Courses and Institutions 167
6.4.1 Courses 167
6.4.2 Choice of higher education institution 169
6.5 Routes into Higher Education 172
6.5.1 Achievement prior to entering higher education 172
6.6 Financial Arrangements for Higher Education 176
6.6.1 Accommodation 177
6.6.2 Student loans 178
6.6.3 Parental contributions 180
6.6.4 Other sources of funds 180
6.6.5 Part-time work 182
6.6.6 Packages of financial support 187
6.6.7 Tuition fees 188
6.7 Conclusion to Descriptive Analysis 191
7.1 Introduction 193
7.1.1 Data and methods 194
7.2 Labour Market Entry in Years 12 and 13 195
7.2.1 Entry into work and training at Year 12 195
7.2.2 Employment stability at Year 13 199
7.2.3 Movements into employment at Year 13 200
7.3 Movements between Education, Employment, Training and NEET
Group between Years 12 and 14 203
7.3.1 Employment stability by Year 14 of young people who had
entered the labour market at Year 12 204
7.2.2 Occupational patterns of Year 12and Year 14 labour market
entrants 206
7.2.3 The NEET group 210
8 EMA AND PART-TIME WORK 213
8.1 Introduction 213
8.2 Regression based approach 214
8.3 Matching 218
BIBLIOGRAPHY 224
ANNEX A i
Table 1.1 Datasets 3 Table 1.2 Equivalence between Academic, Vocational and Occupational
Qualifications 17
Table 1.3 GNVQ To GCSE Equivalent Pass Number Conversions 19
Table 1.4 Value Of Intermediate And Foundation GNVQ Grades 20
Table 1.5 Value Of Advanced GNVQ Grades 20
Table 2.1 Impact of EMA on Year 12 and Year 13 Destinations by Gender 34 Table 2.2 Impact of EMA on Year 12 and Year 13 Destinations by
Location 35 Table 2.3 Impact of EMA on Year 13 Destinations and Retention by
Gender 37 Table 2.4 Impact of EMA on Year 13 Destinations and Retention by
Location 38 Table 2.6 National Impact of EMA on Year 13 Destinations and Retention
by Location 41
Table 2.7 Impact of EMA on Destinations in Year 14 by Gender 43
Table 2.8 Impact of EMA on Year 14 Transitions and Retention by
Gender 45
Table 2.9 Gender 48
Table 2.10 Weekly Payments, Termly Bonuses and Achievement Bonus, by
EMA Variant 49
Table 2.11 Reasons for Stoppages to Weekly Payments in Year 12: Parents’
SEG 59 Table 2.12 Autumn, Spring and Summer Retention Bonuses in Years 12
and 13 by Variant 62
Table 2.13 Receipt of Retention Bonuses in Years 12 and 13: Year 11
Achievement 63 Table 2.14 Autumn, Spring and Summer Receipt of Retention Bonuses in
Years 12 and 13: Parents’ SEG 65
Table 3.1 SEG – Aggregated Classification 72
Table 3.2 Impact of EMA on Participation and Retention in Years 12 and 13. 73
Table 3.3 Impact of EMA on Participation and Retention in Years 12 and
13: Young Men 74
Table 3.4 Impact of EMA on Participation and Retention in Years 12 and
13: Young Women 75
Table 3.5 SEG and Post-16 Destinations: Descriptive Analysis 78
Table 3.6 PSM Classification of Year 11 Achievement 82
Table 3.7 Impact of EMA on Participation and Retention in Years 12 and 13 83
Table 3.8 Impact of EMA on Participation and Retention in Years 12 and
13: Young Men 84
Table 3.9 Impact of EMA on Participation and Retention in Years 12 and
13: Young Women 85
Table 3.10 Destinations at Waves 1,2 and 3: Year 11 Qualification
Achievement 87 Table 4.1 Year 11 Achievement and Parent’s SEG by Cohort: All EMA
Eligible Young People 95
Table 4.2 Participation in Post-16 Full-time Education at Year 12 by Year
Table 4.3 Year 11 Achievement by Cohort: All EMA Eligible Young
People in FT Education at Year 12 97
Table 4.5 Academic and Vocational Post-16 Courses Started at Year 12 by
Cohort 101 Table 4.6 Academic and Vocational Post-16 Courses Started at Year 12 by
Year 11 Attainment: Cohort 2 only 102
Table 4.7 Highest Level Course Started at Year 12 by Year 11
Achievement: Cohort 2 only 104
Table 4.8 Highest Level Course Passed during Year 12 by Cohort 106
Table 4.9 Highest Level Course Passed during Year 12 by Year 11
Achievement: Cohort 2 only 107
Table 4.10 Qualifications Dropped or Failed at Year 12 by Year 11
Achievement: Cohort 2 only 109
Table 4.11 Level 3 Course Type started at Year 12 by Year 11 Achievement
and Cohort: Moderate and high achievers only 112
Table 5.1 The Impact of the EMA on Educational Achievement at Level 3
by the End of Year 13 119
Table 5.2 The Impact of the EMA on Educational Achievement at Levels 1
and 2 by the End of Year 13 121
Table 5.3 The Impact of EMA on Educational Achievement at Level 3 by
the End of Year 13 for Young Men, by Year 11 GCSE groups 123 Table 5.4 The Impact of EMA on Educational Achievement at Level 3 by
the End of Year 13 for Young Women, by Year 11 GCSE
groups 123 Table 5.5 The Impact of EMA on Educational Achievement at Levels 1
and 2 by the End of Year 13 for Young Men, by Year 11 GCSE
groups 124 Table 5.6 The Impact of EMA on Educational Achievement at Levels 1
and 2 by the End of Year 13 for Young Women, by Year 11
GCSE groups 124
Table 5.7 The Impact of EMA on Educational Achievement at Level 3 by
the End of year 13 for Young Men, by SEG groups 125
Table 5.8 The Impact of EMA on Educational Achievement at Level 3 by
the End of Year 13 for Young Women, by SEG groups 126
Table 5.9 The Impact of EMA on Educational Achievement at Levels 1
and 2 by the End of Year 13 for Young Men by SEG groups 126
Table 5.10 The Impact of EMA on Educational Achievement at Levels 1
and 2 by the End of Year 13 for Young Women, by SEG Group 127 Table 5.11 Maximum Level of Achievement during Years 12 and 13 among
Young People who had Spent at Least One Year in Post-16
Education 129 Table 5.12 Progression among Year 11 Low Achievers who became
Moderate Achievers Post-16 by the start of Year 14 131
Table 5.13 Progression among Year 11 Moderate Achievers who Remained
Moderate Achievers Post-16 by the start of Year 14 132
Table 5.14 Education Trajectories between Years 12 and 14 134
Table 5.15 Education Trajectories among Year 11 High Achievers between
Years 12 and 14 136
Table 5.16 Trajectories of Year 11 High Achievers by Post-16 Qualification
Table 5.17 Grade Point Achievement of Year 11 High Achievers at Year 11
and by the end of Year 13 139
Table 5.18 Education Trajectories among Year 11 Moderate Achievers
between Years 12 and 14 140
Table 5.19 Trajectories of Year 11 Moderate Achievers by Post-16
Qualification Outcomes 142
Table 5.20 Grade Point Achievement of Year 11 Moderate Achievers who
had Obtained a Level 3 Qualification by the Start of Year 14 143 Table 5.21 Grade Point Achievement of Year 11 Moderate Achievers who
had Obtained a Level 2 Qualification by the Start of Year 14 144 Table 5.22 Education Trajectories among Year 11 Low Achievers between
Years 12 and 14 146
Table 5.23 Trajectories of Year 11 Low Achievers by Post-16 Qualification
Outcomes 147 Table 5.24 Grade Point Achievement of Year 11 Low Achievers who had
Obtained a Level 2 Qualification by the start of Year 14 148
Table 6.1 Impact of EMA on University Participation 162
Table 6.2 Young people with a Higher Education Place: Ethnicity 164
Table 6.3 Young people with a Higher Education Place: Socio-Economic
Group 164
Table 6.4 Taking a ‘Gap Year’ and University Intentions 166
Table 6.5 Main Intended Activity of Young People Deferring Entry to
Higher Education 167
Table 6.6 Type of Higher Education Provider Entered/Will Enter 01-02 169
Table 6.7 Major Reasons for First Choice of HE Provider 170
Table 6.8 Route into Higher Education 172
Table 6.9 Year 11 Achievement for Young People Entering HE 173
Table 6.10 Number of A and AS Level Passes among Young People
Entering HE 174
Table 6.11 Type of Higher Education Institution: Year 13 Achievement and
EMA Eligibility/Receipt 176
Table 6.12 Type of Accommodation in Higher Education 177
Table 6.13 Other Sources of Funding for Higher Education 181
Table 6.14 Working or Intending to Work Part-Time while in Higher
Education 183 Table 6.15 Average Hours, Weekly and Hourly Pay from Part-Time Work
in Higher Education 186
Table 6.16 Main Reasons for Working Part-Time whilst in Higher
Education 187
Table 6.17 Packages of Financial Support in Higher Education 188
Table 6.18 Packages of Support for Tuition Fees 191
Table 7.1 Occupational Classifications of Year 12 Labour Market
Entrants 197 Table 7.2 Seasonal/Temporary, Casual & Permanent Employment at
Year 12 198
Table 7.3 Employment Stability at Year 13 199
Table 7.4 Year 13 Labour Market Entrants among Young People in
FTE/NEET Group at Year 12 202
Table 7.5 Entrants from Full-time Education into the Labour Market at
Year 14 203
Table 7.7 Year 14 Destinations of Young People who had changed their
Status since Entering Employment/Training at Year 12 205
Table 7.8 Occupational Breakdown of Year 12 and Year 14 Labour
Market Entrants 208
Table 7.9 NEET Population at Year 14 211
Table 7.10 Year 14 Destinations of Young People who were in the NEET
Group at Year 12 212
Table 8.1 Probit Estimates with Dependent Variable = 1 if Young Person
is in Part-Time Work whilst in Full-Time Post-16 Education 215
Table 8.2 Tobit Estimates with Dependent Variable Hours of Work 217
Table 8.3 Participation in Part Time Work, Matched Sample, Year 12 219 Table 8.4 Participation in Part-Time Work, Matched Sample, Year 13 220
Table 8.5 Hours of Part-Time Work, Matched Sample, Year 12 220
Table 8.6 Hours of Part-Time Work, Matched Sample, Year 13 221
Table 8.7 Participation in Part-Time Work at the Start of Year 14,
Matched Sample 223
Table 8.8 Hours of Part-Time Work at the Start of Year 14, Matched
Sample 223 Table AB.1 EMA Receipt and Eligibility among Young People Entering HE ii Table AB.2 EMA Receipt and Socio-economic Group of Young People
Figure 2.1 Destinations of Young People in the EMA Eligible Population 27 Figure 2.2 Participation in Education, Training and Employment by 16-18
Year Olds in England: 1999, 2000 and 2001 28
Figure 2.1 Stoppage Patterns during Year 12: All, Urban and Rural Pilot
Areas 51
Figure 2.2 Stoppage Patterns during Year 12: Variant 52
Figure 2.3 Stoppage Patterns during Year 12: SEG 53
Figure 2.4 Reasons for Stoppages to Weekly Payments during Year 12: All,
Urban and Rural Pilot Areas 54
Figure 2.5 Reasons for Stoppages to Weekly Payments during Year 12:
Urban Variants 55
Figure 2.6 Reasons for Stoppages to Weekly Payments during Year 12:
Partial or Full EMA Award 56
Figure 2.7 Reasons for Stoppages to Weekly Payments in Year 12: Gender 57 Figure 2.8 Reasons for Stoppages to Weekly Payments in Year 12: Year 11
Achievement 58 Figure 2.9 Receipt of Retention Bonuses in Years 12 and 13: All, Rural and
Urban Pilot Areas 60
Figure 2.10 Autumn, Spring and Summer Retention Bonuses: All, Urban
and Rural Pilot Areas 61
Figure 2.11 Autumn, Summer and Spring Retention Bonuses in Years 12
and 13: Year 11 Achievement 64
Figure 2.12 Reasons for Non-Receipt of Retention Bonuses 66
Figure 2.13 Reasons for Non-Receipt of Retention Bonuses: Urban Variant 67
Figure 5.1 Qualification for an Achievement Bonus: Urban Variant 152
Figure 5.2 Qualification for an Achievement Bonus by Year 11
Achievement 153
Figure 5.2 Qualification for an Achievement Bonus by Parents’ SEG 154
Figure 5.3 Receipt of an Achievement Bonus by Urban Variant 155
Figure 5.4 Reasons for Non-Receipt of an Achievement Bonus 156
Figure 6.1 Type of Course in Higher Education 168
Figure 6.2 Financial and Other Reasons for First Choice of HE Institution 171 Figure 6.3 Grade Points Achieved from Level Three Qualifications (A
levels, AS level and GNVQs) 175
Figure 6.4 Living with Parents while in Higher Education 178
Figure 6.5 Take-up of Student Loans 179
Figure 6.6 Parents Support with Living Costs 180
Figure 6.7 Hours Spent in Part-Time Work while in Higher Education 184
Figure 6.8 Earnings per week from Part-Time Work while in Higher
Education 185
Figure 6.9 State Support with Tuition Fees 190
EXECUTIVE SUMMARY
Chapter 1 Introduction
This is the third report of the longitudinal quantitative evaluation of Education Maintenance Allowance (EMA) pilots and the first since the government announced that EMA is to be rolled out nationally from 2004. The evaluation was commissioned by the Department for Education and Skills (DfES) from a consortium of research organisations, led by the Centre for Research in Social Policy (CRSP) and including the National Centre for Social Research, the Institute for Fiscal Studies (IFS) and the National Institute for Careers Education and Counselling (NICEC).
The statistical evaluation design is a longitudinal cohort study involving large random sample surveys of young people (and their parents) in 10 EMA pilot areas and eleven control areas. Two cohorts of young people were selected from Child Benefit records. The first cohort of young people left compulsory schooling in the summer of 1999 and they, and their parents, were interviewed between October 1999 and April 2000 (Year 12 interview). A second interview was carried out with these young people between October 2000 and April 2001 (Year 13 interview). The second cohort left compulsory education the following summer of 2000 and young people, and their parents, were first interviewed between October 2000 and April 2001. (Chapter 1.2.1)
Response rates to all surveys have been high (Chapter 1.2.3). Weights have been
constructed to correct for potential sources of bias arising from exclusions from the sample, differential response rates and attrition. Population weights have also been produced for England as a whole. (Chapter 1.2.4). The report uses both propensity score matching (PSM) and descriptive techniques, each of which brings their own particular strengths to the analysis (Chapter 1.2.5). Methods of measuring qualification achievement have been devised which take into account qualifications at Year 11, and progress since then in terms of advancement
between educational levels and within the same level (Chapter 1.2.6). The method used to construct socio-economic groups within the data is also described (Chapter 1.2.7).
The findings are based on analysis of five datasets produced from five interviews with young people (and their parents in the first wave of interviews). These are shown in Box S1, which also shows the academic year in which young people were at the time of each interview and the year in which interviews were undertaken. Throughout the report academic year
Box S1
Dataset: Interview at
the Start of Academic Year:
Interviewing begun in:
Approximate age of Young People: Approximate Time since Completing Compulsory Education:
Cohort 1 Wave 1 12 1999 16 – 17 years 3 months Cohort 1 Wave 2 13 2000 17 - 18 years 15 months Cohort 1 Wave 3 14 2001 18 – 19 years 27 months Cohort 2 Wave 1 12 2000 16 – 17 years 3 months Cohort 2 Wave 2 13 2001 17 – 18 years 15 months
Chapter 2 Participation and Retention in Post-16 Education
The chapter begins by comparing the destinations of EMA eligible young people with national destinations statistics (Chapter 2.1). The remainder of the chapter reports on the transitions made by young people at Years 12, 13 and 14 using both the propensity score matching (PSM) approach to provide robust estimates of the impact of EMA (Chapter 2.2)
and descriptive techniques to enable a more detailed analysis of the data (Chapter 2.3). Finally, the possible role of sanctions in the EMA system in encouraging participation and retention is considered.
A descriptive comparison of the destinations of the EMA eligible population with the
destinations of 16-18 year olds in England as a whole showed that there was a slightly higher percentage of all 16 year olds remaining in education in 1999 in comparison to the EMA eligible sample at Year 12. The proportion in post-16 education among the EMA eligible population was slightly higher at Years 13 and 14 (Chapter 2.1.1).
PSM techniques estimate that the overall impact of EMA for men and women, combining Cohorts 1 and 2, has been to increase Year 12 participation in full-time education by 4.3 percentage points, and Year 13 participation by 6.2 percentage points. For young men, the impact of EMA on full-time education participation increased from 4.6 percentage points in Year 12 to 8.2 percentage points in Year 13, suggesting that EMA has had a positive effect on education retention for young men. For young women EMA increased full-time education participation in both years by just over 4 percentage points and does not appear to have had a significant impact on retention (Chapters 2.2.1 and 2.2.2).
When EMA is rolled-out nationally, the effects of EMA will probably be enhanced. EMA should increase the proportion staying in education in Year 12 and 13 by around 8.3 percentage points for men and 5.7 percentage points for women and increase retention in education by 4.9 percentage points for men (but only marginally for women). This increase in continuous education participation should mostly be drawn from the group who otherwise would have not participated in any education in Year 12 or 13 (Chapter 2.2.3).
to young people with special educational needs or to young people in some pilot areas who came from vulnerable groups) (Chapter 2.3.1).
Descriptive analysis showed that approximately 80 per cent of young people reported continuous receipt of EMA weekly payments, whilst 20 per cent reported stoppages to their weekly payments. Variant 2, which pays the highest EMA weekly allowance, accounted for the highest proportion of reported stoppages across all pilot areas (27.6 per cent). In contrast, Variant 3 where EMA is paid to the parent(s) accounted for the lowest proportion of
stoppages overall (14.4 per cent). Recipients from the highest socio-economic group reported stoppages to payments more frequently than other groups (Chapter 2.4.1).
Across all pilot areas, attendance problems emerged as the most common reason for
stoppages to the weekly payment (42.8 per cent). However, administrative problems such as processing errors and payment delays also accounted for a substantial proportion of stoppages (25.9 per cent). Across urban variants, attendance problems were most commonly reported in Variant 2 areas (45.5 per cent) where the highest weekly allowance was available. This could suggest that the higher weekly payment available here, did not encourage better attendance. However, is also possible that attendance had been monitored more stringently in Variant 2
because of the relatively higher weekly allowance. Young people from professional and managerial backgrounds were more likely than other groups to attribute stoppages to attendance problems.
Overall, similar proportions of young people reported receipt of termly retention bonuses in the period leading up to the Year 13 interview (89.7 per cent) compared to the period between Year 12 and 13 (90.8 per cent). The largest proportions of young people who reported receiving bonuses were located in Variant 3 where a £50 retention bonus was
available and in Variant 4 where an £80 bonus was available. This suggests that both models provide more effective short- and medium-term incentives than those in operation in Variant 1 and Variant 2. (Chapter 2.4.2).
Young people with more than five A*-C GCSE grades at Year 11, were most likely to have received retention bonuses. Furthermore, those with the highest level of Year 11
achievement and those from the highest socio-economic group sustained high levels of bonus receipt throughout the academic year, whilst bonus receipt fell dramatically for other groups.
The main reason given for non-receipt of retention bonuses was poor attendance, which was also central to explanations of stoppages to the weekly allowance. Attendance problems were especially apparent in urban Variant 2 at Year 13 (54.1 per cent) and Year 14 (50.7 per cent). At Year 13, attendance problems were least prevalent in Variant 4. A small proportion of young people across each urban variant reported that they were still waiting for retention bonuses to arrive, indicating possible administrative problems. There were marked
Chapter 3 Participation and Retention, Socio-Economic Group and Year 11 Achievement
Chapter 3 explores the impact of EMA on participation and retention in post-16 education in greater detail, focusing on the relationship first between participation and socio-economic group (Chapter 3.1)and, secondly, between participation and Year 11 achievement
(Chapter 3.2). Both PSM and descriptive techniques are used, the former in order to provide robust estimates of the impact of EMA, the latter to describe the data in greater detail.
The impact of EMA on young people from the Professional/Managerial socio-economic group (Group 1) was almost non-existent. All of the impact was concentrated among the children of other non-manual workers (Group 2), skilled manual workers (Group 3), semi-skilled and unsemi-skilled workers (Group 4), and those not in work (Group 5). For Groups 2 and 3, EMA increased the proportion in education in both Years 12 and 13 by 6.4 percentage points and the corresponding figure was even larger for Groups 4 and 5 at 9.1 percentage points. For both these groups, EMA has impacted positively and significantly on retention, which means that the impact of EMA on education participation increased between Years 12 and 13. (Chapter 3.1.2).
Descriptive analysis that allowed disaggregation of the five socio-economic groups showed the same pattern as the PSM analysis. EMA eligible young people from SEG 5 living in the pilot areas were much more likely than those in the control areas to have been in full-time education at the start of Year 12 and this difference remained at the start of Year 13 but at a lower level. Young people in SEG 5 appear to have been drawn into education who would otherwise have become NEET or entered work without training. However, extension of the analysis to the start of Year 14, when most young people would have completed their
entitlement to EMA, showed that there was little difference in educational participation rates among young people in SEG 5 between pilot and control groups, while the proportion entering the NEET group had begun to grow. (Chapter 3.1.3).
EMA had its largest impact on the participation and retention decisions of low and middle achievers, defined by Year 11 GCSE performance. For those falling into the lowest achieving group, EMA increased the proportion staying in full-time education in Years 12 and 13 by 8.8 percentage points (from 26.9 per cent to 35.7 per cent). It also significantly widened the education participation gap between Years 12 and 13, increasing retention by 7.6 percentage points for this group. The effect was even large for middle achievers, increasing the proportion staying on in Years 12 and 13 by 10.9 percentage points. Again for this group EMAs also positively impacted on retention increasing it by 10 percentage points to 78.1 per cent. The impact for the highest GCSE achievers was essentially zero (Chapter 3.2.2).
Chapter 4 Courses Chosen in Post-16 Education and Achievement During Year 12
Amongst all eligible young people in the second EMA cohort, those in the pilot areas were slightly less well qualified at the end of Year 11 than their counterparts in the control areas. In addition, the availability of EMA appeared to promote participation in post-16 education amongst Year 11 low and moderate achievers (who attained less than five A*-C
GCSE/GNVQs) but not amongst high achievers (who had passed five or more A*-C GCSE/GNVQs). Consequently, amongst young people who remained in education beyond compulsory schooling, those in the pilot areas tended to have substantially lower levels of Year 11 attainment than their counterparts in the control group (Chapter 4.2.1).
The remainder of Chapter 4 focuses on EMA eligible young people who remained in post-16 full-time education. In the second cohort, students in the pilot group were more likely to have started a solely vocational course, and less likely to have embarked upon a solely academic course, than their higher achieving counterparts in the control group (Chapter 4.2.2). However, there was some suggestion that this pilot-control distinction remained when achievement was controlled for. At each level of Year 11 achievement, students in the pilot group were marginally more likely to have embarked upon a solely vocational course than those in the control group.
When Year 11 qualifications were held constant, there was no significant difference in the highest level of course started by eligible young people in the pilot and control groups in the second cohort. At Year 12, over nine-tenths of Year 11 high achievers began a Level 3 course (Chapter 4.2.2). However, by Year 13, high achievers in the pilot group were less likely to have passed a Level 3 course than their counterparts in the control group (Chapter 4.2.3). Amongst Year 11 high achievers, 67.4 per cent of those in the pilot group had
successfully completed a Level 3 course at the time of their Year 13 interview compared with 73.9 per cent of those in the control group.
Pilot/control differences in successful course completion at Year 13 do not reflect a higher incidence of dropped or failed qualifications within the pilot group. Indeed, moderate achievers in the pilot group (who had attained between one and four A*-C GCSE/GNVQs) were more likely to have continued with (or passed) all the qualifications they began at Year 12 than those in the control group (67.4 per cent and 57 per cent respectively)(Chapter 4.2.3).
For the second cohort, amongst both moderate and high achievers, eligible students in the pilot group were more likely to have embarked upon a solely vocational Level 3 course (i.e. a Level 3 NVQ or an Advanced GNVQ) than those in the control group (Chapter 4.2.3). Amongst high achievers, eight per cent of eligible students in the pilot group began a solely vocational Level 3 course compared with 4.8 per cent of those in the control group. Amongst moderate achievers, these figures were 12.7 per cent and seven per cent respectively.
Choice of course impacts upon the likelihood of successfully completing a Level 3
qualification at Year 12. Unlike AS Levels, it is rare for vocational Level 3 courses to result in a qualification within the first year of study. Higher rates of solely vocational Level 3 courses amongst high achievers in the pilot group contributed towards their lower likelihood of having passed a Level 3 course. However, these behaviours, in turn, require explanation.
moderate achievers in post-16 education within the pilot group. These students had an increased likelihood of subsequently embarking upon a vocational course. This may, in turn, have raised the profile or popularity of vocational courses, thereby attracting students who might have otherwise have followed an academic path through post-16 education.
It is important to reiterate that, controlling for existing attainment, eligible students in the pilot group were not starting courses that were at a lower level than their counterparts in the control group; therefore, there is no suggestion that they were ‘lowering their sights’. However, where students embarked upon a vocational Level 3 course, rather than an AS Level, they were unlikely to attain a Level 3 qualification at Year 12. As EMA is normally only available for a maximum of two years, any deferment of attainment may conceivably result in fewer eligible students gaining a Level 3 qualification before their award expires. This possibility can be explored when Year 14 data become available.
Chapter 5 EMA and Achievement Two Years after Compulsory Education
This chapter asks whether or not EMA has had an impact on the achievement of young people who entered post-16 full-time education over Years 12, 13 and 14 of the survey, that is, during the first two years following compulsory education.
The first part of the chapter uses PSM techniques to examine the impact of EMA on
achievement among all EMA eligible young people by the beginning of Year 14, whether or not they had actually engaged in any post-16 education1. Data are from the third interviews with the first cohort of young people eligible for EMA. The second part of the chapter uses descriptive analysis to explore patterns of achievement in greater detail. Finally, young people’s receipt of EMA achievement bonuses are explored (Chapter 5.1)
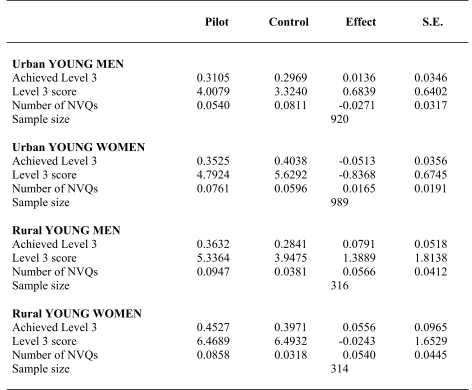
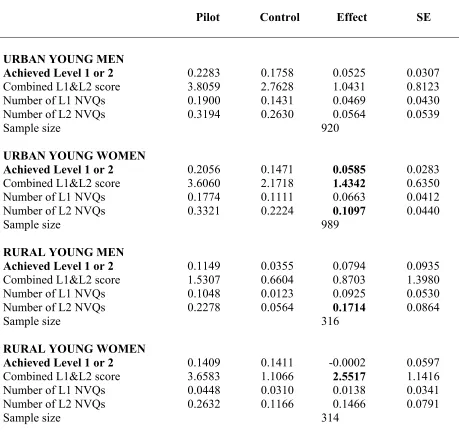
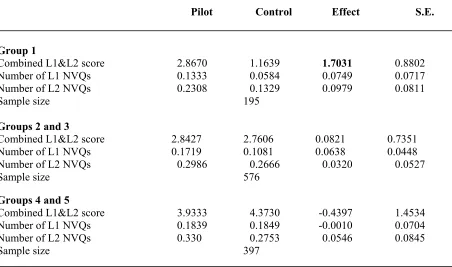
PSM techniques measured achievement by capturing progress between Levels 1, 2 and 3 and, secondly, by analysing the number and level of passes achieved within these levels. EMA appears to have had almost no effect on a range of achievement outcomes at Level 3.
However, there was some evidence of an EMA effect on Level 2 qualifications. This was the case for young women in both urban and rural areas, and was significant for both the number of Level 2 NVQ passes and the combined Levels 1 and 2 scores.2 There was similar evidence for young men in rural areas, although for this group the results were significant only for the number of Level 2 NVQ passes.
This pattern was confirmed when the sample was split by SEG groups; there was evidence of a positive EMA effect only on the Level 3 scores of young people in the highest SEG (Group 1). The significant results found at Level 2 among all eligible young people were not found once SEG was taken into account.
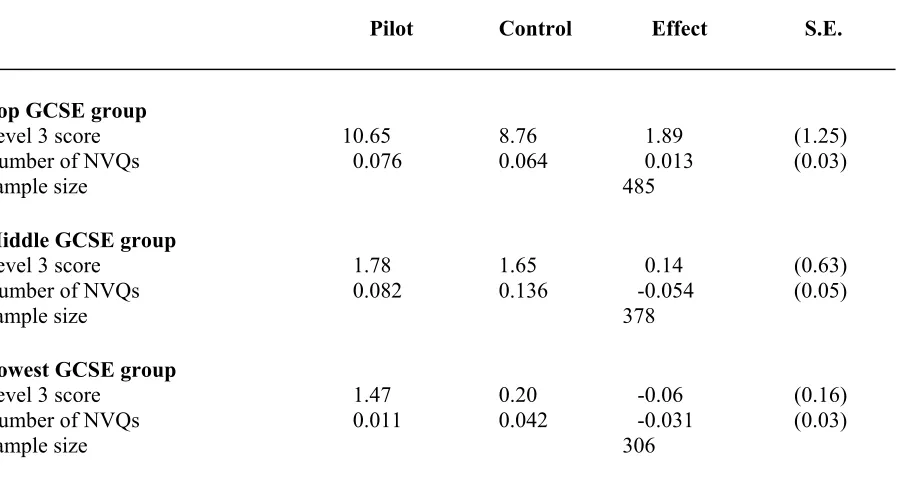
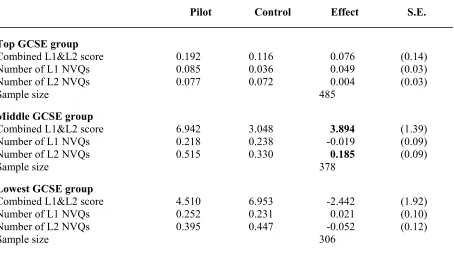
There were also few significant results from the analysis of the impact of EMA on
achievement according to Year 11 GCSE results. The effect of EMA on the Level 3 grade point score, seemed to be highest for middle-achievers at Year 11. For achievement at Levels 1 and 2, the effect of EMA on the equivalised grade point score was highest for individuals in the lowest GCSE group. However, it should be noted that sample sizes in some of these
1 This excludes, therefore, qualifications gained through work-based education and training for which data
were not available. These qualifications will be included in analysis for next year’s report.
2 Note that if an individual has qualifications from both Levels 1/ 2 and Level 3, it is not possible to combine
analyses were relatively small. Further analysis when achievement data are available for young people in Cohort 2 are available will allow any EMA impact to be more precisely identified.
Analysis of the impact of EMA on Year 13 achievement by SEG produced an interesting contrast with the findings in Chapter 3, which suggested that EMA had the largest impact on young people in the middle and lower SEG groups. For achievement by the end of Year 13 at Levels 1 and 2 and at Level 3, it was only among those from the highest SEG that a significant effect was found. (Chapter 5.2).
Descriptive analysis focused, first, on achievement and the extent of progression by young people who spent at least one year in post-compulsory education, both within and between groups of young people defined by levels of achievement at the end of Year 11. The second approach identified a series of education trajectories, defined by the pattern of participation in post-16 full-time education described by young people in their interviews at the start of Years 12, 13 and 14.
Achievement in post-16 education was examined for young people who had spent at least one year in post-16 full-time education. Post-16 achievement was measured in a number of ways including the highest level attained, the number of passes at different levels and grade point scores reflecting the quality of passes. The focus was on progression between levels and progression within levels. Young people were classified into one of four groups according to their Year 11 achievement in terms of the number of GCSE/GNVQ passes: none, low
achievers (D-G passes only), moderate achievers (1-4 A*-C passes), high achievers (5+ A*-C passes) (Chapter 5.3)
The vast majority (78 per cent) of Year 11 high achievers obtained a post-16 Level 3 qualification (1+ A, AS level, Advanced GNVQ or Level 3 NVQ). However, there was no evidence that EMA had effected achievement because there was no difference between the pilot and control groups in the proportions attaining a Level 3 qualification. Around three in 10 moderate achievers had obtained a Level 3 qualification, another 40 per cent obtained only A*-C GCSEs and around 36 per cent achieved nothing or D-G passes only. Few low
achievers obtained a Level 3 qualification (3.8 per cent in the pilot areas and 7.8 per cent in control areas). Overall there were no significant differences between pilot and control groups; thus, no evidence of an EMA effect. (Chapter 5.3.1)
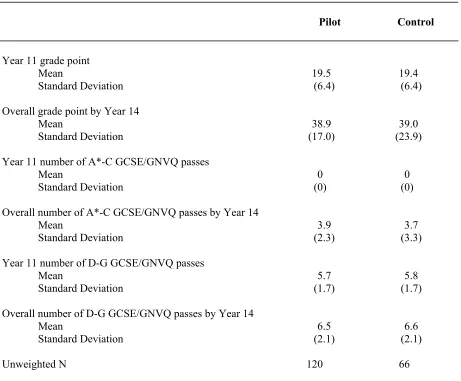
Young people who remained at the same level of achievement after a period spent in post-16 education as they had started from in terms of their Year 11 achievement tended to double their grade points on average. Among low achievers who had obtained one A*-C post-16 qualification the grade point average doubled from about 19.5 to 39, and the average number of exams gained was about four GCSEs. Among moderate achievers who obtained at best only A*-C passes, their grade point averaged almost doubled (from 27.3 to 48.5 in the pilot areas and from 28.3 to 44.9 in the control areas), an increase of about 4.5 GCSE exams. There were no significant differences in achievement between pilot and control groups. (Chapter 5.3.2)
otherwise have entered a third year of post-16 education or have left post-16 education after two years. Among this group who would otherwise have left education, it appeared that those who had obtained better Level 3 results were those who were encouraged into Higher Education. (Chapter 5.4.2)
There was a suggestion of a slight EMA effect on entry to Higher Education among Year 11 moderate achievers who obtained a Level 3 qualification (8.4 per cent in the pilot group compared to 5.8 per cent in the control group). However, this difference was not statistically significant. Similarly, 24.5 per cent in the pilot group remained for a third year of post-16 education compared to 18.4 per cent in the control group, but the difference was not quite statistically significant. The most likely destination for moderate achievers who obtained a post-16 Level 2 qualification was a third year in post-16 education and EMA appeared to encourage this option (44 per cent and 32.8 per cent, respectively). (Chapter 5.4.3)
Among Year 11 low achievers, the draw into post-16 participation appeared to be among young people who took a two year course and then left (12.6 per cent compared to 6.9 per cent in the pilot and control areas, respectively). Year 11 low achievers who had improved their qualifications to Level 2 by Year 14 were most likely to enter a third year of post-16 education. In the pilot areas 43.3 per cent had opted to continue for another year, as had 44 per cent of the control group. Among low achievers who had obtained no post-16
qualifications, it appears that fewer EMA recruits had dropped out after two years and more had continued for a third year of post-16 education instead. In the pilot areas, 33.3 per cent of these young people reported that they had started a third year of post-16 education compared to 19.2 per cent of young people in the control areas. In contrast, 25 per cent of Year 11 low achievers in the pilot areas who had gained no post-16 qualifications reported that they had dropped out after one year compared to 50.7 per cent of their counterparts in the control areas. (Chapter 5.4.4)
Overall, it was concluded that EMA appears to have had a positive impact upon participation in post-16 education among low and moderate achievers in Year 11 but not among higher achievers. However, among higher achievers more young people appear to have been
encouraged by EMA to enter Higher Education, but EMA eligible young people who entered higher education were those who had achieved similar standards at Level 3 to those who would have entered Higher Education without EMA. There was no evidence to suggest that EMA had an impact on post-16 achievement, because there was no difference between average achievement between pilot and control groups. Consequently, as average post-16 achievement was not significantly lower in the pilot group compared to the control group, it also appears that EMA recruits perform to similar standards as young people who would have entered post-16 education without EMA. (Chapter 5.5)
Most young people who had completed two years of post-16 education and who had received EMA reported that they had qualified for an achievement bonus (58.4 per cent). Among the urban variants of EMA, Variant 2 had the lowest proportion who reported qualifying for the bonus (51.8 per cent) and Variant 4, which paid the largest achievement bonuses, the highest (71.1 per cent). Young people receiving a partial award of EMA; with the highest levels of Year 11 achievement; and, from the highest socio-economic groups were most likely to report that they had qualified for an achievement bonus (Chapter 5.6.1).
Chapter 6 Entry into Higher Education
PSM techniques found no significant impact of EMA on entry in to higher education at this stage of the evaluation (Chapter 6.2).
Descriptive analysis suggested that white young people in the pilot areas (19.1 per cent) were slightly more likely to have a higher education place than those in the control areas (16.5 per cent), but that non-white young people in the pilot areas were slightly less likely to have a higher education place (23.9 per cent) than those in the control areas (25.2 per cent). Young people who were most likely to have been eligible for a full EMA, that is, young people in the pilot areas with no parent working, were less likely to have a higher education place than their counterparts in control areas (Chapter 6.3.1).
More EMA ineligible young people than those eligible for EMA had a place on an honours degree course; 79.8 per cent compared with 77.8 per cent of young people who had been in continuous EMA receipt, 74.3 per cent of those eligible but who received no EMA and just 60.3 per cent of those who had received EMA at some point only (Chapter 6.4.1)
EMA-ineligible young people were more likely than all groups of EMA eligible young people to have a place at an ‘old’ university. Almost half of EMA ineligible young people had a place at an ‘old’ university (49.8 per cent), compared with less than two-fifths of those who had received EMA continuously (38.8 per cent) or at some point (38.4 per cent)
(Chapter 6.4.2)
While reasons associated with particular courses and universities were the most commonly cited reasons for choice of university for all groups, financial reasons were most important to young people who had continuously received EMA throughout their period in further
education. Of those in continuous receipt 58.7 per cent gave a financial reason, compared with 49.5 per cent of those in receipt at some point, 41.1 per cent of eligible non-recipients and 39.5 per cent of ineligible young people (Chapter 6.4.2)
Young people who had been in continuous receipt of EMA were more likely to live with their parents during term-time (47.1 per cent) than those who had receive EMA at some point (38.8 per cent), EMA ineligible young people (33.2 per cent), and EMA eligible non-recipients (28.6 per cent) (Chapter 6.6.1)
Take-up of student loans was high for all groups, but those who had been in continuous EMA receipt had the highest take-up rate (88 per cent) (Chapter 6.6.2)
Only half (49.6 per cent) of young people who had been in continuous EMA receipt received help with living costs from their parents. This compares with 69.2 per cent of those in receipt of EMA at some point, 73.5 per cent of those who were never in receipt of EMA and 68 per cent of EMA ineligible young people (Chapter 6.6.3)
A high proportion of young people had, or intended to have, a part-time job in their first year of higher education (80 per cent). Young people who had been in continuous EMA receipt were most likely to say that they could not afford to study otherwise (39 per cent). This group also worked the longest hours. (Chapter 6.6.5)
per cent). However, the amount of non-receipt of support with tuition fees in the EMA eligible groups remained surprisingly high (Chapter 6.6.7)
Chapter 7 Young People and the Labour Market
This chapter examines the labour market experiences of young people who had left full-time education at the start of Years 12, 13 and 14 in order to explore whether participation in post-16 education enhances young people’s labour market opportunities (Chapter 7.1).
Among young people who had entered the labour market at Year 12, there were few significant differences between the pilot and control areas in terms of occupational entry points, irrespective of whether young people had entered government supported training, work based training, or work without training (Chapter 7.2.1). Young people who had entered work without training in Year 12 were more likely to be in insecure seasonal, temporary or casual jobs and were more likely than other groups of young people to have changed their jobs by the start of Year 13. Those who had entered government supported training in Year 12 were most likely to be in the same job one year later (Chapters 7.2.1 and 7.2.2).
Analysis of the occupational entry points of young people who had entered the labour market at the start of Year 13 could not isolate the extent to which one year spent in post-16
education had enhanced the labour market opportunities available to young people (Chapter 7.2.3).
However, it would appear that the occupational choices open to young people who had spent two years in post-16 education were much greater than for young people who left school at 16 and who had attempted to progress through the work-based training or non-training routes. Young people who entered the labour market at Year 14 from full-time education were in higher occupational categories, in particular management, professional, associate professional technical occupations, than those who had entered the labour market at Year 12. In addition, most young people who had entered the labour market at Year 14 had done so without the assistance of government supported training provision (Chapter 7.3.2).
Just over one half of young people in the NEET group in both pilot and control areas in Year 14 were new entrants, that is, they had not been in the NEET group at either the start of Year 12 or 13. However, nearly one half of EMA eligible young people in both pilot and control areas who had entered the NEET group at Year 12 were still NEET by Year 14 (Chapter 7.3.3).
Chapter 8 EMA and Part-Time Work
The final chapter of the report explores how young people who were eligible for EMA combined time work with full-time post-16 education, focusing on participation in part-time work and hours worked, and how these appear to be related to EMA and to other characteristics of young people. Regression and PSM analytic techniques are employed
(Chapter 8.1).
1 INTRODUCTION
This publication is the third quantitative report in a series arising from an evaluation of the piloting of Education Maintenance Allowances (EMAs), commissioned by the Department for Education and Skills (DfES). The evaluation is being undertaken by a consortium of research organisations, led by the Centre for Research in Social Policy (CRSP), that includes the National Centre for Social Research (formerly SCPR), the Institute for Fiscal Studies (IFS) and the National Institute for Careers Education and Counselling (NICEC).
This report is the first since the government announced its decision to roll EMA out
nationally in September 2004. As part of its commitment to increasing post-16 participation in learning, the government’s Spending Review, published in July 2002 states that,
“Following successful pilots the Government is introducing Education Maintenance Allowances nationally from 2004…For many young people from low-income families they will make staying in education after 16 a realistic choice for the first time”.
(HM Treasury, 2002)
At the time of writing many decisions on the structure and delivery of the national scheme have yet to be taken and the remainder of the evaluation is now to be refocused to assist policy makers in planning for national implementation of the scheme. However, despite the policy decision that EMA has proved sufficiently successful in terms of its positive impact on participation and retention in post-16 education to merit its extension nationwide, much remains to be said about the potential longer term effects of EMA on young people as they move from compulsory education through to the labour market.
The longitudinal quantitative evaluation includes large samples of young people who finished compulsory education in the summers of 1999 and 2000 who, when the data presented in this report were collected, were at least one or two years into their post-school life. This means that the evaluation can now begin to complete its original objectives of estimating the impact of EMA on participation, retention and achievement in post-16 education. In particular, this report explores:
• Relationships between the effect of EMA on participation and retention in education, the socio-economic background of young people and their levels of achievement at the end of compulsory education (school Year 11) (Chapter 3);
• Differences in the types of courses that young people had chosen on entering post-16 education and their achievements during the first year of post-compulsory education (Chapter 4);
• The impact of EMA on educational achievement and progress that young people had made in the first two years since leaving compulsory education (Chapter 5);
• The impact of EMA on young people’s entry to higher education and the choices that they had made in relation to institutions, courses, living accommodation and their intentions for supporting themselves financially (Chapter 6);
• The contrasting experiences of young people who had joined the labour market
immediately after they had completed compulsory education with those who did so two years later after completing two years in post-16 education (Chapter 7); and
• An initial investigation of how young people combine full-time post-16 education with part-time work and the relationship between this and EMA availability (Chapter 8).
The findings reported here are based on analysis of five datasets produced from five
interviews with young people (and their parents at Wave 1). These are shown in Table 1.1, which also shows the academic year in which young people were at the time of each interview and the year in which interviews were undertaken. A fuller description of the survey design is shown later in this chapter (see Section 1.2.1). Throughoutthis report, academic years are used in preference to the terminology of interview ‘waves’ since they are simpler and easier to understand, although this terminology is, of course, not strictly
applicable to those young people who were not in education. In addition, not all readers will be familiar with academic years and, in any event, ‘Year 14’ is not commonly used since it extends beyond the age range of traditional schooling. Therefore, the approximate age of young people at the time of each interview is also shown in Table 1.1 so that the reader can bear this in mind in what follows.
Table 1.1 Datasets
Dataset: Interview at
the Start of Academic
Year:
Interviewing
begun in: Approximate age of Young People:
Approximate Time since Completing Compulsory
Education:
Cohort 1 Wave 1 12 1999 16 – 17 years 3 months Cohort 1 Wave 2 13 2000 17 - 18 years 15 months Cohort 1 Wave 3 14 2001 18 – 19 years 27 months Cohort 2 Wave 1 12 2000 16 – 17 years 3 months Cohort 2 Wave 2 13 2001 17 – 18 years 15 months
The remainder of this introduction gives a brief policy synopsis and description of EMA followed by a description of the quantitative evaluation including its design, the samples of young people, the questionnaires, the weighting and analytic strategies, and the approaches used to measure achievement and socio-economic group.
1.1 The Education Maintenance Allowance
Education Maintenance Allowances (EMAs) are being piloted with a view to raising participation, retention and achievement in post-compulsory education among 16-18 year olds. EMA is a means-tested allowance paid to 16-18 year olds from lower income families (or in some areas to their parents). It is paid in addition to any Child Benefit that is claimed for a young person in post-16 education.
The pilot provision began in September 1999 by introducing four models of the main EMA in 15 Local Education Authorities (LEAs) (see Box 1.1). Variations exist in terms of the
weekly amount of EMA available, to whom it is paid (either the young person or their parents), and in the amounts which are paid for retention and achievement bonuses. The full weekly allowance is payable if total parental taxable income does not exceed £13,000 per annum, while for those with a total parental income of between £13,000 and £30,000
England and will be available to all eligible young people from September 2004. Five of the initial 15 pilot areas, Leeds and four Inner London Boroughs, could not be included in the main statistical evaluation because of different eligibility criteria (see further below). These five LEAs are being evaluated separately from the primary evaluation reported here, and initial results of that evaluation have been published in Heaver et al., (2002).
Box 1.1 Design and Coverage of the Main EMA Pilot
Model LEA Pilot Areas Awards
Variant 1 Middlesbrough, Walsall, Southampton, Cornwall, Leeds, Inner London (Lambeth, Southwark, Lewisham, Greenwich)
£30 per week plus £50 retention and £50 achievement bonus
Variant 2 Oldham, City of Nottingham £40 per week plus £50 retention and £50 achievement bonus
Variant 3 Bolton, Doncaster £30 per week paid to parents plus £50
retention and £50 achievement bonus
1.2 The Evaluation of EMA
The main aim of the evaluation is to assess the impact of EMA on young people’s post-16 participation, retention and achievement in full-time education, although there are a number of subsidiary aims and objectives that have been fully described in earlier reports (for example, Ashworth et al., (2002). The main EMA evaluation started in 1999 and it is currently intended that the final wave of interviews will start in 2003 with a final reporting date of 2004 (Box 1.2). The main evaluation includes a number of important elements in addition to the statistical evaluation reported here, each of which have also produced a number of published reports3.
Further, and in addition to the separate evaluation of five of the original fifteen pilot areas in Leeds and London referred to above, an evaluation of flexibilities to EMA, targeted at
vulnerable groups of young people, is also being undertaken. Further details about the design of these other elements of the evaluation can be found in (Ashworth et al., 2001) and in the other evaluation reports referred to throughout this report.
1.2.1 Design of the statistical evaluation
The design of the statistical evaluation is a longitudinal cohort study involving large surveys of random samples of young people in the 10 EMA pilot areas and 11 control areas4.
Box 1.2 summarises the design of the statistical evaluation. Two cohorts of young people are being studied, young people who completed Year 11 (the end of compulsory schooling) in summer 1999 and in summer 2000. The first wave of interviews with each cohort is conducted face-to-face and includes an interview with a parent or guardian of the young person. Three subsequent waves of telephone interviews are to be undertaken at annual intervals5.
Box 1.2 Survey Design
EMA Cohort 1
Wave 1 Wave 2 Wave 3 Wave 4 Face-to-Face Telephone Telephone Telephone 1999 2000 2001 2002
EMA Cohort 2
Wave 1 Wave 2 Wave 3 Wave 4 Face-to-Face Telephone Telephone Telephone 2000 2001 2002 2003
1.2.2 Questionnaires
All questionnaires have been designed in consultation with the DfES.
Wave 1 interviews include:
A household and parent/guardian’s questionnaire to provide information about: • household composition, relationships, tenure, income and ethnicity;
• education decisions and current activities of the young person’s siblings; • parent’s occupation and educational qualifications;
• involvement of parents in the young person’s decisions about what to do at the end of Year 11;
• the young person’s childhood; • parent’s attitudes to education; and
A young person’s questionnaire which covers:
• activities since Year 11 and at the time of interview, including courses being studied and
part-time work for those in full-time education;
• experiences during Years 10 and 11 at school, including qualifications entered for and obtained;
• Year 11 decisions about what to do next, sources of advice and help, and reasons for decisions;
• distances travelled to school or college and travel costs; • sources and amounts of income, including EMA; and • expenditure patterns and amounts.
The young person’s questionnaire at Wave 2 includes: • activities since Wave 1;
• reasons for activity changes; • decision-making and future plans;
• qualifications started and completed since Wave 1; • sources of funding for students, including EMA; and • expenditure patterns and amounts.
The young person’s questionnaire at Wave 3 contains information about: • activities since Wave 2;
• reasons for activity changes;
• qualifications started and completed since Wave 2; • entry into Higher Education;
1.2.3 Sample sizes and response rates
Sample sizes drawn for the first wave of interviews with each cohort had to be sufficiently large to:
• allow statistically significant differences of approximately five percentage points in participation, retention and achievement between pilots and controls and between the different EMA variants to be measured; and
• take account of the proportion of young people who would inevitably drop out of the evaluation in subsequent waves of interviews (sample attrition).
Wave 1 (Year 12) samples were drawn by the Department for Work and Pensions (DWP6) from Child Benefit records, following specifications provided by the National Centre for Social Research.
The target populations were young people born between 1 September 1982 and 31 August 1983 (Cohort 1 EMA), and between 1 September 1983 and 31 August 1984 (Cohort 2 EMA) who lived in one of the 21 pilot and control LEA areas covered by the study, as defined by their postcode. A small proportion of ‘cases in action’ was excluded by the DWP.
The National Centre specified a random method for selecting the required number of young people from each LEA, to form the total samples. The additional sample above target was to allow for attrition arising from ‘opt-out’ (see below) and non-response.
The target number differed between LEAs according to whether they were pilot or control areas. For urban LEAs a simple random sample of eligible young people was drawn. For rural LEAs, which covered larger distances, a two stage sampling method was followed with a first stage of selecting postcode sectors with probability according to their populations of eligible young
people, and a second stage of selecting a fixed number of young people.
Following selection of the sample an opt-out mailing was administered. The letter was addressed to the parent or guardian who received Child Benefit for the young person.
The Wave 2 (Year 13) sample was drawn from young people who had agreed to be re-interviewed at the Wave 1 (Year 12) stage. However, not all of the young people who responded in the first wave were issued for re-interviewing in the second wave. The original design proposed dropping young people from the Wave 2 (Year 13) sample who were income ineligible for EMA7. In the event, young people were excluded from the second wave sample if they or their parents had provided no usable income data in Wave 1 (Year 12), hence their eligibility for
EMA could not be determined. Once this group was excluded, along with people who could no longer be traced, it was possible to follow the remaining eligible and ineligible Wave 1 (Year 12) respondents. The exceptions to exclusion through a failure to provide income data were young people who were defined as ‘vulnerable’ and, therefore, of potential interest to the evaluation of the EMA Extension Pilots. Vulnerable young people met one or more of the following criteria: they lived with neither biological parent, had a child or were pregnant, or had special educational needs or a disability. These young people were included in the sample issued for Wave 2 (Year 13).
Fieldwork was undertaken by the National Centre for Social Research. For the Cohort 1 Wave 3 (Year 14) and Cohort 2 Wave 2 (Year 13) interviews, the fieldwork period spanned September 2001 to April 2002.
Response rates were again high (Box 1.3). A total of 5,973 interviews were completed within Cohort 1 Wave 3 (Year 14), which represented a response rate of 80 per cent of issued names (which was the target response rate). A total of 7,709 interviews were completed with young people within Cohort 2 Wave 2 (Year 13), which is a response rate of 78 per cent of issued names. The Cohort 2 Wave 2 (Year 13) sample response rate was the same as that obtained for Cohort 1 Wave 2 (Year 13) in 2001.
7 As the focus of the research was on the impact of EMA on eligible young people, the extra cost of following
Box 1.3 Sample Sizes and Response Rates
EMA Total Issued
Sample
No. of Individuals Withdrawn
Per Centa
Per Centb
Cohort 1 Wave 3 (Year 14)
Available from Wave 2 (Year 13) 7,560
Excluded: refused to be recontacted 125
Sample issued 7,435 100
Address/telephone number problems 10 0
Movers/not known at address 261 4
Sub-total issued* 7,164 100
Non-contacts 425 6 6
Refusals 281 4 4
Unproductives 485 7 7
Total Interviews 5,973 80 83
Cohort 2 Wave 2 (Year 13)
Available from Wave 1 (Year 12) 11,035
Excluded: refused to be recontacted 123
Excluded: income data not availablec 1,049
Sample issued 9,863 100
Address/telephone number problems 722 7
Movers/not known at address 295 3
Sub-total issued* 8,846 100
Non-contacts 200 2 2
Refusals 331 3 4
Unproductives 606 6 7
Total Interviews 7,709 78 87
Note: Two sets of response rates are derived. The first (a) is based upon the total issued sample and does not take into account reasons where it is not possible to contact the young person. The second (b) removes the non-contact addresses and provides a better indicator of the quality of response from available addresses.
c The original design did not allow for the follow-up of non-income eligible young people. However, once
young people were excluded because of missing data problems with annual household income in the previous tax year (unless they belonged to a ‘vulnerable group’), it was possible to follow up non-eligibles.