Predicting the Optimum Time to Apply Monolayers to Irrigation
Channels
A dissertation submitted by
Michelle Winter, Bachelor Engineering (Civil) (Honours)
For the award of
Masters of Engineering Research
Michelle Winter
Modernisation, Goulburn-Murray Water
Abstract
The research project aimed to investigate the potential of using chemical monolayers on
irrigation channels to reduce evaporation losses. Monolayers consist of a film one molecule
thick that covers the entire water surface and reduces water evaporation. The effectiveness
of monolayers at reducing evaporation from still water bodies has been widely studied, with
the technology having been adopted by some irrigation authorities on storage dams.
However, little research has been done into investigating the effectiveness of monolayers in
reducing evaporation in flowing situations. Goulburn-Murray Water has an extensive
network of irrigation channels of which evaporative losses are a major component of the
total yearly water losses (approximately 70 GL/year). The purpose of this work was to
establish a decision support system to predict under what situations it is most appropriate
for Goulburn-Murray Water to apply monolayers to irrigation channels.
Closed and flowing channel trials were conducted by Goulburn Murray Water. The
closed channel trials indicated that using monolayers on irrigation channels could result in
potential savings of between 10% and 30%, while the flowing trials gave promising
preliminary results into the ability of ES300 to pass a regulating structure and reform with
surface pressure adequate to suppress evaporation.
Modelling the use of monolayers on irrigation channels has shown that the most
critical barrier to the cost effectiveness of monolayers is the ability to pass culvert
structures. Therefore, it is imperative that investigations are undertaken to determine
whether a technique can be developed to allow monolayers to pass culvert structures. The
model needed to take into consideration many variables including evaporation rates, wind
impacts, material costs and channel dimensions.
Modelling also indicated that where monolayers are unable to pass culvert
structures, cost effectiveness is increased if the flow of the monolayer down the channel can
be slowed, thereby retaining the monolayer on the channel for longer and reducing the
number of times it needs to be reapplied. Methods to achieve this include applying
technique remains a costly method of saving evaporation water due to the continual
reapplication of product. Its main attractiveness for use is that it can be used when and
where required without large capital investment and at times when the cost can be
warranted by the value of water.
The model is specific to the Goulburn-Murray Water channel system, however flow
charts have been developed to enable other irrigation authorities to characterise their
irrigation network in order to apply the model to their situation. In order to use the model,
Goulburn-Murray Water needs to set the maximum $/ML that it is willing to pay at that time
and then review the model output to determine where to apply monolayers to achieve that
result.
Depending on the drivers to save water, monolayers are most suited to application
on the longest pools. Savings at well below $200/ML can be achieved by applying ES300 to
the 1% longest carrier channels when evaporation is 4.5 mm/day or greater, however the
total volume that could be expected to be saved under these conditions is only 70 ML or
0.1% of the current total losses due to channel evaporation. The total savings achieved and
the average cost of achieving those savings are intrinsically related and an improvement in
one will detrimentally affect the other.
Keywords:
reported in this dissertation are entirely my own effort, except where otherwise
acknowledged. I also certify that the work is original and has not been previously submitted
for any other award, except where otherwise acknowledged.
________________________________ ___________________________
Signature of candidate Date
________________________________ ___________________________
Signature of Supervisor Date
________________________________ ___________________________
Acknowledgements
Name Details
Bruce Albrecht G-MW employee working on the evaporation
mitigation project, provided guidance, review, field and laboratory results
Mark Bailey G-MW manager, provided guidance
Matthew Davis G-MW employee, provided review
Peter Egglestone G-MW manager, provided review
Nigel Hancock USQ supervisor
Fiona Nioa G-MW manager, provided review
Jeremy Nolan G-MW manager, provided review
Derek Poulton Former G-MW employee & manager, provided
guidance and review
Rod Smith USQ supervisor
Willem Vlotman Former G-MW employee & manager, provided
1 INTRODUCTION... 1
1.1 SIGNIFICANCE OF THE ISSUE ...1
1.2 AIM OF THE RESEARCH PROJECT ...5
1.3 STRUCTURE OF THE DISSERTATION ...6
2 BACKGROUND & LITERATURE REVIEW ... 8
2.1 PRINCIPLES OF EVAPORATION ...8
2.2 EVAPORATION VOLUME ...8
2.3 VALUE OF THE LOST WATER ...10
2.4 AVAILABLE METHODS FOR REDUCING EVAPORATION ...11
2.4.1 SHADING MATERIALS 12 2.4.2 FLOATING COVERS &OBJECTS 12 2.4.3 POLYACRYLAMIDE 14 2.4.4 CHEMICAL COVERS -MONOLAYERS 14 2.4.5 BIOLOGICAL COVERS 17 2.4.6 UNUSUAL METHODS EMPLOYED IN OTHER COUNTRIES 17 2.4.7 DESIGN FEATURES 18 2.4.8 PIPELINES 18 2.5 POTENTIAL COSTS ASSOCIATED WITH WATER SAVINGS ...18
2.6 MONOLAYER CHEMICALS ...19
2.6.1 WATERSAVR™ 19 2.6.2 AQUATAIN 20 2.6.3 ES300 20 2.6.4 EMULSIONS OF CETYL AND STEARYL ALCOHOLS 21 2.7 AUSTRALIAN MONOLAYER FIELD TRIALS ...22
2.8 ISSUES IN THE USE OF MONOLAYERS ...22
2.8.1 MONOLAYER EFFECTIVENESS IN THE LABORATORY 22 2.8.2 MONOLAYER EFFECTIVENESS IN THE FIELD 23 2.8.3 BIOLOGICAL CONSIDERATIONS 23 2.8.4 LONGEVITY IN THE FIELD 24 2.8.5 ENVIRONMENTAL IMPACTS 24 2.8.6 HUMAN HEALTH IMPACTS 24 2.8.7 MONOLAYER NATURAL EXPANSION RATE 25 2.8.8 WIND &WAVES 27 2.8.9 TURBULENCE 29 2.8.10 OBSTRUCTIONS TO MONOLAYER MOVEMENT 32 2.8.11 APPLICATION OF MONOLAYERS TO RUNNING WATER 35 2.9 FIELD TRIALS ...36
2.9.1 FIELD TRIAL SITE 36
2.9.2 CALCULATING BASE SEEPAGE &LEAKAGE 37
2.9.3 STATIC TRIALS 38
ii
2.9.5 FLOWING TRIALS 41
2.10 OTHER CURRENT RESEARCH ...44
2.11 CONCLUSIONS ...44
3 DEVELOPMENT OF THE DECISION SUPPORT MODEL ... 46
3.1 PRELIMINARY CHANNEL CHARACTERISATION ...47
3.2 SEASONAL EVAPORATION ...54
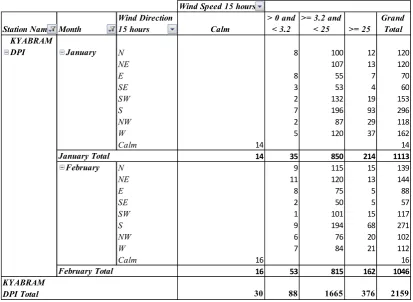
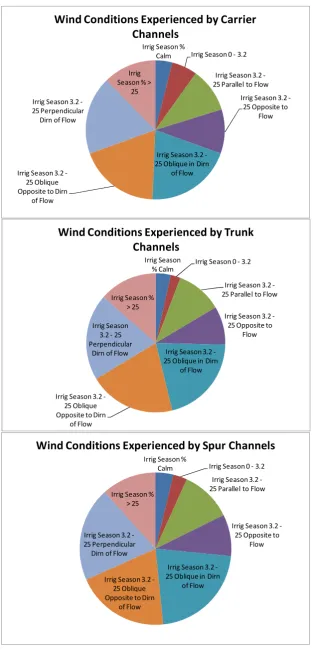
3.3 AVAILABLE WIND INFORMATION ...56
3.4 MONOLAYER EXPANSION UNDER VARYING WIND CONDITIONS ...60
3.4.1 MONOLAYER EXPANSION NO WIND 60 3.4.2 MONOLAYER EXPANSION –WIND BETWEEN 0 AND 3.2 KM/HR 63 3.4.3 MONOLAYER EXPANSION –WIND >3.2 KM/HR AND PARALLEL TO CHANNEL DIRECTION 65 3.4.4 MONOLAYER EXPANSION –WIND >3.2 KM/HR AND OPPOSITE TO CHANNEL DIRECTION 68 3.4.5 IMPACT ON MONOLAYER OF WIND OBLIQUE TO CHANNEL DIRECTION 71 3.4.6 IMPACT ON MONOLAYER OF WIND PERPENDICULAR TO CHANNEL DIRECTION 73 3.4.7 WIND >25KM/HR 74 3.4.8 SUMMARY OF WIND CONDITIONS EXPERIENCED BY GMIDCHANNELS 75 3.4.9 SUMMARY OF WIND CATEGORIES USED FOR MODEL 77 3.4.10 DURATION OF WIND EVENTS AND THE POSSIBLE IMPACTS 79 3.4.11 CHANNEL CHARACTERISATION PROCESS –FLOW CHART 81 3.5 IMPACT OF OBSTACLES ...82
3.6 EFFICACY OF MONOLAYERS IN THE FIELD ...85
3.7 ADDITIONAL PRODUCT INFORMATION ...85
3.8 MODEL DESCRIPTION ...86
3.9 CONCLUSIONS ...87
4 RESULTS &DISCUSSION ... 89
4.1 EXAMPLE RESULTS –AVERAGE TRUNK CHANNEL ...89
4.1.1 DAILY MONOLAYER MATERIAL REQUIREMENT 89 4.1.2 DAILY SAVINGS ACHIEVED 91 4.1.3 $/MLCOST OF WATER SAVINGS ACHIEVED –AVERAGE WIND CONDITIONS 93 4.1.4 $/MLCOST OF ACHIEVING WATER SAVINGS –DETAILED WIND CONDITIONS 95 4.1.5 PERIOD OF TIME FOR WHICH PARTICULAR ENVIRONMENTAL CONDITIONS EXIST 100 4.1.6 TOTAL VOLUME OF SAVING THAT CAN BE ACHIEVED 101 4.1.7 TOTAL COST OF ACHIEVING SAVINGS 103 4.1.8 ACHIEVING SAVINGS AT REQUIRED $/MLTHRESHOLD 106 4.2 RESULTS –OTHER CHANNEL TYPES ...108 4.2.1 SUMMARY OF RESULTS –TRUNK,CARRIER &SPUR CHANNELS 108 4.2.2 SUMMARY OF RESULTS –25%LONGEST CARRIER,TRUNK &SPUR
4.2.4 SUMMARY OF RESULTS –1%LONGEST CARRIER,TRUNK &SPUR CHANNELS 108
4.3 SUMMARY OF RESULTS –ALL CHANNEL TYPES ...108
4.4 MONOLAYERS COMPARED TO OTHER TECHNIQUES OF SAVING EVAPORATION ...119
5 CONCLUSIONS AND RECOMMENDATIONS ... 120
5.1 SUMMARY OF WORK UNDERTAKEN ...120
5.1.1 LITERATURE SURVEY 120 5.1.2 LABORATORY &FIELD TRIALS 121 5.1.3 MODEL DEVELOPMENT 122 5.2 CONCLUSIONS ...123
5.3 RECOMMENDATIONS ...124
5.3.1 AREAS OF FURTHER RESEARCH 124 5.3.2 APPLICATION BY GOULBURN-MURRAY WATER 126 6 REFERENCES ... 128
7 BIBLIOGRAPHY ... 134
8 GLOSSARY OF TERMS ... 136
1 INTRODUCTION
The research project aimed to investigate the applicability of using chemical monolayers on
irrigation channels to reduce evaporation losses and to establish a decision support system to
predict the optimum times, environmental conditions and locations for Goulburn-Murray
Water (G-MW) to apply monolayers. To date, minimal research has been done into reducing
evaporation losses from irrigation channels, with the main available methods being
pipelining, shade cloth covers and plastic covers. Monolayers potentially provide a low cost
water savings solution which can be targeted for use during high evaporation periods.
However, monolayers are not without their problems and many difficulties have been
experienced in their use including: application difficulties, wind displacement and rapid
bacterial/microbial degradation.
The project reviewed past and present research into monolayers and where possible
utilised test results from the application of monolayers to irrigation channels being
undertaken by G-MW in a parallel project. The decision support system produced can be
used to determine the “best” set of conditions that produce the lowest cost ($/ML) of water
savings (that is the most cost effective water savings). This can be extrapolated to the full
extent of G-MW’s channel network to determine if it is feasible to make use of monolayers
on irrigation channels to reduce evaporation.
1.1 Significance of the issue
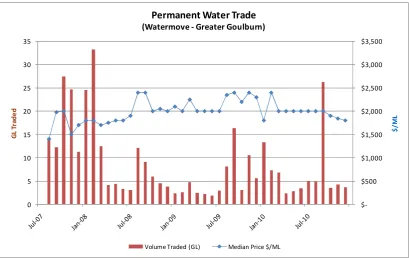
Over the past ten years prior to 2009/10 much of Victoria, including the Goulburn-Murray
Irrigation District (GMID) in the north of the state, experienced significant dry conditions
with rainfall well below average and irrigation allocations being the lowest on record. Scarce
water resources were stretched to their limits with demand by the environment, irrigators and
urban Melbourne, reflected in record high prices for both permanent and temporary water
Figure 1.1 Temporary water price trends
Figure 1.2 Permanent water price trends
$-$250 $500 $750 $1,000 $1,250
0 3 6 9 12 15
$
/
M
L
G
L
T
ra
d
e
d
(Watermove - Greater Goulburn)
Volume Traded (GL) Price $/Ml Allocation 100% Allocation
$-$500 $1,000 $1,500 $2,000 $2,500 $3,000 $3,500
0 5 10 15 20 25 30 35
$
/
M
L
G
L
T
ra
d
e
d
Permanent Water Trade (Watermove - Greater Goulburn)
[image:10.595.116.526.412.671.2]Many water savings projects are underway to conserve this limited resource. Losses from the
G-MW channel system consist of leakage, seepage, evaporation, measurement error, outfalls
and theft. Current water savings initiatives focus on a number of strategies such as:
• removing a channel from use (saving all losses on that channel section);
• channel automation (saving outfalls and leakage);
• meter replacement (saving measurement error and meter leakage);
• channel lining (saving seepage and leakage); and
• pipelines (saving seepage, leakage and evaporation, but limited to small channels).
Latest estimates (refer to Figure 1.3) indicate evaporation losses from channels could be as
Figure 1.3 Baseline water losses in the GMID (Goulburn-Murray Water, 2010)
1 The baseline year is essentially 2004/05 except for Campaspe which uses 2003/04 and Central
Goulburn 1-4 Channels which use 2005/06 in place of 2004/05. 2004/05 was a 100% allocation year.
Water Losses (Baseline Year)
Outfalls (ML) 13%
Leakage around Outfalls (ML)
0%
Meter Inaccuracy (ML) 22%
Leakage through Meters (ML)
6%
Leakage around Meters (ML)
1% Seepage (ML)
18% Evaporation (ML)
12% Thef t (ML)
3% Unmetered D&S
pipes (ML) 0%
1.2 Aim of the Research Project
The research project aimed to investigate the applicability of using the monolayer method on
irrigation channels to reduce evaporation losses and to establish a decision support system to
predict the optimum times, environmental conditions and locations for G-MW to apply
monolayers.
The decision support system provides an estimate of $/ML of water saved (by
extrapolating the mm/day results to “average” pool dimensions) when applying monolayers
to irrigation channels under a given set of input conditions. The decision support system can
be used to determine the “best” set of conditions that produce the lowest cost ($/ML) of
water savings (that is the most cost effective water savings). This can be extrapolated to the
full extent of G-MW’s channel network to determine whether it is feasible to implement
monolayers on irrigation channels to reduce evaporation. Changing variables with time (such
as increasing or decreasing willingness of G-MW and/or external investors to fund water
savings projects at increased costs or continued changing climatic conditions) will make the
application of monolayers to channels more or less attractive with time.
Broadly, the research project aimed to address the following questions:
• Can monolayers be effectively utilised on water that is flowing in channels?
• In what situations is it most appropriate for G-MW to apply/not apply monolayers to
irrigation channels?
• What evaporation savings can potentially be achieved by using monolayers
extensively on the G-MW network? and
• What gaps still exist in our understanding and knowledge of monolayers?
Creating a decision support system, in the form of a spreadsheet model, was considered to be
the best way of answering the research questions posed above.
Tasks required to be undertaken included:
• Characterising the channel network; and
channels in the field, a project that I also had a significant role in and the results of which
were used to inform this research project. The aims of the field work were:
• Applying monolayers to an irrigation channel that was non-flowing;
• Determining rate of savings that could be achieved on the non-flowing channel and
comparing to other studies;
• Applying monolayer to a flowing channel and determining the management issues
created or the boundaries for application and the situations under which it is
effective or not effective; and
• Applying different commercially available monolayers to enable contrast and
comparison.
The outcomes of this research project (and the concurrent field work) are:
• Update current knowledge in the use of monolayers on irrigation channels;
• Review the use of monolayers on irrigation channels in the field (from involvement
in the concurrent G-MW project); and
• Development of a decision support system to inform the application of monolayers
on irrigation channels.
1.3 Structure of the Dissertation
The dissertation comprises the following chapters:
• Introduction
• Background
Review of available literature on: evaporation volumes, methods of reducing
evaporation, past monolayer research and products; and issues in the use of
monolayers particularly in a flowing situation.
• Development of the Decision Support Model
Development of a model to enable G-MW to determine the best set of conditions to
• Results & Discussion
Presentation of the results of the modelling.
• Conclusions and Recommendations
When and where should G-MW apply monolayers to achieve a particular $/ML
outcome and what additional research needs to be undertaken into the use of
monolayers on irrigation channels.
This section of the thesis reviews the total volume of water lost to evaporation, methods of
evaporation reduction, past monolayer research and results; and obstacles to monolayer use
in irrigation channels.
2.1 Principles of Evaporation
Evaporation is the transformation of water from the liquid state to the gas state (water
vapour). This process requires:
• energy to perform the process;
• a free surface layer for the water molecules to move through;
• unsaturated air (low relative humidity) above the water surface; and
• air movement above the water surface to move the water vapour away.
Therefore evaporation is influenced by: solar radiation, temperature, humidity, wind speed
and water depth. Total evaporation from a water body increases with increased water body
area.
2.2 Evaporation Volume
The quantity of evaporation from the irrigation channel network is large due to the extent of
exposed water surface and due to the climatic conditions within the region.
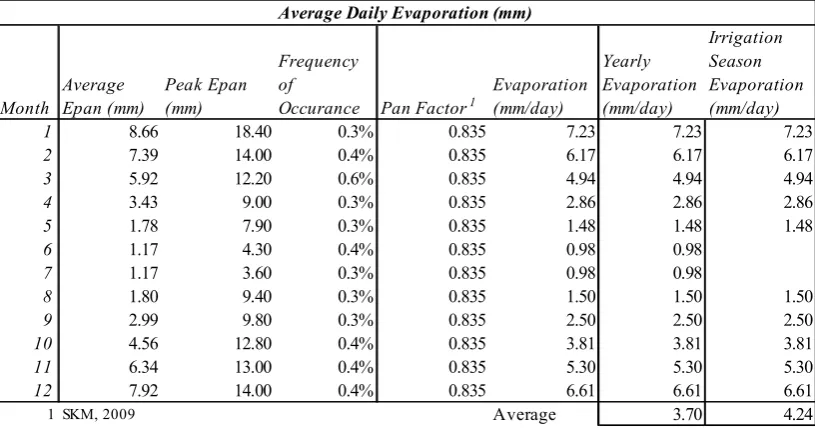
Estimates of yearly evaporation volume can be based on Class A Pan evaporation, pan
factor, rainfall, channel area and consideration of channel bank degradation. Calculation of
losses within the GMID has been reviewed for the Northern Victorian Infrastructure
Renewal Project (NVIRP), with the agreed losses as presented in Table 2.1. The estimated
total yearly evaporation (less rainfall) is 70 GL within the 2004/05 baseline year
(Goulburn-Murray Water 2010).
A considerable portion of the gravity network system is proposed to be rationalised
(abandoned or privatised) under NVIRP stages 1 and 2. The proposed rationalisation would
result in a reduced channel surface area and reduced yearly evaporation of 47 GL
Table 2.1 GMID losses (Goulburn-Murray Water, 2010)
Water Losses (Baseline Year) Total
(Pre Modernisation)
Backbone Non-Backbone
Outfalls (ML) 76,650 40,350 36,300
Leakage around outfalls (ML) 150 50 100
Meter inaccuracy (ML) 121,950 56,700 65,250
Leakage through meters (ML) 35,900 17,250 18,650
Leakage around Meters (ML) 7,400 3,600 3,800
Seepage (ML) 101,550 67,850 33,700
Evaporation (ML) 70,300 47,350 22,950
Theft (ML) 17,050 8,200 8,850
Unmetered D&S pipes (ML) 1,900 1000 900
Bank leakage (ML) 140,400 64,100 76,300
Natural carrier losses (ML) 74,400 35,150 39,250
TOTAL (ML) 647,650 341,600 306,050
1 The Campaspe district is included within this table, although it is now in the process of being
rationalised.
2 Backbone and non-backbone are explained in further detail in Table 3.1.
3 These losses were calculated for the 2004/05 baseline year and have not been converted to long term
averages
Evaporation as detailed in Table 2.1 is net evaporation, that is evaporation less rainfall.
Goulburn-Murray Water is interested in the total losses from the system and balancing these
with the system inputs, therefore only considers net evaporation when reporting total water
losses.
The use of Class A Pan evaporation is G-MW’s adopted method of calculating
evaporation from water bodies. The limitation of this method is that it tends to overestimate
the evaporation, therefore corrections factors (pan factor) are used to adjust the observed pan
evaporation to estimated evaporation from a large water body. However, the pan factor is
specific to the type of pan used, the location of the pan and type of water body. G-MW
adopts a pan coefficient of 0.8 (SKM, 2009 & Department of Sustainability and
Environment, 2010).
More accurate methods exist for the calculation of evaporation from water bodies which
remainder is attributed to evaporation;
• energy budget – measures the difference between energy inputs and energy outputs
but requires site specific measurements;
• bulk transfer – a method which is suited to very large water bodies;
• combination methods – combine the energy budget and mass transfer methods,
which again require site specific measurements.
The accurate calculation of the evaporation volume from irrigation channels is beyond the
scope of this thesis and therefore G-MW’s adopted method of Class A Pan evaporation has
been used within the modelling to determine the total savings that could be expected to be
achieved by applying monolayers to irrigation channels. The $/ML savings have been
calculated for different evaporative rates and are unaffected by the method of calculation.
If the rate of evaporation was found to be a major driver to the cost effectiveness of the
application of monolayers to irrigation channels than it would be necessary to review the
way in which the evaporation is calculated in order to substantiate the total savings that
could be achieved if the method was adopted.
2.3 Value of the Lost Water
There are a number of ways to consider the value of the lost evaporation water, ranging from
the gross value of production that could have been achieved, to the value of the water on the
temporary trading market. It can also be compared to current water savings initiatives and
the price investors are willing to pay for the water savings achieved.
The 2004/05 Water Account (Australian Bureau of Statistics, 2006) indicated that
Australia wide, the gross value for water consumption across all agricultural sectors was
$744/ML (varying from $162/ML for rice to $3,867/ML for vegetables). The baseline
evaporation losses from G-MW’s channel network was calculated to be 70 GL (refer Table
2.1) which would have equated to a gross value of approximately $270M if fully utilised and
not lost to evaporation. Following modernisation, yearly evaporation would equate to a gross
value of approximately $180M if fully utilised.
In an “average” irrigation season, that is 2003-2006 when water scarcity did not cause
excessive temporary transfer prices, water entitlement on the temporary trade market
a value of approximately $3M annually based on temporary trade prices. During the drought,
the temporary trade market reached a peak value on of $1000/ML in December 2007.
The most recent water savings initiative is NVIRP. Stage 1 of the project has a budget of
1.004 billion dollars and is estimated to produce annual water savings of 225 GL (NVIRP,
2010), that is $4,500/ML of water savings permanently achieved. Stage 2 is still being
finalised, but is estimated to produce water savings at $5,500/ML. The NVIRP project is a
once off capital investment. Monolayers are an operational investment or procedure, and can
be utilised when and where required and only achieve the savings in a single irrigation
season, not in perpetuity. The most recent comparable operational investment is the pumping
of Waranga Basin which allowed G-MW to access dead storage and make this available to
customers during drought conditions. The cost of pumping varied between $33/ML in
2006/07 and $18/ML in 2008/09.
Regardless of the way it is calculated, evaporation losses from the gravity irrigation
network are of considerable value and are therefore worthy of investigating savings that can
be achieved. Further, as the easier water savings are achieved through improved metering
and reducing leakage, the focus will shift to the more expensive water savings options,
including reducing evaporation.
2.4 Available Methods for Reducing Evaporation
The main methods for reducing evaporation on existing water bodies include:
• limiting the surface area exposed which reduces how much water is available for
evaporation;
• reducing the temperature which reduces the energy available for evaporation;
• reducing the wind speed over the water surface which reduces how fast the water
molecules can be moved away; and
• providing a barrier to the movement of the water vapour molecules away from the
surface.
Design features are a means for reducing evaporation on new water storages, while
biological covers such as floating plants offer a limited evaporation reduction.
Depending on the method used to reduce evaporation, it may or may not allow rainfall to
enter, and therefore either reduces the total evaporation from the storage, or the net
of the technique at reducing evaporation. For example, if a technique has an effectiveness of
20%, this means that it has the potential to save 20% of the total evaporation, therefore
reducing the evaporation to 80% of its original value.
2.4.1 Shading Materials
Shading materials reduce evaporation from the water surface by reducing the temperature
and wind speed over the water surface.
Generally a framework is required to support the shading material above the water
surface. The cost of the framework and shading material can make this method cost
prohibitive for larger dams or irrigation channels.
Mesh shade covers allow the rainfall to enter, reducing total evaporation. Table 2.2
details the potential effectiveness of different shading materials in reducing evaporation.
Table 2.2 Shading materials
Shading Materials - Evaporation Reduction Effectiveness
Shading material Effectiveness (%)
Experiment Scale
Experiment Location
WPE (white polyethylene mesh) 1 54.7 Class-A pans Southern Spain 2WPE (double layered white polyethylene
mesh) 1
68.5 Class-A pans Southern Spain
BPE (black polyethylene mesh) 1 75.1 Class-A pans Southern Spain 2BPE (double layered black polyethylene
mesh) 1
83.5 Class-A pans Southern Spain
GPE (green polyethylene mesh) 1 76.2 Class-A pans Southern Spain BLPE (blue polyethylene mesh) 1 77.6 Class-A pans Southern Spain
ALU (aluminized net) 1 51.5 Class-A pans Southern Spain
Shadecloth2 70 Dam Southern
Queensland, Australia
1 Martinez Alvarez, et a., 2006
2 Craig, et al. 2007
2.4.2 Floating Covers & Objects
Floating covers and objects work by reducing the surface area exposed and reducing the
Floating covers are generally constructed from polyethylene or polypropylene and form
an effective and impermeable barrier against evaporation, being up to 100% effective (Watts,
2005). However, they generally do not allow rainfall penetration and depending on the
product, a support system may be required.
From an environmental perspective, floating covers prevent light entering the water,
therefore reducing algae growth and improving water quality (Craig, 2005), however, they
can have a harmful effect on aquatic life due to potential anaerobic conditions in the water,
and can cause a loss of habitat for birds and other life (GHD, 2003).
In addition, floating covers reduce wave action and therefore reduce bank erosion (Craig,
2005).
The potential effectiveness of floating covers at reducing net evaporation are summarised
in Table 2.3.
Table 2.3 Floating covers
Floating Covers - Evaporation Reduction Effectiveness
Product Name Effectiveness (%)
E-VapCap 90% + 1
REVOC Floating Cover 95% 2,3
Defined Sump Floating Cover 95% 2,3
Evap-Mat 90% 2,3
Fabtech 95% 2,3
VapourGuard 98% + 4
Aquaguard Evaporation Cover 90% 2,3
1 Evaporation Control Systems Pty Ltd, n.d.
2 NCEA Evaporation Control, n.d.
3 Craig, 2008
4 Plastipack Limited, n.d.
Floating objects consist of many individual floating units placed on the water surface which
may or may not be attached to each other. They are easier to install and allow for rainfall
penetration, however cannot achieve the same high level of effectiveness as floating covers.
Environmentally, floating objects are not as harmful as floating covers because some water
summarised in Table 2.4.
Table 2.4 Floating objects
Floating Objects - Evaporation Reduction Effectiveness
Product Name Effectiveness (%)
AquaCaps 85% average 1
70% when 80% water surface covered 2
AquaArmour 95% 3
89% 4
Agfloats 80% 5
Raftex (Devised design) 95% + 6
Euro-matic Bird Balls / Shade Balls 90% 4,7
HexDome TM 90% 4,7
Hexa-Cover 95% 8
QUIT Evap Modular Floating Cover 85-90% 4,7
1 Polarity, 2008 5 Reclaim Industries Ltd, n.d
2 Weekly Times Now, 2009 6 F Cubed (Australia) Pty Ltd, n.d.
3 Water Innovations, n.d. 7 Craig, 2008
4 NCEA Evaporation Control, n.d. 8 Hexa-Cover Aps, n.d.
2.4.3 Polyacrylamide
Polyacrylamide (PAM) is a product mixed into the water which increases the viscosity
(thickens the water), thereby making it less susceptible to evaporation. Average evaporation
saved at trials in Queensland was 37% (Craig, et al. 2005). PAM can potentially give rise to
toxic breakdown products.
2.4.4 Chemical Covers - Monolayers
Monolayers consist of a one molecule thick film of a water-insoluble organic compound
spread across the water surface. Each molecule consists of hydrophobic (water-hating) and
hydrophilic (water-loving) parts. At low surface concentrations of the monolayer material,
the distance between molecules is large and their interaction weak. At higher surface
concentrations, ie, when the molecules are pushed together by a sideways force or surface
pressure, they pack together with the hydrophilic head anchored in the water and the
hydrophobic tail pointing into the air away from the water surface. Figure 2.1 shows the
condensed phase significantly impedes the movement of water vapour molecules from the
surface thereby reducing evaporation.
Figure 2.1 Packing of Monolayer Molecules at Different Concentrations
Monolayers reduce evaporation by restricting the free passage of water molecules
through the air water interface. Referring to Figure 2.2, there are a number of layers within
the water and air, below and above the water surface, which all play a role in determining the
magnitude of water vapour transport (evaporation).
Figure 2.2 Physical Transport Processes at an Open Water Surface, at both macro-scale (left) and micro-macro-scale (right) (Reproduced from Hancock, et al. 2011)
Water Water
Air
Loosely packed molecules - ‘Diffuse’ phase
transporting water vapour. If the thickness of the diffusion sub-layer is increased then its
ability to transport the water vapour is further decreased. It is suggested that monolayers are
also capable of increasing the thickness of the diffusion sub-layer (and therefore further
reducing evaporation) in a number of ways, including by calming the small-scale
(sub-millimetre) capillary waves on the water surface.
However, the thickness of the diffusion sub-layer is greatly affected by diurnal variation,
in particular the relative temperatures between the sub-surface water, the water surface and
the air above (Gladyshev, 2002). Therefore if the diffusion sub-layer is already relatively
thick and suppressing evaporation, the addition of a monolayer will not produce any
noticeable reduction in evaporation rate. The rate of evaporation is also affected by climatic
conditions, therefore during high humidity when the air is already moisture laden, there is no
benefit achieved from applying a monolayer to the water surface. Both factors can greatly
affect the evaporation suppression ability of a monolayer during a trial and contribute to
varying results from repeated trials.
In addition, it has been found that monolayers are only capable of reducing the water
molecule movement when they are exerting a surface pressure of 15mN/m or greater
(Hancock, et al. 2011). The pressure (and surface concentration) increase as more material is
added because it is confined by the banks of the water body. Further detail on the processes
impacting on the way in which monolayers reduce evaporation has been reviewed by
Hancock, et al. (2011).
Under suitable weather conditions (light winds and good sunlight) it is possible to
visually see the presence of a monolayer due to its ability to dampen capillary waves (Lange
& Huhnerfuss, 1977).
Monolayers have been investigated since the 1960s, however they were not adopted in
any scale at that time or subsequently. Lack of adoption may have been due to the many
difficulties experienced in the use of monolayers including: application difficulties, wind
displacement and rapid bacterial/microbial degradation. Essentially, monolayers were not
performing in the field as they did in the laboratory. Commonly available monolayer
compounds degrade very quickly in the environment and require continuous or repeated
applications to be effective. In addition, tests to date report widely varying results of the
effectiveness of monolayers (up to 50% in the field) and have generally been conducted on a
very small scale. The considerable literature relating to the use of monolayers for
In comparison with other evaporation-mitigation strategies, such as physical covers,
monolayers have the benefit of being able to be applied only when required during periods of
high evaporation (and when wind speed is not too high) or when water resources are scarce.
Under these circumstances they are potentially cost-effective as a water saving strategy
(Brink, 2011).
Unfortunately, given the complexities of monolayer science and difficulties associated
with experimental trials (Hancock et al. 2011), it is not yet possible to estimate the potential
maximum degree of control provided by the different monolayer chemicals.
2.4.5 Biological Covers
Some plants such as duck weed and water lilies can form a cover over the water surface and
help reduce evaporation. However, the potential savings from plant covers are low and there
may be associated impacts including a reduction of light and dissolved oxygen, and a
restriction to channel flow. Additionally, there is potential for the plants to spread into other
waterways which may result in environmental harm.
Reported evaporation savings from biological covers are summarised in Table 2.5.
Table 2.5 Biological covers
Biological Covers - Evaporation Reduction Effectiveness
Name Effectiveness (%)
Duckweed 9%1, 10%2, 11%3, 33%4
Mexican water lily Not available
1 Community Education and Extension Support Unit and Rural Water Use Efficiency Initiative
Department of Natural Resources and Mines, Queensland 2002
2 National Program for Sustainable Irrigation 2005
3 Seidl, et al. n.d.
4 Skillicorn, Spira & Journey, n.d.
2.4.6 Unusual Methods Employed in Other Countries
During 2006 and 2007, a creeper was grown on a frame to shade an on-farm reservoir in
India in order to model the evaporative savings achieved by a biological cover. A saving of
50% was achieved when compared to an on-farm storage without shading (Sahoo, et al.
in Saudia Arabia. A savings of 63% was achieved for a pool fully covered and 26% for a
pool half covered (Al-Hassoun, et al. 2009).
2.4.7 Design Features
The water body may be designed and built to limit potential evaporation by increasing depth,
reducing surface area, incorporating high banks to form wind breaks and planting tree belts
to form windbreaks. These solutions can be difficult and costly to incorporate into an
existing water body, and assessment of the effectiveness is difficult.
2.4.8 Pipelines
Pipelines provide a permanent means of saving evaporative losses, however generally come
at a high capital cost and are only practical for smaller channels with flows less than say
30 ML/day. Pre NVIRP modernisation this represents approximately 25% of the channel
network length, however after modernisation it represents only 3%.
2.5 Potential Costs associated with Water Savings
Table 2.6 details the cost per megalitre of water savings of systems addressing evaporation
losses from dams as reported in the literature (for those systems where the cost and
efficiency data is available). Note: only capital costs have been allowed for.
Table 2.6 Dam evaporation mitigation systems
Method Potential
evaporation savings
Installation Cost / m2
Cost / ML saved (NPV @ 6% over 30 years – capital only)
Product Life
Floating Covers
E-VapCap 90% $73 $390 12 years4
REVOC 95% $304 $1,060 30 years4
Defined Sump 95% $303 $1,110 25 years3
Evap-Mat 90% $3.503 $130 30 years 3
Fabtech 95% $73 (excludes
earthworks)
$340 15 years3
Floating Objects
AquaCaps 85% $174 $750 20 years
Agfloats 80% $105 $440 25 years5
Raftex 95% ~$4.503 $470 5 years3
HexDome TM 90% ~$6.503 $260 25 years3
QUIT Evap Cover 87.5% $73 $490 ~9 years3
Method Potential evaporation savings
Installation Cost / m2
Cost / ML saved (NPV @ 6% over 30 years – capital only)
Product Life
Shade cloth 70% $7 - $101 $410 30 years2
Chemical monolayer 5% - 30% $0.00 - $0.381 $130 - $12001 1 Craig, Green, Scobie, and Schmidt, 2005
2 National Program for Sustainable Irrigation, 2005
3 NCEA Evaporation Control, n.d.
4 Craig, 2008
5 Reclaim Industries Ltd, n.d
2.6 Monolayer Chemicals
The requirement of this thesis and the concurrent G-MW field research was to investigate
monolayers as they relate to irrigation channels.
Currently within Australia there are two commercially available evaporation suppressing
chemicals, WaterSavr™ and Aquatain. WaterSavr™ is a true monolayer, while Aquatain is
more like an oil slick and is many molecules thick. A comparison of the properties of the two
products was presented by McJannet, et al. (2008). No negative environmental impacts of
either product have been reported to date.
The Cooperative Research Centre for Polymers (CRC Polymers) is investigating new
monolayer compounds that can overcome some of the issues that have been experienced
with monolayers in the past. In addition, G-MW has investigated polymer compounds to
enable field comparison with the commercially available products and CRC Polymer’s new
product, ES300.
2.6.1 WaterSavr™
WaterSavr™ consists of cetyl and stearyl alcohols mixed with hydrated lime. The
manufacturer states potential evaporation savings of up to 30% are achievable. Application
of the powder is by use of commercially available application units. Correct application to
the water surface is considered essential for efficacy of the product. The manufacturer states
that the product is suitable for use on “slow moving” irrigation channels (Flexible Solutions
International Inc, n.d), however no literature of field trials is available to support the
statement. It has a field life of 2 to 3 days (Watts, 2005), although daily application is
Aquatain is a silicone based product with a re-application period of 10 days (McJannet, et al.
2008) and potential savings of 50% (Aquatain Products Pty Ltd, n.d(a)). It can be applied by
directly pouring onto the water surface or using a commercially available applicator.
Aquatain indicates that the silicon based product has no adverse environmental impacts,
specifically it does not affect the chemistry of the water, prevent the water from oxygenation,
harm aquatic life or adversely impact potable water (Aquatain Products Pty Ltd, n.d(b)).
2.6.3 ES300
CRC Polymers are working on the development of new monolayer products with greater life
and better durability under wind conditions, however, no further information or test results
are available from CRC Polymers at this stage.
Goulburn Murray Water has been undertaking independent laboratory trials on ES300.
Preliminary results indicate an initial efficiency of between 60 – 70% in saving total
evaporation. Figure 2.3 shows the loss rate of water before and after the monolayer material
is added. Red points and blue points are duplicates. The loss rate, given by the gradient, has
reduced following the application of monolayer material. The tests were concurrent
duplicates undertaken on 100mm petrie dishes and were repeated to ensure consistency.
Figure 2.3 ES300 laboratory tests conducted by G-MW (Albrecht, 2011)
0.5 0.6 0.7 0.8 0.9 1.0 1.1 1.2
0:00 0:10 0:20 0:30 0:40 0:50 1:00 1:10 1:20 1:30 1:40 1:50 2:00 2:10 2:20
D
e
p
th
(
m
m
)
Elapsed time (hh:mm)
Depth vs time without / with ES300 emulsion
Depth (mm) Duplicate depth
Add ES300 emulsion at 1:31 hr There is usually a sudden increase in water level when monolayer is applied. Layer takes10 min. to form. Fan on
3.27 mm/d 8.29 mm/d
7.56 mm/d
Further testing is required to determine the initial and final efficiency and field life of ES300
2.6.4 Emulsions of Cetyl and Stearyl Alcohols
Monolayer materials exist as solids and can be applied to the water surface in a number of
ways:
• in solid form such as a powder or flakes;
• mixed with a solvent such as petrol or ethanol;
• mixed with a carrier such as lime; or
• as a slurry with water.
There are a number of disadvantages associated with each of these methods including:
distributing the material uniformly, clumping of the material and potential environmental
issues associated with the solvents or carrier materials (Winter, 2011).
To avoid these issues, G-MW investigated a liquid form of monolayer material (an
emulsion) that could be applied automatically and at a controlled rate using a peristaltic
(dosing) pump. Michael Herzig (University of Southern Queensland) also developed
emulsion monolayers, but using Brij 78 as the emulsifying agent (Michael Herzig, pers.
comm.) which is considered to be cost prohibitive. Therefore G-MW investigated emulsions
using sodium sterate (soap) as the emulsifier.
Emulsions of the two alcohols (cetyl and stearyl), either separately or mixed, are easily
formed using soap as the emulsifying agent and contain no toxic components. A summary of
the formulations developed by G-MW are detailed in Table 2.7 (Albrecht, 2011).
Table 2.7 Emulsions (Albrecht, 2011)
Emulsions developed in G-MW Laboratory
Cetyl Alcohol quantity (g)
Stearyl Alcohol quantity (g)
Emulsifier Type and quantity (g)
Laboratory Effectiveness (%)
Field
Effectiveness (%)
- 10 0.5 soap -
- 10 0.25 soap (pre
dissolved)
-
- 10 0.25 soap 66%
5 5 0.25 soap 69% Up to 34% achieved1
1 Result obtained in one short field trial.
2.7 Australian Monolayer Field Trials
Most recent Australian monolayer trials undertaken in the field have used WaterSavr™.
Coliban water has been trialling the use of WaterSavr™ since approximately 2006. It has
been used on Barkers Creek, Cockatoo, Caledonia, Korong Vale, Raywood and Wychitella
reservoirs and storages. Coliban’s 2007 annual report indicates it is difficult to determine the
amount of water saved from the trials (Coliban Regional Water Corporation, 2007), although
Flexible Solutions indicate an average savings of 29% was achieved at Korong Vale
reservoir during 2006 (Flexible Solutions International Inc, 2006).
Other trials of WaterSavr™ include:
• Byrock, NSW (Trialled 2006, still being used 2007)
• Dirranbandi Qld (Cubby Station) and Peak Downs Shire Council, Capella, Central
Highlands, Qld
No reference to large scale trials in Australia for other monolayer products has been found.
2.8 Issues in the use of Monolayers
2.8.1 Monolayer Effectiveness in the Laboratory
The literature generally reports that monolayers are effective at suppressing evaporation
within laboratory situations. Following are examples of high efficiencies reported in the
literature:
• O’Brien, et al. (1976) achieved a maximum savings of 59% by ultra high purity
stearyl alcohol;
• Gugliotta, et al. (2005) achieved savings of up to 57% for mixed films of cetyl and stearyl alcohols applied to “natural” water samples;
• Goulburn-Murray Water laboratory tests on emulsions of cetyl and stearyl Alcohols
achieved up to 69% (Albrecht, 2011).
2.8.2 Monolayer Effectiveness in the Field
The effectiveness of monolayers in field situations varies widely. Gugliotta, et al. (2005)
reported that the first field trials were conducted in Australia during the 1950s and achieved
savings of 30%, while Craig, et al. (2007) reported that savings of up to 50% were achieved
in the field in the 1950s and 60s. Walter (1963) reported a much lower figure of 20% savings
achieved using a cetyl/stearyl mixture on a lake in Madras. Fitzgerald & Vines (1963)
reported savings due to cetyl alcohol of 40% or greater for wind ≤ 8 km/hr, 10-20% for wind
between 8 and 16 km/hr and approaching 0% for wind greater than 24 km/hr.
In static trials undertaken by G-MW on a trial irrigation channel, savings of between
10% and 30% were achieved using WaterSavr™ and ES300. However the tests were
conducted over a short time frame which makes measurement of savings very difficult in a
channel situation where wind can cause water level changes greater than the potential
evaporation.
Orica have achieved an efficiency of 60% for ES300 in recent field trials under “ideal”
conditions (Craig Clarke, pers. comm.).
Reasons for the variation in field trial results have been offered by Hancock, et al. (2011)
based on the analysis of field trials undertaken during 2008. One of the requirements of the
evaporative process is unsaturated air (low relative humidity) above the water surface. High
humidity impedes the evaporation process on unprotected water and adding monolayer to the
water surface does not produce any noticeable change in the already low evaporation rate.
The analysis and comparison of field effectiveness must take into consideration
measurements of air and water temperatures at the water surface.
2.8.3 Biological Considerations
In the field, monolayers are degraded by bacterial/microbial action. Essentially they form a
food source for various aquatic species. Research is being undertaken to develop monolayer
products that are resilient to microbial degradation (Craig, et al. 2007, Pittaway & Ancker,
2010). In addition, characterisation of the water body will help to inform the appropriate
monolayer product to use in order to limit the extent of microbial degradation (Brink, et al.
adverse environmental impacts and does not harm aquatic life, however no literature has
been found to determine whether it will be utilised as a food source by aquatic species.
2.8.4 Longevity in the Field
It has been found that most monolayer products generally have a maximum field life of 2
days (Craig, et al. 2007) and Gugliotta, et al. (2005) recommended an application interval of
two days. Flexible Solutions indicate that their WaterSavr™ product degrades in two to three
days (Flexible Solutions International Inc, n.d), although McJannet, et al. (2008)
recommended daily application. The implication of the short field life of monolayer products
is the requirement to reapply regularly which has the effect of increasing the cost of the
treatment.
Aquatain is recommended to be applied to the water surface every 10 days (Aquatain
Products Pty Ltd, n.d(a)).
2.8.5 Environmental Impacts
Studies to date indicate no adverse environmental effects associated with monolayers.
Pittaway & Ancker (2010) tested the impact of monolayer products and a silicon oil film
on biological oxygen demand, surface tension and pH and reported that “further study is
required to determine whether including hydrated lime in the monolayer formulation or the
oxygen scavenging properties of the silicone oil adversely affects aquatic organisms active at
the air/water interface”.
Previous studies undertaken on a mixed cetyl / stearyl monolayer indicated that “No
significant water temperature, pH, hardness or alkalinity changes occurred in the
experimental systems” (Wixon, 1966).
2.8.6 Human Health Impacts
Studies to date indicate no adverse human health impacts associated with monolayers.
• Dodecanol is a food grade surfactant (Hightower & Brown, 2004), Cetyl alcohol and
stearyl alcohol are used in many cosmetics and skin product applications.
• Aquatain (n.d.(a)) reports that their product is safe and indicates that “silicones are used in hundreds of applications including water-repellent sealers, hair conditioners
and lipsticks. They are also used to reduce foam in commercial food applications
• McJannet, et al
monolayer study
(including by-products
aerial spraying is to be used for application, the implications of the drift of chemicals
onto people, vegetation, fauna etc. needs to be assessed.”
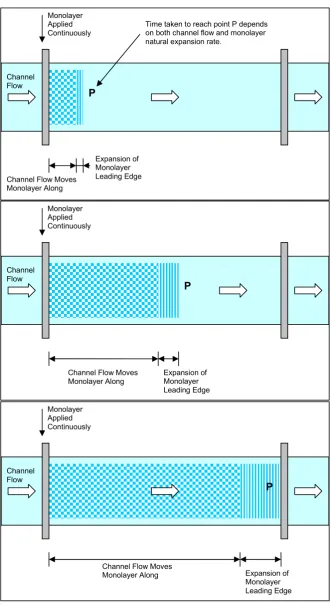
2.8.7 Monolayer Natural Expansion Rate
Vines (1962) gave the rate of expansion of a monolayer of cetyl alcohol when wind speed
was zero as 0.03 – 0.05
under varying wind speeds to the zero wind speed condition. He determined that the critical
wind speed that would limit monolayer expansion and result in drift
3.2km/hr which appears to be independent of temperature.
Figure 2.4 Monolayer drift vs wind speed (adapted from
Brink (2010) undertook laboratory tests to determine the spreadi
the water surface. The results show that the expansion rate is not constant with time
shown in Figure 2.5 and
time scale shown. Wind speed = 0 km/hr Drift rate = ~ 0.1 km/hr
McJannet, et al. (2008) reported the following when discussing areas of further
monolayer study: “A better understanding of possible health impacts of the product
products) is needed. Long-term risks of exposure need investigation. If
aerial spraying is to be used for application, the implications of the drift of chemicals
vegetation, fauna etc. needs to be assessed.”
Monolayer Natural Expansion Rate
gave the rate of expansion of a monolayer of cetyl alcohol when wind speed
0.05 m/s (0.05 – 0.1 km/hr), based on extrapolating monolayer drifts
under varying wind speeds to the zero wind speed condition. He determined that the critical
wind speed that would limit monolayer expansion and result in drift of the monolayer was
3.2km/hr which appears to be independent of temperature. Refer to Figure
Monolayer drift vs wind speed (adapted from Vines, 1962
undertook laboratory tests to determine the spreading rate of stearyl alcohol on
the water surface. The results show that the expansion rate is not constant with time
and Figure 2.6. Note: the only difference between the two graphs Drift rate = 0 km/hr
Wind speed = ~3.2 km/hr
reported the following when discussing areas of further
better understanding of possible health impacts of the product
term risks of exposure need investigation. If
aerial spraying is to be used for application, the implications of the drift of chemicals
gave the rate of expansion of a monolayer of cetyl alcohol when wind speed
, based on extrapolating monolayer drifts rates
under varying wind speeds to the zero wind speed condition. He determined that the critical
of the monolayer was
Figure 2.4.
1962)
ng rate of stearyl alcohol on
the water surface. The results show that the expansion rate is not constant with time as
Figure 2.5 Monolayer velocity vs time (Brink, 2010)
1 The legend item X1 refers to the application of product quantity appropriate to the container size,
while X3 and X6 are 3 and 6 times the product quantity of X1
Figure 2.6 Monolayer velocity vs time (Brink, 2010)
1 All test results (regardless of quantity of product applied) have been combined 0
0.02 0.04 0.06 0.08 0.1 0.12 0.14 0.16
0 10 20 30 40 50 60
S
p
re
a
d
in
g
V
e
lo
ci
ty
(
m
/
s)
Time (seconds)
x1 x3 x6
0 0.02 0.04 0.06 0.08 0.1 0.12 0.14 0.16
0 500 1000 1500 2000 2500 3000 3500 4000
S
p
re
a
d
in
g
V
e
lo
ci
ty
(
m
/
s)
Time (seconds)
Spreading Velocity
Test Results Trend Line
v = 0.14 t-0.26
From these tests, the monolayer expansion rate can be described by the equation:
0.14 . (2.1)
where v is the velocity of the monolayer front at a time t seconds after application.
At a time of 2000-3000 seconds the expansion rate has levelled out after the initial high
expansion period and tends to 0.02 m/s which is of the same order of magnitude as the
theoretical value given by Vines (1962). Although Brink (2010) obtained this result by
applying monolayer to the centre of a large trough such that the monolayer could expand in
all directions, if we consider a field application where the monolayer may or may not be
confined by banks, it is assumed that confining the monolayer does not increase the
expansion rate in the unconfined direction.
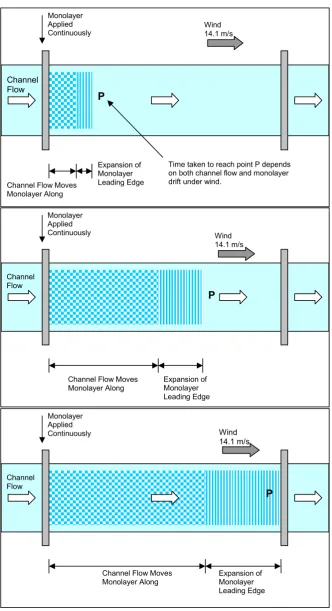
2.8.8 Wind & Waves
Wind affects monolayers in two ways, firstly by causing the monolayer to drift and
potentially exposing areas of water surface that are not protected by monolayer and secondly
by causing waves that “break up” the monolayer and cause heterogeneities within its surface.
Walter (1963) reported the results of applying a monolayer of cetyl/stearyl alcohol on a
lake of approximately 12 hectares in Madras, with applicators located on shore and mounted
on a boat. The lake’s surface was observed to be completely covered by monolayer at a wind
speed of 1.9 km/hr but was only half covered at a wind speed of 4 km/hr.
Crow & Sattler (1958) reported that an “Inverse relationship exists between the portion
of reservoir covered by film and wind velocity” (Manges & Crow, 1965).
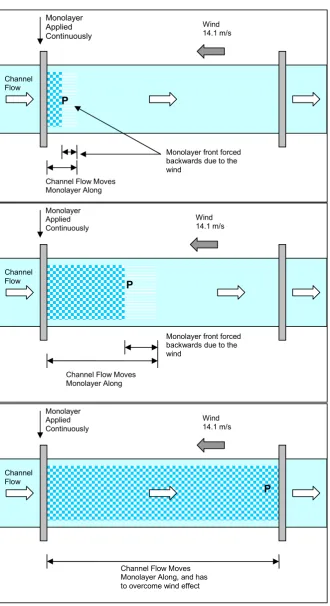
Vines (1962) determined that the critical wind speed that would limit monolayer
expansion and result in drift of the monolayer was 3.2 km/hr. For wind speeds between 0 and
3.2 km/hr, the monolayer is capable of expansion to a varying degree. Refer to Figure 2.4.
Crow (1963) reported that the limiting speed to applying monolayer was 24.2 km/hr:
“Applying hexadecanol [Cetyl alcohol] as a slurry from a boat they concluded that it
appeared to be impractical to attempt to maintain any appreciable coverage when winds
exceeded 15mph”.
For wind speeds between 3.2 and 25 km/hr the monolayer is moved across the water
surface. It is generally agreed that the rate of monolayer movement is approximately 3% of
which the wind velocity exceeded 3.2km/hr
• Lange & Huhnerfuss (1977):
o Lies between 2.6-5.5%
o Laboratory studies 3.5 ± 0.7%
o Field studies 4.4 ± 0.9%
• Fitzgerald & Vines (1963) gave the ratios ws / w = 0.03 for clean water and 0.045
for a fully damped surface (wind > 19.8 km/hr), where ws = the water surface speed
and w = the wind speed.
Brink (2010) tested wind speeds in the range 13.3 km/hr to 29.9 km/hr, the results of which
are shown in Figure 2.7 plotted in the same format as the results of Vines (1962).
Figure 2.7 Monolayer velocity vs wind velocity (Brink, 2010)
1 Monolayer drift velocity was measured by the movement of polystyrene balls applied to the water
surface
For wind speeds greater than 0 m/s the monolayer movement is given as 0.04 x wind speed –
0.04 which is in the same order as 3% of the wind speed published by previous researchers. y = 0.04x - 0.04
R² = 0.95
y = 0.03x + 0.00 R² = 0.99
0 0.05 0.1 0.15 0.2 0.25 0.3 0.35
0 1 2 3 4 5 6 7 8 9
M
o
n
o
la
y
e
r
D
ri
ft
V
e
lo
ci
ty
(
m
/
s)
Wind Velocity (m/s)
Monolayer velocity as a function of wind velocity
Within the model, a rate of monolayer expansion of 3% of the wind speed has been
adopted for wind speeds greater than 3.2 km/hr, being the generally agreed value based on
past research.
2.8.9 Turbulence
As detailed in section 2.8.8, turbulence caused by waves has the effect of breaking up the
monolayer, in some instances to the point that it cannot reform. Therefore, it would follow
that any equivalent turbulence, however caused, would have the same effect. Irrigation
channels contain regulating structures which control the flow and level of the water within
the channel. These structures tend to cause turbulence for a number of metres downstream of
the structure. Rock beaching is placed downstream of the structure to limit the damage to the
earthen banks and bed. It is therefore hypothesised that the turbulence caused by regulating
structures is going to have the effect of damaging the monolayer integrity and effectiveness.
Studies undertaken in the USA into the use of monolayer to reduce evaporation and
therefore limit the amount of water available to hurricanes and reduce their resulting
strength, investigated the effect that the turbulent conditions caused by hurricanes would
have on the monolayer integrity. The tests were conducted within a laboratory and consisted
of measuring the surface pressure of the water with monolayer, before and after rapidly
dumping water upon the monolayer surface. The monolayer material chosen for use was
Hexadecanol [cetyl alcohol]. It was shown that the “monolayer could not reform itself after
being torn apart by water” (Hsin, 2002).
This has implications for the use of monolayers on irrigation channels where turbulent
conditions will be experienced at every regulating and offtake structure. In the worst instance
it may be necessary to reapply the monolayer material downstream of each regulator.
Goulburn Murray Water (Bruce Albrecht, pers. comm.) has been undertaking laboratory
testing of WaterSavr™ (cetyl and stearyl alcohols combined with lime). Preliminary results
indicate that shaking, to emulate the turbulence of going over a regulator structure, does not
inhibit its ability to reduce evaporation. Figure 2.8 shows the loss rate of water before and
after the monolayer material is added. Red points and blue points are duplicates. The
gradient of both sets of results has reduced following addition of WaterSavr™ indicating
reduction in the loss rate. Figure 2.9 gives the loss rate with shaken monolayer material. Red
points and blue points are duplicates. The loss rate, given by the gradient, in both instances is
less that the loss rate given in Figure 2.8 before monolayer material was added, indicating
Figure 2.8 WaterSavr™ laboratory tests conducted by G-MW (no shaking) (Albrecht, 2011)
Figure 2.9 WaterSavr™ laboratory tests conducted by G-MW (shaken) (Albrecht, 2011)
0.00 0.20 0.40 0.60 0.80 1.00 1.20 1.40 1.60
0:00 0:20 0:40 1:00 1:20 1:40 2:00 2:20 2:40
d
e
p
th
(
m
m
)
Elapsed time (hh:mm)
Depth (mm)
Duplicate depth (mm)
Add Watersavr 10.1 mm/d
8.8 mm/d
2.8 mm/d
5.5 mm/d
3.00 3.05 3.10 3.15 3.20 3.25 3.30 3.35 3.40
0:00 0:20 0:40 1:00 1:20 1:40 2:00 2:20
d
e
p
th
(
m
m
)
Elapsed time (hh:mm)
Depth vs time with Watersavr after shaking with water to simulate passing over a regulator
Depth (mm)
Duplicate depth (mm)
2.6 mm/d
Research to date indicates that WaterSavr™ is not resilient to turbulence caused by wind and
waves, and that cetyl alcohol alone is not resilient to the turbulence caused by dumping
water upon the surface of the monolayer (Hsin, 2002). The result of this shaking test for
WaterSavr™ which indicates continued evaporative resistance following shaking, conflicts
with current knowledge of the resilience of WaterSavr™. Further testing is required to
determine the validity of the results.
Tests have been undertaken by G-MW into the evaporative resistance of ES300.
Following shaking to emulate the turbulence of going over a regulator structure, the
efficiency appears to be 80 - 90% (in comparison to the loss rate of the unshaken ES300
which was 60 – 70%). This indicates that the monolayer has sufficient stability to withstand
turbulence in the field. This will greatly improve the cost effectiveness of the product as it
will not need to be reapplied at every regulating structure. Figure 2.10 shows the loss rate of
water before and after the shaken monolayer material is added. Red points and blue points
are duplicates. The loss rate, given by the gradient, has reduced following the application of
shaken monolayer.
Figure 2.10 ES300 laboratory tests conducted by G-MW (shaken) (Albrecht, 2011)
1.40 1.60 1.80 2.00 2.20 2.40
0:00 0:20 0:40 1:00 1:20 1:40 2:00 2:20 2:40 3:00 3:20 3:40 4:00 4:20 4:40 5:00
d
e
p
th
(
m
m
)
Elapsed time (hh:mm)
Depth vs time without/ with ES300 shaken in water
Depth (mm) Duplicate depth (mm)
8.5 mm/d
1.1 mm/d ES300 emulsion added
regulating structures, however further testing should be conducted to substantiate this result.
2.8.10 Obstructions to Monolayer Movement
Many structures are located along the length of irrigation channels. The structures perform
different functions including controlling the level and flow of the water (regulators and
offtakes), allowing access over the irrigation channel (bridges and culverts), allowing
farmers to use the water (irrigation outlets) and in some instances to take the irrigation water
under another water course such as a river, creek or natural depression (syphons). The
monolayer products applied to the irrigation channel will travel down the channel with the
channel flow and wind, and will be impacted by the different irrigation structures.
Clear span bridges do not impact the flow of water and will therefore not impact the
monolayer movement. Some monolayer may be lost to bridge piers although this will be
negligible compared to the weeds growing at the channel edges and in some instances within
the channel waterway.
Figure 2.11 Clear span bridges
Regulating structures generally consist of overshot flume gates and cause disturbance of the
water surface, which may impact the integrity of the monolayer.
Figure 2.12 Regulating structures
Offtake structures may be undershot or overshot, that is water may flow over them (as per a
regulating structure) or water may flow beneath a vertical lift gate.
Figure 2.13 Offtake structures
Structures with a submerged water way area such as pipe culverts, syphons and concrete
dome culverts are expected to cause the monolayer to “bank up” on the upstream headwall of
the structure, therefore preventing the progress of the monolayer down the channel. Goldacre
(1949) found that surface films on natural bodies of water were trapped at barriers such as
floating branches and were unable to pass beneath the obstacle. Measurements of surface
pressure indicated the natural layer was not present on the downstream side of the obstacle.
Monolayers exhibit many similar properties to natural surface films and it is therefore likely
they will also be unable to pass through a submerged pipe structure when the monolayer is
located on the water surface.
Figure 2.14 Pipe structures
Overshot Offtake Structure Undershot Offtake Structure