Research Report DFE-RR002
Tellus4
Evaluation
Graham Kelly
Nick Coleman
Mary Hickman
2
Tellus4 Evaluation
Graham Kelly
Nick Coleman
Mary Hickman
Word of Mouth
This research report was written before the new UK Government took office on
11 May 2010. As a result the content may not reflect current Government policy
and may make reference to the Department for Children, Schools and Families
(DCSF) which has now been replaced by the Department for Education (DFE).
3 Contents
Acknowledgements ... 5
Executive summary ... 6
1 Introduction ... 11
1.1 Background on Tellus4 survey ... 11
1.2 Objectives of the evaluation ... 12
1.3 Research Methodology ... 13
1.4 Analysis and Interpretation ... 14
2 Overall satisfaction with Tellus4 ... 15
2.1 Participating schools ... 15
2.2 Local authorities ... 16
2.3 Pupils ... 17
2.4 Summary ... 18
3 Participation in Tellus4 ... 19
3.1 Local authority participation ... 19
3.2 Local authority views on sampling and selection ... 19
3.3 Schools‟ decision to take part ... 20
3.4 Consultation on participation between local authorities and schools ... 20
3.5 Reasons for schools‟ participation and perceived benefits ... 21
3.6 Reasons for schools‟ non-participation and perceived disadvantages ... 22
3.7 Local authority views on schools‟ non-participation ... 24
3.8 Sharing views on Tellus4 ... 24
3.9 Factors influencing future participation ... 25
3.10 Summary ... 25
4 Communication and support ... 27
4.1 NFER support ... 27
4.2 Stakeholder consultation workshops ... 28
4.3 Use of management information tool by local authorities ... 28
4.4 Summary ... 29
5 Survey timing and pupil coverage ... 30
5.1 Survey timing ... 30
5.2 Inclusion of whole years ... 31
5.3 Summary ... 31
6 Delivery models used in schools ... 33
6.1 Staff responsibilities in schools and local authorities ... 33
6.2 Mode of completion of the survey ... 34
6.3 Pupil briefing ... 34
6.4 Integration into curriculum subjects ... 34
6.5 Use of new guidance materials and curriculum materials ... 36
6.6 Summary ... 36
7 Survey set up, administration and supporting material ... 37
7.1 Overall level of burden ... 37
7.2 Survey set up and administration ... 38
7.3 Information technology (IT) support ... 38
7.4 Use of support materials ... 39
7.5 Parental and pupil consent ... 40
7.6 Confidentiality of participating pupils ... 40
4
8 Survey questionnaire ... 43
8.1 Relevance of the questionnaire ... 43
8.2 Pupils‟ understanding of the purpose of the survey ... 43
8.3 Suitability of questionnaire topics to different ages, abilities and needs ... 44
8.4 Feedback on questionnaire format ... 44
8.5 Comments on individual questions ... 46
8.6 Pupils‟ views on the survey questions ... 46
8.7 Personalising the Tellus4 questionnaire ... 49
8.8 Topics suggested for inclusion in future Tellus surveys ... 49
8.8 Summary ... 50
9 SEND versions ... 51
9.1 Awareness and use ... 51
9.2 Impact of SEND formats in enabling participation ... 52
9.3 Keeping the survey open for longer ... 53
9.4 Summary ... 53
10 Feedback on survey results and analysis ... 54
10.1 Importance of feedback and analysis ... 54
10.2 Use of the survey results... 54
10.3 Interpretation of results ... 55
10.4 Timing of feedback... 55
10.5 Format of results ... 56
10.6 Summary ... 57
11 Conclusions and Recommendations for future Tellus surveys ... 58
12 References ... 62
5
Acknowledgements
The authors would like to express their gratitude to the members of the research team at DCSF for their support during this evaluation: Alison Thompson, Prity Sharma and Michael Dale. In addition, we would like to thank Fiona Walker and colleagues at NFER for their input at the development stage of the evaluation.
The research team would like to express their sincere thanks to all of the children and young people, teachers, and staff from local authorities who helped us by taking part in the
6
Executive summary
Background
The Tellus survey was originally developed by Ofsted, with support from the Department for Children, Schools and Families (DCSF), but full responsibility transferred to DCSF in 2009, with Tellus4. DCSF commissioned the National Foundation for Educational Research (NFER) to administer Tellus4 and Tellus5. A number of important changes were introduced to the design and delivery of Tellus4 to increase participation in, and support for, the survey by local authorities, schools and pupils. The changes made included:
A dedicated Tellus website www.tellussurvey.org.uk
Changing the survey live period from the summer to autumn term
Improved access for disabled children and young people and children and young people with special educational needs (SEN)
Giving local authorities and schools the option to add questions to personalise the survey to support their own priorities and self-evaluation
The provision of materials so schools could deliver Tellus as part of the citizenship curriculum
Providing schools with feedback about their own findings for the first time
Giving local authorities and schools access to a web-based analytical tool to help with their analysis of their own data.
These and other changes to the management and delivery of Tellus4 brought about a considerable increase in participation. Over 250,000 pupils took part in Tellus4, an increase of around 100,000 from Tellus3. In addition, 5,322 pupils used the new alternative formats, and many of these children would not have been able to participate without such provision.
Tellus4 Evaluation and its objectives
This evaluation was undertaken as a small-scale, targeted piece of work aimed at providing insight into the delivery of the survey, rather than being a large, comprehensive evaluation examining all aspects of the survey.
Word of Mouth was commissioned by DCSF to evaluate the improvements made to Tellus4, and enhance understanding of the local authority and school experience of the Tellus4 survey.
The key objectives of this evaluation were to:
assess the overall satisfaction level of local authorities, schools and children and young people with the survey and identify key lessons learnt including areas of best practice.
evaluate the effectiveness of the supporting material and guidance provided in supporting a consistent mode of delivery in class.
7
Research Methodology
In order to address the above objectives, Word of Mouth adopted a qualitative research approach, involving a mixture of school visits (incorporating both a face-to-face interview with the Tellus co-ordinator and a pupil group discussion within each school), telephone interviews with Tellus coordinators, and telephone interviews with local education authorities/Service Children's Education.
In total, interviews were conducted with 12 local authority/Service Children‟s Education link officers, 27 Tellus co-ordinators in participating schools, nine representatives from non-participating schools, and seven pupil discussion groups. Fieldwork was conducted in February-March 2010.
Main Findings
Overall satisfaction with Tellus4
Tellus co-ordinators in participating schools expressed high levels of satisfaction with the delivery of Tellus4, with no major problems reported. Local authority link officers were also very positive and felt that Tellus4 was a significant improvement on previous Tellus surveys.
It was difficult to assess overall satisfaction amongst pupils, as they generally had limited recall of the survey. Notwithstanding this caveat, most pupils had enjoyed taking part in the survey and many had found some of the questions “fun” to do. On the whole they had found it easy to complete, but a mixture of views were expressed on confidentiality.
Participation
The headteacher was generally the main person in schools who decided whether to take part in Tellus4, either alone or in consultation with another senior teacher. The availability of school-level results and ability to allow the „pupil voice‟ to be heard were the main reasons given for participation. The importance of the „pupil‟ voice was particularly strong in special schools and PRUs, who felt it was important that their pupils‟ views were considered alongside those from mainstream schools.
Some local authorities spoken to, played an important role in encouraging schools to take part, suggesting that, even with the prominent role played by NFER, the local authority can be an important influence on schools‟ participation.
The main reasons given by non-participating schools for not conducting the survey mostly related to lack of time, the staffing and resource implications, and the perceived burden on teachers, with several schools commenting on the number of external surveys they are asked to complete.
8 Communication and support
Participating schools and local authorities were generally positive towards the
communication and support they had received from NFER. Local authorities also gave positive feedback on the stakeholder workshops, which they saw as an important part of the consultation process, and were impressed with the management information tool, which allowed them to monitor their schools‟ progress efficiently.
Survey timing
Both local authorities and schools were mostly positive towards the autumn timing. Local authorities saw it as an improvement, as it gave them the figures they needed towards the end of the financial year. Schools felt that autumn was a better time than the summer, as there were no exam commitments. However, the timing of the survey was an issue for PRUs, because they tend to have small numbers of pupils in the autumn term, thereby impacting on the quality of the data for their setting.
Inclusion of whole years
The evaluation found that, in general, smaller schools were more likely to include the whole year group, with larger schools citing logistical difficulties in allowing a large number of pupils to conduct the survey. Schools that did include the whole year group thought that this was fairer (as all pupils were allowed to have their say) or easier (as they did not need to decide which classes should be included). Some schools that did select classes said that they did not always follow the guidance provided to select which classes to participate.
Delivery models used in schools
With a very small number of exceptions, the survey was seen primarily as an administrative task. It was delivered in a way that was seen as most efficient and that fitted in best with practical constraints, such as whether ICT support was required by the class teacher or whether the level of ICT support/access in the school meant a whole class did the survey in one session or in stages with smaller groups.
In most cases, schools said they had a dedicated Tellus4 co-ordinator, but in some schools there was no clear co-ordinator role, and typically the headteacher or deputy head would delegate the administration of the survey to individual class teachers, sometimes shortly before the survey had to be conducted; this could impact on teachers‟ ability to incorporate curriculum materials and use the SEND versions.
Only a few of the schools interviewed integrated the survey into PHSE or Citizenship lessons, or planned lessons around the survey. These respondents found the materials “user-friendly”, useful and well designed. However, some respondents said they would consider using the materials in the future and could see a potential benefit of doing so.
Survey set-up and practical issues
9
Most respondents from participating schools used the Tellus school support pack, and found it useful and easy to use. A small number of respondents said that the hard copy of the support pack initially looked quite intimidating, as it contained a lot of information, while in some schools the hard copy materials were not always passed on to the relevant teacher(s) as part of the delegation process.
The majority of participating school respondents did not feel there were any issues of confidentiality for their pupils, but some doubted whether pupils understood that teachers wouldn‟t see the answers, and therefore felt that some pupils may not have been completely honest with their responses.
Several pupils felt that an on-line survey was more confidential than filling in a paper questionnaire, but others expressed concern over confidentiality; as a result they felt awkward when completing the survey or felt that they could not answer all the questions honestly. This was a particular issue for questions on alcohol and smoking.
Survey questionnaire
Local authorities were positive towards the survey questionnaire, on the basis that it gave them the data they needed for performance indicators, although there was the odd concern about questions being changed (affecting trends). Nearly all respondents in participating schools said that the questionnaire content was relevant to pupils and to the school as a whole. However, there were comments that some of the questions (e.g. on smoking and alcohol) were less appropriate for younger pupils, and this view was echoed by some of the pupils that were interviewed.
While some participating schools were happy with the design of the questionnaire, there were a number of comments about the questionnaire being too long or containing long questions. Some pupils (at both mainstream and special schools) confirmed that they sometimes needed help to understand what the questions meant, and to identify appropriate answers.
All local authorities interviewed in the evaluation had taken the option to add their own questions and most felt that this was an important feature. The participating schools included in the evaluation were split between those that added their own questions and those that didn‟t. Most schools who added their own questions said this was a useful and important feature, allowing them to reflect the school‟s own/current agenda. Where schools didn‟t add questions, this was usually because of time constraints or because it was
additional work. Some local authorities and schools who added two extra questions said they would have liked to have added more than two.
SEND versions
The SEND versions were generally less used in mainstream schools and in the PRUs interviewed, and there was no evidence of SEND versions being „tried out‟ by pupils who were able to access the questionnaire in the standard format.
10
The symbol version was seen as crucial to pupils‟ participation in one special school, and a couple of other special schools felt that it improved access to the survey for some pupils. However, some of the special schools included in the evaluation felt that their pupils had problems with cognitive capacity, and the SEND formats did not really address this issue. Most of the special schools gave pupils one-to-one support when they were completing the survey, irrespective of the version used.
Feedback of results and analysis
Most respondents at participating schools said that the school-level feedback was important to them, and in a couple of cases that this was crucial to their participation in Tellus4. Equally, in schools where pupil numbers were too small to allow school-level feedback, respondents were frustrated that they could not get any school-level analysis. Participating schools were most likely to say that the results would be used to provide input into planning documents, or to allow them to address current issues in the schools.
The majority of the local authority respondents said that they would use the analysis tool and one authority said they would encourage their schools to use it too. Most authorities found the idea of an analysis tool appealing but had not been able to test its usefulness.
11
1 Introduction
1.1 Background on Tellus4 survey
The Tellus survey is administered through a quantitative, on-line questionnaire, completed by children and young people in year 6 (aged 10-11), year 8 (aged 12-13) and year 10 (aged 14-15). Tellus is a particularly important survey for two reasons, namely:
It is the only annual survey across England covering all five „Every Child Matters‟ outcomes, namely Be Healthy; Stay Safe; Enjoy and Achieve; Make a Positive Contribution and Achieve Economic Well-being.
It has a very large sample size, being completed by 253,755 children and young people from 36991 schools at Tellus4. Contributing schools include not only mainstream primary and secondary schools, but also academies, special schools, pupil referral units (PRUs) and Service Children's Education (SCE) schools abroad.
Changes implemented for Tellus4
Tellus was originally developed by Ofsted, with support from the Department for Children, Schools and Families (DCSF), but full responsibility transferred to DCSF in 2009, with Tellus4. DCSF commissioned the National Foundation for Educational Research (NFER) to administer Tellus4 and Tellus5, with the specific remit of improving the survey quality by increasing participation among local authorities, schools and pupils, and improving survey accessibility for specific „hard to reach‟ groups.
A consultation was carried out with key stakeholders, and this led to the implementation of a number of important changes for Tellus4. The main changes were as follows:
The data collection period changed from summer to autumn term (October 5 to November 20 2009).
Selection of additional questions from a Question bank, to personalise the survey - local authorities and individual schools were each allowed to choose up to two additional questions, to supplement the core questionnaire.
PSHE and Citizenship curriculum materials were made available to support delivery of Tellus4 within these lessons, with the aim of developing children and young people's sense of empowerment.
Schools were provided with feedback on their own results, for the first time, allowing them to make comparisons against their local authority area and the national
benchmarks.
Local authorities and schools were given access to a web-based analysis tool to enable them to conduct their own analysis via a secure portal.
In order to make the survey more accessible for children and young people with special educational needs and disabilities (SEND), the questionnaire was translated into alternative formats, namely Audio, British Sign Language and Symbol/Widgit.
1
12
The Audio version was developed to be of assistance to children and young people with special educational needs and/or having English as an additional language.
A dedicated Tellus4 website was provided to support all aspects of the survey delivery.
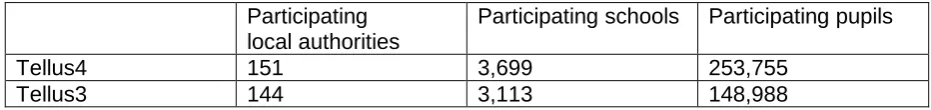
[image:12.595.64.530.226.281.2]These, and other changes to the management and delivery of Tellus, brought about a considerable increase in participation, which can be observed from a comparison of the last two surveys (as shown in table 1.1).
Table 1.1: Numbers participating in Tellus3 and Tellus4
Participating local authorities
Participating schools Participating pupils
Tellus4 151 3,699 253,755
Tellus3 144 3,113 148,988
From this table we can see that the number of participating pupils increased by 70%, the number of participating schools increased by 19%, and all but one of the local education authorities in England made a contribution to Tellus4. In addition to these improvements, 5,322 pupils used the new alternative formats, and many of these children would not have been able to participate without such provision.
Further details about the Tellus4 survey and the results can be found in the Tellus4 National Report (Chamberlain et al, 2010).
1.2 Objectives of the evaluation
The improvements made to Tellus4 survey represent a significant investment by DCSF, to improve the inclusiveness and data quality of the survey. In order to evaluate these developments, and enhance understanding of the local authority and school experience of Tellus4, DCSF commissioned Word of Mouth to conduct a qualitative study among local authority link staff, school staff responsible for survey delivery, and children and young people who completed the survey.
The Tellus4 evaluation was therefore undertaken as a small-scale, targeted piece of work aimed at providing insight into the delivery of the survey, rather than being a large,
comprehensive evaluation examining all aspects of the survey.
The evaluation had a number of overarching, strategic objectives, which were to:
assess the overall satisfaction level of local authorities, schools and children and young people with the survey and identify key lessons learnt, including areas of best practice.
evaluate the effectiveness of the supporting material and guidance provided in supporting a consistent mode of delivery in class.
establish how successful the improvements to increase the accessibility of the survey have been and in particular the use of the SEND versions in addressing the needs of children and young people with special needs.
13
1.3 Research Methodology
In order to address the objectives, Word of Mouth adopted a qualitative research approach, involving a mixture of school visits (incorporating both a face-to-face interview with the Tellus co-ordinator and a pupil group discussion within each school), telephone interviews with Tellus co-ordinators, and telephone interviews with local education authorities/Service Children's Education.
A sample was drawn from the Tellus4 database, stratified by region and type of school (i.e. primary, secondary, special, PRU, SCE). In order to achieve the target number of interviews within the relatively short fieldwork of 3-4 weeks, the sample had a ratio of five selected schools for every one interview required. Each selected school was sent an advance letter explaining the purpose of the study and requesting cooperation. Table 1.2 shows the number of interviews with each group.
Table 1.2: Number of interviews included in the Tellus4 evaluation
School visits: interview with Tellus coordinators 10
School visits: pupil discussion groups 7
Telephone school interviews: Tellus coordinators 26 Telephone interviews: local authority/SCE Link Officer 12
The school visits were undertaken with participating schools, to enable the interviews with the teacher/Tellus coordinator to be supplemented by discussion groups with children and young people who had completed the survey.
The pupil discussion groups covered the three year groups eligible for the survey (year 6, year 8 and year 10). A teacher was present in each of these discussion groups.
The sample design targeted mainly participating schools, but also included a number of non-participating schools, as we were keen to understand the reasons behind non-participation. Table 1.3 gives the breakdown of participating and non-participating schools, and Table 1.4 shows the types of school included in the evaluation.
Table 1.3: Number of interviews with schools
Participating Non-Participating School visits: interview with Tellus coordinators 10 n/a
Telephone school interviews: Tellus coordinators 17 9
Table 1.4: Types of schools included
Primary Secondary Special PRU SCE
Participating 5 10 6 4 2
Non-participating 3 2 1 2 1
14
Interviews with co-ordinators in participating schools typically lasted between 25-40 minutes. Interviews with non-participating schools and local authority personnel were much shorter, typically around 15-25 minutes. Pupil discussion groups lasted around 30 minutes. Topic guides used in these interviews can be found in the appendix of this report.
1.4 Analysis and Interpretation
Each interview was recorded (with respondents‟ permission). The interviewer used the recording and their own notes to summarise the findings from each interview. The findings were then itemised under emerging themes and topics. This provided the framework for the analysis.
As noted above, this report is based on a small-scale qualitative evaluation. The report indicates the strength of respondents‟ views, and indicates how common these views were across the sample (e.g. „very few‟ or „most‟ respondents held a certain opinion), but does not include percentages, as this is not appropriate for a qualitative evaluation.
It should also be noted that the nature of qualitative research can lead to an emphasis on negative feedback. The vast majority of respondents interviewed in this evaluation were positive towards the delivery of Tellus4, but the evaluation sought to identify where improvements could be made, with interviewers prompting respondents towards specific issues.
15
2 Overall satisfaction with Tellus4
This chapter looks at the overall satisfaction levels of local authorities, schools and pupils with the implementation and delivery of the survey. The purpose of this chapter is to highlight the key features of the survey and how these were perceived by schools, pupils and local authorities. These issues are then discussed in more detail in subsequent chapters.
2.1 Participating schools
Overall satisfaction
Almost all of the participating schools included in the evaluation were positive towards the implementation and delivery of Tellus4, and no major problems were reported. The main reasons given for satisfaction were that the survey was easy to set up and ran smoothly in their school.
“Very, very user friendly – I was definitely impressed with the whole package” (participating special school)
“Quite straightforward, quite a painless procedure ... the survey itself was quite easy to work through” (participating special school)
In some cases, participating schools based their satisfaction on the support they had received from NFER, and the quality of support materials. Some respondents appreciated the fact that the survey was quite short and easy to complete, while others liked the fact that it was an on-line survey, which was felt to engage pupils in the survey.
There were a couple of instances where the respondents expressed concern, either because of the perceived effort involved in administering the survey, or the fact that school-level results had not been received by the time of the evaluation. A few other schools (although generally positive) also commented on the lack of school-level results, and felt that any significant delay in the receipt of their data could potentially mar the positive impression they had of the survey‟s delivery. Some schools also experienced minor IT problems. All of these issues are discussed in more detail in the chapters that follow.
Comparison with previous Tellus surveys
The participating schools that were included in the evaluation showed an approximately even split between those participating in Tellus for the first time and those who had taken part previously - these schools had often taken part two or three times before. Most special schools were taking part for the first time, and none of the SCE schools had participated before (as Tellus4 was the first time SCE schools had been included).
Comparisons with previous Tellus surveys were generally favourable. One respondent described Tellus4 as:
“the best [Tellus] we‟ve ever done” (participating secondary school)
16
There were other schools who recalled Tellus4 as being very similar to previous Tellus surveys. Their experience of previous Tellus surveys allowed them to administer the survey efficiently without spending too much time on the support materials, but this may have meant that they missed some of the new features of Tellus4 (such as the availability of the SEND versions).
One or two respondents reported aspects of the Tellus4 that they felt were less successful than in previous years: difficulties in accessing the website, and the time taken to enter usernames and passwords.
Respondents from non-participating schools either said that their school had not participated before of, if they had done so, they had little or no recollection of their schools‟ previous experiences. As a result, there is no evidence from the evaluation that previous experiences of the survey had any impact on non-participation.
2.2 Local authorities
Overall, local authorities were very positive towards Tellus4, and felt that it had worked better than previous Tellus surveys.
“It got substantially better. It‟s an increasingly improving survey and when NFER took it over they improved it a bit more. It‟s on an upward curve as a survey” (local
authority)
“Regardless of the level of take-up it is very important that this sort of exercise - to get the views of young people - takes place, and this year the way it was constructed was better than it had been in the past. To engage people and ask the right sort of questions” (local authority)
One local authority respondent summed up the feelings about the survey expressed by the majority by saying:
“It was better planned, better run, better informed” (local authority)
In the majority of cases, local authorities had left most of the administration to NFER. In previous years they had managed this aspect of the survey themselves and they were happy with the outcome this year. They also recognised the decrease in administrative burden the new way of working had meant for them. One respondent summed up the feelings of many:
“One of the good things about Tellus is that it is very resource-light from our perspective” (local authority)
The data that local authorities received from the survey was a key aspect of the survey, in particular the data on the national indicators which was crucial for them. The majority also thought schools would find it useful, possibly for the first time, as it would enable them to compare pupil information locally. As one respondent said:
17
Respondents particularly liked the management portal, which gave them the opportunity to monitor progress and take-up by schools, without the administrative burden usually present when managing a process of this type. They still felt that they had an important role to play, however, in monitoring the participation and response levels of their schools. As one respondent said:
“You felt as though you were a partner in this, rather than someone who had to do it” (local authority)
There was an instance where a local authority respondent was disappointed with the outcomes of the survey for his authority. This was partly because they had worked quite closely and actively with their schools but, despite this, had not achieved a high response rate from their schools, many of whom had done the survey with only one class: “just to tick the boxes.” Because of this low response, the respondent felt the data would not be
representative of the pupils and schools in the authority as a whole.
However, such cases were very much the exception, although other respondents (while generally positive) felt there was scope to expand the survey to include more schools or more year groups, to make the results more robust (as discussed further in the next chapter).
Overall, local authorities felt that the delivery of the survey was much improved on previous years. The support provided to schools by NFER meant that authorities could take a less active role in the administration of the survey. However, this did mean that some local authority respondents had not had any feedback from their schools about how the survey had run, nor how relevant the schools felt the survey was for them.
2.3 Pupils
As noted in the introduction, most pupil groups had difficulty recalling the survey in any detail. However, the prompts and the „screen shots‟ used in the classroom sessions helped to refresh the pupils memories, enabling them to discuss their overall experiences of the survey.
Most pupils had enjoyed taking part in the survey and many had found some of the questions “fun” to do. A few pupils described the survey as “scary” or “boring”. On the whole they had found it easy to complete, although some pupils had found it a bit long or found the questions difficult.
Some of the pupils remembered the “funny password”, and also what they felt were personal questions (on religion or ethnicity) or sensitive questions (on alcohol, smoking and drugs). They were not always comfortable with these questions.
There were mixed views from pupils over confidentiality. Some thought that an on-line survey was more “anonymous” than a paper-based survey. However, other pupils were concerned about confidentiality, and felt it was difficult to be honest as teachers or other adults might see their answers.
18
2.4 Summary
Participating schools and local authorities included in the evaluation were mostly very positive towards the delivery of Tellus4. They felt the survey ran smoothly and did not experience any major problems. Many local authority link officers felt that Tellus4 was a significant improvement on previous Tellus surveys.
19
3 Participation in Tellus4
This chapter examines the reasons why schools did or did not participate in Tellus4, as well as the process schools went through in making a decision about their participation. The chapter also examines local authorities‟ views on their own participation as well as their schools‟.
3.1 Local authority participation
As noted in the Introduction, every local authority except one participated in Tellus4, to the extent that at least one school in each authority took part in the survey. However, local authorities do not „participate‟ in the survey directly, and because NFER took an active role in liaising with schools in Tellus4, this meant that there was little that local authorities had to do as part of the survey. At the same time, it was possible for local authorities to play a positive role in encouraging schools to take part (as discussed below), and to add their own questions; equally, local authorities could withdraw their schools from the survey2.
In most cases, the decision about the level of involvement the local authority would take in the survey was taken at director level, and in most cases followed a discussion between the respondent (who was the person responsible for managing the survey within the authority), their director and sometimes other colleagues in the authority.
All local authorities saw the data that they would obtain from Tellus4 as the main benefit of the survey, in particular because of the relevance of the survey to „Every Child Matters‟ outcomes.
3.2 Local authority views on sampling and selection
Most authorities were happy with the ability to be able to sample all of their secondary and up to 60 primary schools, and some had taken up this option. However, two of the authorities interviewed were too small for this option and, as a result, all their schools were invited to take part, which may have caused a problem for some:
“Because we are a small authority; then the same schools are in the sample every time. I think some schools are finding it an onerous process” (local authority)
One authority was very pleased that NFER had selected the sample because it meant that they could not be accused of „cherry-picking‟ schools for inclusion.
Some local authorities wanted participation to be extended to more of their schools or a larger number of pupils in each school. This stemmed from a desire for a larger sample size and a more complete or „representative‟ coverage of pupils in their authority. In fact, one authority had set a specific target to achieve a larger sample than they had achieved for Tellus3. There was also a recognition in some authorities that they needed to achieve a certain sample size to enable robust survey results and meaningful feedback for their authority. Only one local authority respondent was negative about the survey, and this
2
20
related to some extent to his views on the size of the sample, which was seen as too small and therefore: “it is statistically invalid... the survey is meaningless.” Another respondent, while generally positive about Tellus4, felt that the exclusion of independent schools meant that the sample in his authority was not fully representative.
Some local authorities would have liked a wider coverage in terms of the pupil groups selected, with a preference that all years be surveyed in secondary schools and at least years 5 and 6 in primary schools. One respondent felt that the current restriction was an issue, not only for the local authorities but also for their schools. This respondent highlighted the fact that year 6 pupils would soon be leaving the school so would see little benefit from their participation and said:
“An issue for schools is that it‟s only years 6, 8 and 10. For a primary school (year 6 only), it gives them only limited information. If they‟ve done a pupil survey of all the pupils in the school, they‟ll know what the issues are for the school and they can do something about it” (local authority)
3.3 Schools’ decision to take part
In the participating schools included in the evaluation, the headteacher was generally involved in the decision as to whether to take part in Tellus4, and in some schools s/he was the only person involved in the decision. Alternatively, the headteacher made a decision together with the deputy head or a senior teacher. In a minority of cases, the deputy head or a senior teacher made the decision rather than the headteacher. The senior leadership team (SLT) was involved in only a small number of cases, and where this was the case it was generally the SLT that actually made the decision as to whether to take part.
3.4 Consultation on participation between local authorities and schools
Based on the interviews with participating schools, two of the local authorities included in the sample appeared to have been particularly active in encouraging schools to take part. Local authority interviews confirmed that some authorities spent a lot of time contacting schools to encourage them to take part, and that increasing school numbers was a key priority for them in Tellus4.
“Being realistic, it needs someone in the local authority to dedicate time to phoning and chasing up the schools that don‟t come in on the first letter” (local authority)
21
Where authorities were active in encouraging schools to participate, this appears to have been central to schools‟ participation. According to some respondents in participating schools, this was because schools had not noticed the invitation letter, or if they had noticed it they had not managed to respond (i.e. the local authority served as a prompt or reminder to schools). A local authority respondent felt that schools could easily ignore
correspondence from NFER, as they tend to prioritise correspondence from
people/organisations that they know; therefore, the local authority‟s role in prompting schools was critical. In other cases, the local authority persuaded schools that they should take part, when otherwise they would not have done so.
“We got a letter from the local authority saying „it would be really good if you could do it‟, and following that I basically took it upon myself to do it. I took the hint it was compulsory to do it in a voluntary way!” (participating primary school)
“The local authority were very keen we took part and sent countless letters asking us to take part” (participating secondary school)
Overall, these findings suggest that, even with the prominent role played by NFER, the local authority can be an important influence on schools‟ participation. In fact one respondent from a non-participating school felt that his local authority should have played a more active role in the survey.
3.5 Reasons for schools’ participation and perceived benefits
There were two main reasons for participation given by schools. The first was that the survey allowed the „pupil voice‟ to be heard. This was a particularly strong factor for special schools and PRUs, who felt it was important that their pupils‟ views were considered
alongside those from mainstream schools.
“It's good that our children had some input. Because our children have learning difficulties they are so often forgotten and left out, so there's every reason for us to feed into a survey wherever we can” (participating special school)
“Often pupil referral units miss out in the loop, so if we get anything like this we like to contribute, so that it‟s not just a mainstream view that people are getting”
(participating PRU)
The „pupil voice‟ was also important in schools that were keen to listen to pupils‟ views, while other respondents emphasised the importance of pupils expressing their views and
participating in surveys.
'I think [the headteacher] is interested in the student voice. We have a very good school council here and there is a lot of things going on about how kids view the school - they vote on things. The headteacher is very keen on making sure the kids do feel like they're having their say” (participating secondary school)
The „pupil voice‟ was also seen as a positive aspect of the survey amongst non-participating schools, as indicated by a comment from one school that was unable to take part due to practical constraints:
22
The other main reason for participation was the availability of results at school level. This gave schools feedback about pupils‟ views that they could act on, and provided information that could feed into the school‟s self-evaluation form (SEF) or other planning documents.
“If there are things we need to respond to that we didn't know about via our students, it's really powerful feedback. That would be the reason why we went ahead”
(participating secondary school)
Many local authorities also recognised the importance of providing schools with their own data, with one respondent saying that:
“It would have died this year unless we could promise schools their own data, so that was absolutely pivotal. Without that we couldn‟t have promoted it as much
ourselves.” (local authority)
Some schools said that the content of Tellus4 was important in their decision to participate, in covering issues that were relevant or important to pupils, and in its link to the curriculum (PHSE or Citizenship). Non-participating schools also mentioned this as a positive aspect of the survey.
"It may have slipped through the net [as it is] the type of thing we are interested in" (non-participating primary school)
Some other reasons given by individual schools for their participation, included: the option for schools to add their own questions, the SEND versions, the reputation of the Tellus survey, the chance to be involved in new or national initiatives (which was seen as projecting a positive image of the school), and the fact that the survey was on-line.
The experience from previous Tellus surveys can also be important. Some schools felt that they had done it before, and would happily do so again. Some local authority respondents felt that peer encouragement could also play a positive role in this respect, but also
acknowledged that negative experiences too can have an impact on future participation.
“If schools find it a useful exercise, then other schools will join,[but] if schools say „we did this but it was a bit of an effort and we didn‟t get anything from it‟ then they‟re going to drop out and other schools will drop out.” (local authority)
3.6
Reasons for schools’ non-participation and perceived disadvantages
It is important to bear in mind that non-participating schools contributing to the evaluation may not be typical of all non-participating schools, as they may be slightly more open to considering the survey, simply by virtue of the fact that they were prepared to take part in the evaluation.
23
Specifically, respondents from non-participating schools mentioned lack of time, the staffing and resource implications, and the perceived burden on teachers. These respondents referred to specific issues in their schools, for example in one case a lot of new teachers were just starting at the school, in another an Ofsted inspection was taking place at the same time; in another, the school had just converted to an academy, and this brought a lot of extra work (including a number of other surveys). These issues meant that staff resources were already stretched and the survey represented an additional burden.
“As it was a new initiative, we would need teachers that were familiar with the school to do it... new teachers needed time to settle in” (non-participating primary school)
“[it would be] time-consuming and yet another new thing that no one was aware of, on top of other things that the staff had to do” (non-participating primary school)
“I know when staff looked at it… having said „yes we'd do it‟, they then looked at it and realised it was going to create an awful lot of work which couldn't be easily done within what we were already doing, that's when it became a no-no” (non-participating special school)
Some respondents from non-participating schools commented on the volume of external surveys that they were asked to take part in. This had led a number of headteachers in one local authority to make a general, collective decision to only take part in one external survey per year. The respondent from a non-participating school in this local authority simply accepted the first request the school received at the start of the school year, and then rejected all other requests. Another respondent felt that some of the external surveys they were asked to do covered very similar issues, giving the school the feeling that they were duplicating their efforts. This respondent wondered whether DCSF or another organisation could do anything to try to co-ordinate the various surveys more efficiently.
“One of the problems is we are continuously bombarded with people wanting us to do surveys for various things…we had a joint area review in [county] recently and we had to do two or three surveys for them. It got to the stage where the kids were never in the lessons, they were constantly doing surveys.” (non-participating secondary school)
“We had a very strong feeling that all of these groups were looking for the same information all the time, one was for the local authority, one for Ofsted. We felt very strongly that you've got to get together and get access to each other‟s data bank, as it's not fair to continuously ask kids the same questions” (non-participating secondary school)
There were occasional comments from non-participating schools that were specific to Tellus. One special school felt that the survey was not appropriate for their pupils, because of their differing needs, and that some aspects of Tellus4 would suit some pupils but not others (for example, this respondent said that the symbol version would suit some pupils, but other pupils would “feel belittled” by symbols). This respondent also felt that, in general, the survey was too long and would have been “too much” for the pupils.
“It was a very long and complicated thing for our students to do, it wasn't appropriate” (non-participating special school)
A respondent also felt that there was too much paperwork in Tellus4, and this gave the impression that a lot of work would be involved.
24
Overall, the concerns expressed by non-participating schools were very similar to the perceived negative features mentioned by participating schools (throughout the report), suggesting that there is no great difference in attitude, resources or circumstances, between participating and non-participating schools.
3.7
Local authority views on schools’ non-participation
In addition to the reasons for non-participation outlined above, local authority respondents put forward a number of reasons why schools may not have participated in Tellus4, often despite the authority‟s best efforts to encourage them.
Although the timing of the survey was generally viewed very positively, some local authority respondents felt that the long lead-in time was a factor, because it meant that some schools had forgotten about the survey, or that a change of staff at that school during the survey period had led to non-participation. As one authority said:
“The downside of the timing was keeping the flame under schools who said they would take part” (local authority)
Non-participation by schools was also put down to the fact that some of them did not
recognise the importance of Tellus and saw it as „just another survey‟. Because traditionally the data has been used primarily by the local authority, one respondent believed that:
“They [the schools] don‟t see the relevance of it to them. I think they see Tellus as something more for the local authority than for them.” (local authority)
There was also a perceived difference between the willingness of primary and secondary schools to participate. One respondent felt that:
“Most primary schools will do what they‟re told – they won‟t worry too much, they‟ll just do it. In secondary schools, it is very much down to individuals, non-participation was down to specific, individual issues relating to the schools, rather than issues relating to Tellus. A specific problem is that secondary schools have been doing another pupil survey, which „apparently is much more useful to schools‟, so they were reluctant to do Tellus as well.” (local authority)
3.8 Sharing views on Tellus4
Few respondents included in the survey had discussed Tellus4 with staff from other schools. In the small number of cases where this had happened, the survey was only discussed at a general level: one respondent reported a „general view‟ that the survey had improved, especially in relation to timing; another said the survey had no strong reputation, positive or negative.
"They don't have any form of opinion whatsoever... I've not heard anyone say anything bad" (participating secondary school)
25
One respondent (a headteacher) from a non-participating school had since spoken to headteachers in other schools, and had received positive feedback on Tellus. This had increased the likelihood of his school taking part in the future.
There was a suggestion from one participating school respondent to instigate a „buddy‟ system, so that schools with experience of Tellus can support schools that are new to it. This would require local authorities to identify „advocate schools‟ that could support and train neighbouring schools. This approach could increase the level of communication between schools about the survey, and also alleviate some of the concerns that schools may have before agreeing to take part (given that a number of non-participating schools were
concerned about the burden of the survey, and that some participating schools were initially intimidated by the perceived size of the task but were ultimately re-assured once they had done it).
3.9 Factors influencing future participation
Most participating schools said that they thought they would take part in Tellus again, although some said this would depend on the quality and usefulness of the school-level results. According to some participating schools, decisions about future participation would depend on their own assessment of the usefulness of the results in comparison with the effort required.
“The ultimate decision [to take part in the future] will be when we look at our school‟s results – it will be very dependent on whether or not it will be beneficial to the school to complete it, because it‟s taking up curriculum time and taking up staffing.”
(participating middle school)
“If the feedback is useful we'll do it again but, if not, obviously there is a lot of other stuff that comes through the school that ICT is used for that they have to prioritise, so if it was not helpful at all there's no point in us doing it” (participating secondary school)
A small number of respondents also felt that the effective use of the results by the
government or their local authority (to inform local or national policies) was important to their future participation. This was also an issue mentioned by some of the non-participating schools.
“My issue is what's going to happen with the information now it's been gathered. Is it just going to make a glossy report or is something going to happen with it”?
(participating secondary school)
“Heads would be much more sympathetic doing it if they knew it was something that led to change and had an impact, rather than was just information gathering for its own sake. I think that's how a lot of people feel” (non-participating secondary school)
3.10 Summary
In most schools, the decision to take part in Tellus4 was taken by the headteacher, either alone or in consultation with another senior teacher. The most common reasons for
26
In some cases, local authorities were active in encouraging schools to take part, and this could be a crucial factor in schools‟ participation. All local authorities saw the data that they would obtain from Tellus4 as the main benefit of their involvement in the survey, in particular because of the relevance of the survey to „Every Child Matters‟ outcomes.
The reasons given by non-participating schools for not conducting the survey mostly related to practical constraints: lack of time, the staffing and resource implications, and the
27
4 Communication and support
This chapter examines the communication and support received by schools and local
authorities from NFER and DCSF. This covers general communication, support provided by the NFER helpdesk, the stakeholder workshops conducted before the survey took place, and the management information tool for local authorities. The materials produced by NFER (support materials and curriculum materials) are examined later in the report in the
discussion of set-up and delivery of the survey (chapters 6 and 7).
4.1 NFER support
Most participating schools said that the communication and support they had received from NFER was good.
“The communication from NFER – I couldn‟t fault it” (participating PRU)
Some respondents pointed out that there had been very little contact, but this hadn‟t been needed as everything was straightforward. Although not many respondents had used the helpdesk, those that had made contact were generally positive, finding the service helpful and efficient, with a prompt response to queries. One of the respondents noted that the communication they had from the local authority was not clear as to NFER‟s role; this meant they contacted the local authority with a query when they would have been better contacting NFER. This suggests that some local authorities may benefit from clear guidance on what they should say to schools in any correspondence.
As noted in the previous chapter, local authority respondents often contacted schools to encourage them to take part. Some local authority respondents also kept in contact with schools to prompt them to stay on schedule with the set up of the survey. One respondent stressed the view that local authorities still needed to be closely involved with schools, and that they could not always rely on schools to follow the guidance from NFER. This ties in with the findings reported in chapter 6 („Delivery models used in schools‟), indicating that information is not always passed on within schools.
“Heads are being advised that you just need to go onto the website, but they just don‟t do it” (local authority)
The authorities we interviewed could not recall being asked for advice by their schools, and in fact one respondent felt that there was now no role for the local authority in the running of the survey. One local authority had used their bulletin board to give advice to their schools, one had answered a few minor queries and one had simply given schools the NFER website address.
In terms of the support given to local authorities themselves, the general feeling amongst local authority respondents was that the communication (mainly through the Tellus portal) had worked well and that the local authority had got what they needed. The feelings of many were summed up well by one respondent:
“NFER – always very helpful…the people I spoke to there” (local authority)
28
4.2 Stakeholder consultation workshops
Around half of the local authority respondents had attended a stakeholder workshop and some of these had taken a colleague with them. Some had not attended themselves but sent a colleague and only one respondent had been unaware of the workshops. The majority of those who had attended a workshop were very positive about them.
“Just the kind of event that emphasises the difference between DCSF‟s approach and Ofsted‟s approach; the fact that they had that kind of briefing event. They listened to what people had to say, there was much more engagement.” (local authority)
“NFER sold it well... presented it well as something that was better than what had happened before and I left there feeling quite happy with the process” (local authority)
While seeing the workshop as useful, most respondents did not feel that their attendance at the workshop had influenced their decision over their authority‟s involvement in the survey. However, some did feel that it had given them more confidence in the process which made them more able to persuade schools to take part.
More frequently, however, local authorities saw the workshop as an important part of the consultation process:
“A chance for the local authority‟s views to be taken into account” (local authority)
One respondent, whilst positive about the workshop, expressed a plea that DCSF would “stay in listening mode”, and hoped that workshops would continue to be part of the survey process in future years.
There was an occasional negative comment about the workshops. One respondent had argued for the retention of a question in the core questionnaire, and was disappointed that their view had not been accommodated. Another respondent expressed disappointment, as he felt his concerns about statistical validity had not been addressed.
4.3 Use of management information tool by local authorities
Most local authorities had used the management information tool to monitor response and to chase up non-responding schools. All those who had used it felt that it was useful and helpful. As noted in the chapter on overall satisfaction, the management information tool was one of the most positive features of the survey in the eyes of local authority
respondents. As one respondent said:
29
4.4 Summary
The communication and support provided by NFER was viewed positively by both
30
5 Survey timing and pupil coverage
This chapter looks at two of the main changes made to the survey for Tellus4: the timing of the survey, and the option to include whole year groups in the survey, rather than individual classes.
5.1 Survey timing
The Tellus4 survey was delivered in schools in October and November 2009. This was a change from previous Tellus surveys, which took place in the summer term.
Local authorities
Amongst the majority of local authorities, respondents were positive about the new timing of the survey and thought that the autumn was more appropriate. It was seen as more practical from a school perspective and it worked well for the local authorities because it provided them with the figures they needed towards the end of the financial year. A specific positive comment was that the new timing of the survey did not clash with the Audit Commission Survey. However, because the process had to start so early one respondent felt that:
“Survey set-up started in May-June. [This meant] an extended period when schools had to think about it, (it became) a protracted process.” (local authority)
Schools
Most participating schools thought that the timing of Tellus4 was appropriate, with some noting that the autumn is a less busy time of year for schools without exam commitments. A number of those with experience of previous Tellus surveys said that the timing of Tellus4 was an improvement.
“For year 10 it fits in well. October is a good time as it happens before they are sitting their exams so it's not a distraction.” (participating secondary school)
Non-participating schools were also generally positive towards the timing of the survey, and one said this could potentially influence their participation in the future.
However, the timing of the survey was an issue for PRUs, because they tend to have small numbers of pupils in the autumn term (because of the pattern of school exclusions). This meant that very few pupils completed the survey and this prevented the schools from getting school-level results. Respondents at PRUs felt that either the spring or summer term would be preferable.
A couple of respondents had reservations about the timing of Tellus4, either because they saw the autumn as a busy time for the school, or because pupils and classes were “more settled” after Christmas; one local authority respondent agreed that it would be preferable to run the survey later in the school year, as pupils would have settled in better.
31
5.2 Inclusion of whole years
In previous Tellus surveys, participation in each school was restricted to just one year 6 class and to two classes from each of years 8 and 10. In Tellus4, schools had the option of either doing the same, or alternatively they could include all of their pupils in the relevant year groups.
In general, smaller schools were more likely to include the whole year group. Larger schools often had logistical difficulties in allowing a large number of pupils to take part in the survey, and in some cases therefore selected some pupils only in the relevant year groups. A respondent from a non-participating school also felt that, in a large school, completing the survey on a whole year basis would be problematic. This view was also held by some of the local authority respondents.
Specifically, PRUs included all pupils in the year group, as there were only a very small number of pupils at the school at the time of the survey. Primary schools were also more likely than not to include the whole year. In secondary schools, there was evidence of both approaches, while special schools tended to select certain pupils only, as it was felt that some pupils did not have the cognitive ability or ICT capability to take part.
Where the whole year did take part, this was often seen as a better or fairer representation of the year group or the school as a whole. Some respondents felt that it allowed more pupils to have their say, and others found it simpler to organise it this way (as this avoided decisions as to which pupils or classes should be excluded).
Where not all pupils in the year were included, this was most commonly because of limited computer availability, or (as noted above) in special schools where pupils were felt unable to complete the survey. One respondent was positive towards the fact that schools could choose whether to include all pupils or just certain classes; this gave them the flexibility to take part without straining resources.
Where the whole year was not included, schools did not always follow the guidance to select one or two classes. In fact, pupils were selected in various ways. In some special schools, it was restricted to those who were felt able to complete the survey. Other approaches
included: selecting a „representative‟ range of pupils from the year; choosing classes whose timetable fitted in with ICT availability and/or were doing ICT at GCSE; and choosing the most “challenging” class to “reflect the area”. This suggests that where schools are selecting a sub-sample of the year group, this is being done in different ways and is somewhat
arbitrary.
Local authorities liked the idea that all students in the selected years could participate in the survey and many were keen that they had done so. However, many did not know if their schools had taken up this option.
5.3 Summary
32
33
6 Delivery models used in schools
This chapter looks at how the survey was actually administered in schools: how it was staffed, whether the whole class completed the survey at the same time, and how pupils were briefed. It also examines the extent to which the survey was incorporated into the PHSE or Citizenship timetable and the use of curriculum materials.
6.1 Staff responsibilities in schools and local authorities
Local authorities
Whilst all of the local authority respondents were linked to their authority‟s performance team, the make-up of their Tellus teams varied. The respondent was invariably the main contact with NFER, their own director and sometimes the schools. However, s/he was not always responsible for the analysis of survey data, with some relying on colleagues within the team to provide analytical support. Some local authorities included school heads in their Tellus working group.
Schools
In most cases, the school had a dedicated co-ordinator for the Tellus4 survey. In terms of seniority, a wide range of people fulfilled the co-ordinator role, from deputy head to teaching assistants. The co-ordinator was sometimes involved from the outset, but in other cases the task of co-ordinating the survey was delegated by the headteacher after the decision to participate.
In some cases (generally where only a small number of pupils were involved, such as in PRUs), the co-ordinator did all of the tasks required for the set-up and delivery of the survey. Elsewhere, the co-ordinator worked with class teachers who administered the survey with relevant class groups. In these cases, the class teachers and/or pupils were usually briefed by the co-ordinator, who was also sometimes present in the lessons as well.
In some schools, there was no clear co-ordinator role. With this approach, the headteacher or deputy head typically delegated the administration of the survey to individual class teachers. In some cases, the task was not delegated until the time of the survey fieldwork, and teachers therefore knew nothing about the survey until they needed to administer it; in fact, there was an example of a teacher only being given a day‟s notice to carry out the survey. This had implications for the delivery of the survey (e.g. in teachers‟ ability to incorporate curriculum materials and use the SEND versions), which are discussed further below.
34
6.2 Mode of completion of the survey
Most respondents in participating schools said they did the survey with the whole class in one session. A small number of respondents said they did the survey in stages with smaller groups, generally because of limited availability of ICT access. Some respondents from PRUs said that the pupils had their own laptops, which allowed greater flexibility; in fact, one PRU allowed pupils to do the survey when they liked in their own time. In some special schools, pupils were taken out of other classes individually to do the survey accompanied by a teacher.
6.3 Pupil briefing
Most respondents from participating schools said that pupils were briefed about the survey in advance, often from NFER materials (sections 9 and 10 of the Tellus school support pack). These materials worked well for most respondents, although in some cases the teacher adapted it. One respondent said they would have preferred a simplified version of the briefing materials, but another requested a more thorough briefing for pupils, for example to encourage honest answers. Overall, therefore the briefing materials appear to be
appropriate for use in schools. It is not clear whether staff actually gave the pupil information from the school support pack sheet to pupils or just used the materials to brief them.
Occasionally, schools gave a more detailed briefing, for example using the hard copy of the questionnaire to take pupils through the survey in advance. However, a minority of schools gave pupils little or no advance notice or preparation.
6.4 Integration into curriculum subjects
For the first time, Tellus4 included citizenship curriculum materials, which were sent to schools in the hope that they would be used in PHSE and Citizenship lessons before, during and after the survey. In this section, we examine the extent to which the survey was
incorporated into PHSE or Citizenship lessons; the next section focuses on the curriculum materials specifically.
Very few schools integrated the survey into PHSE or Citizenship lessons, or planned lessons around the survey. However, one secondary school respondent said that they did plan lessons around the survey (before and after), specifically in relation to classes on the importance of expressing an opinion and taking part in surveys. Another primary school respondent found that it fitted in well with PHSE:
“We did a lot of work on anti bullying, safeguarding… transitional activities which just link perfectly with the survey… it just runs into PHSE” (participating primary school)
35
Another respondent (in a school where the survey was not integrated into PHSE) wondered whether it would have helped if they had done so, so that pupils could think about their answers more in the context of the subject, rather than “just filling it in without thinking about it”.
However, these examples were very much the exception. In most schools, the survey was seen primarily as an administrative task, and was delivered in a way that was seen as most efficient and that fitted in best with practical constraints, such as matching IT facilities to the right classes within the constraints of the timetable and staff resources, and without
damaging core subject time. As a result, staff tended to consider the practical elements of the survey rather than how its subject suited curriculum subjects.
As a result, pupils often completed the survey in an ICT class, as this was where the class had access to computers. Some respondents noted that this can be a source of
dissatisfaction for ICT teachers, whose lessons can be „hijacked‟ for on-line surveys or other activities needing ICT access. A number of respondents felt they relied on the goodwill of ICT teachers to accommodate the survey.
“It's really difficult because a lot of [ICT] teachers don't like it being used in their subjects… so it might be next year that they might just have so many other things