David Duffy
Kevin Timoney
Spring 2013
The
Economic Research
Institute
was
founded
in
Dublin
in
1960,
with
the
assistance
of
a
grant
from
the
Ford
Foundation
of
New
York.
In
1966
the
remit
of
the
Institute
was
expanded
to
include
social
research,
resulting
in
the
Institute
being
renamed
The
Economic
and
Social
Research
Institute
(ESRI).
In
2010
the
Institute
entered
into
a
strategic
research
alliance
with
Trinity
College
Dublin,
while
retaining
its
status
as
an
independent
research
institute.
The
ESRI
is
governed
by
an
independent
Council
which
acts
as
the
board
of
the
Institute
with
responsibility
for
guaranteeing
its
independence
and
integrity.
The
Institute’s
research
strategy
is
determined
by
the
Council
in
association
with
the
Director
and
staff.
The
research
agenda
seeks
to
contribute
to
three
overarching
and
interconnected
goals,
namely,
economic
growth,
social
progress
and
environmental
sustainability.
The
Institute’s
research
is
disseminated
through
international
and
national
peer
reviewed
journals
and
books,
in
reports
and
books
published
directly
by
the
Institute
itself
and
in
the
Institute’s
working
paper
series.
Researchers
are
responsible
for
the
accuracy
of
their
research.
All
ESRI
books
and
reports
are
peer
reviewed
and
these
publications
and
the
ESRI’s
working
papers
can
be
downloaded
from
the
ESRI
website
at
www.esri.ie
The
Institute’s
research
is
funded
from
a
variety
of
sources
including:
an
annual
grant
‐
in
‐
aid
from
the
Irish
Government;
competitive
research
grants
(both
Irish
and
international);
support
for
agreed
programmes
from
government
departments/agencies
and
commissioned
research
projects
from
public
sector
bodies.
Sponsorship
of
the
Institute’s
activities
by
Irish
business
and
membership
subscriptions
provide
a
minor
source
of
additional
income.
Quarterly Economic
Commentary
The
Quarterly
Economic
Commentary
analyses
current
economic
trends
and
provides
macro
‐
economic
forecasts
for
the
current
and
following
year.
It
assesses
international
economic
prospects
and
provides
short
‐
term
forecasts
in
the
framework
of
a
consistent
set
of
national
accounts
for
Ireland.
Its
wide
range
of
users
includes
government
departments,
policy
‐
makers,
social
partners,
international
organisations,
academics
and
the
national
and
international
financial
sectors.
Research Bulletin
The
Research
Bulletin
provides
short
summaries
of
work
published
by
ESRI
staff
and
overviews
of
thematic
areas
covered
by
ESRI
programmes
of
research.
Bulletin
articles
are
designed
to
be
easily
accessible
to
a
wide
readership.
A
reference
or
references
to
the
full
publication
is
included
at
the
end
of
each
Bulletin
article.
An
archive
of
bulletin
articles
will
be
found
at
www.esri.ie/bulletin
Quarterly Economic
Commentary
David Duffy Kevin Timoney
Spring 2013
Research Notes
John FitzGerald, Conor O’Toole et al., Petra Gerlach-Kristen
Research Bulletin
13/1
Authors
David Duffy is a Research Officer and Editor of the Commentary, Kevin Timoney is a Research Assistant at the Economic and Social Research Institute (ESRI).
Table of Contents
Summary Table ... ii
Summary ... iii
National Accounts Table 2012, 2013, 2014 ... iv
CHAPTERS 1. The International Economy ... 1
2. Exports of Goods and Services ... 5
3. Investment ... 7
4. Incomes, Price and Consumption ... 9
5. Public Finances ... 12
6. The Labour Market ... 14
7. Imports and the Balance of Payments ... 18
8. Monetary Sector Developments ... 20
9. General Assessment of the Irish Economy ... 25
Summary Forecast Tables are contained within the main text. Detailed Forecast Tables are contained in an Appendix. RESEARCH NOTES ... 33
The Effect of Re-domiciled Plcs on Irish Output Measures and the Balance of Payments – John FitzGerald Measuring Credit Constraints for Irish SMEs – Conor O’Toole, Petra Gerlach-Kristen and Brian O’Connell Consumption: Younger and Older Households in the Crisis – Petra Gerlach-Kristen RESEARCH BULLETIN ... 59
How Much Does It Cost the Economy when Essential Services are Interrupted – Seán Lyons and
Summary Table
2010 2011 2012 2013 2014
Output (Real Annual Growth %)
Private Consumer Expenditure 1.0 -2.4 -0.9 -0.4 0.4
Public Net Current Expenditure -6.5 -4.3 -3.7 -1.0 -2.0
Investment -22.6 -12.6 1.2 1.6 5.5
Exports 6.2 5.1 2.9 3.0 5.3
Imports 3.6 -0.3 0.3 2.3 4.3
Gross Domestic Product (GDP) -0.8 1.4 0.9 1.8 2.7
Gross National Product (GNP) 0.9 -2.5 3.4 1.0 1.5
Prices (Annual Growth %)
Consumer Price Index (CPI) -1.0 2.6 1.7 1.5 1.7
Growth in Average Hourly Earnings -1.5 0.1 1.1 1.2 1.5
Labour Market
Employment Levels (ILO basis (000s)) 1,882 1,849 1,838 1,841 1,849
Unemployment Levels (ILO basis (000s)) 303 317 316 306 298
Unemployment Rate (as % of Labour Force) 13.9 14.6 14.7 14.2 13.9
Public Finance
General Government Balance (€bn) -48.3 -21.3 -12.5 -12.1 -8.0
General Government Balance (% of GDP) -30.8 -13.4 -7.6 -7.2 -4.6
General Government Debt (% of GDP 92 106 118 123 119
External Trade
Balance of Payments Current Account (€bn) 1.8 1.8 8.1 8.8 9.7
Current Account (% of GNP) 1.4 1.4 6.1 6.4 6.9
Demand
Final Demand 1.3 1.2 1.0 2.0 3.4
Domestic Demand -4.2 -3.7 -1.5 0.7 0.7
Domestic Demand (excl. Stocks) -4.9 -4.3 -1.2 -0.2 0.6
Summary
The Irish economy stabilised in broad terms in 2012, despite a challenging international context and ongoing difficulties in the eurozone in particular. Mainly due to a strong services exports performance, GDP grew by just under 1 per cent in 2012. GNP expanded by 3.4 per cent, although closer inspection reveals that this figure overstates the underlying growth activity (see FitzGerald, this issue). Domestic demand contracted once again, although the pace of contraction was much less severe than in any year since 2008. The unemployment rate averaged 14.7 per cent in 2012 while the fall in employment continued.
As a small open economy, Irish economic prospects are primarily determined by world economic activity. While growth has remained subdued for many of Ireland’s main trading partners, there continue to be better prospects for global economic activity later in 2013 and into 2014, mainly driven by US expansion. Although challenges remain for many countries, other economies including that of the US have proven relatively resilient in recent years.
GDP for 2013 is expected to grow by 1.8 per cent, with growth of 2.7 per cent forecast for 2014. GNP is now forecast to grow by 1.0 per cent this year, before increasing a further 1.5 per cent next year, partly due to an improved outlook for domestic demand. Continued growth in the contribution from net exports underpin this year’s expected improvement, while an increase in growth in investment and the domestic economy will also contribute next year. The labour market will show moderate improvement over the forecast horizon, with the unemployment rate expected to decrease to 14.2 per cent this year and 13.9 per cent next year, albeit mainly as a result of continued net emigration.
National Accounts 2012
A: Expenditure on Gross National Product
2011 2012 Change in 2012
€bn €bn Value Price Volume
Private Consumer Expenditure 81.3 82.0 0.8 1.8 -0.9
Public Net Current Expenditure 25.4 24.8 -2.6 1.2 -3.7
Gross Fixed Capital Formation 16.1 16.4 1.7 0.5 1.2
Exports of Goods and Services 166.8 177.1 6.2 3.2 2.9
Physical Changes in Stocks 0.2 -0.1
Final Demand 289.8 300.2 3.6 2.5 1.0
less:
Imports of Goods and Services (M) 131.9 137.6 4.4 4.1 0.3
Statistical Discrepancy 1.0 1.0
GDP at Market Prices 159.0 163.6 2.9 1.9 0.9
Net Factor Payments (F) -32.0 -30.2
GNP at Market Prices 127.0 133.4 5.0 1.5 3.4
B: Gross National Product by Origin
2011 2012 Change in 2012
€bn €bn €bn %
Agriculture 3.2 3.0 -0.3 -8.0
Non-Agriculture: Wages, etc. 67.8 68.1 0.4 0.6
Other 58.1 62.5 4.4 7.6
Adjustments: Stock Appreciation -0.6 -0.6
Statistical Discrepancy -1.0 -1.0
Net Domestic Product 127.4 132.0 4.6 3.6
Net Factor Payments -32.0 -30.2 1.8 -5.6
National Income 95.5 101.8 6.3 6.6
Depreciation 15.8 15.5 -0.3 -2.0
GNP at Factor Cost 111.3 117.3 6.0 5.4
Taxes less Subsidies 15.8 16.1 0.3 2.0
GNP at Market Prices 127.0 133.4 6.3 5.0
C: Balance of Payments on Current Account
2011 2012 Change in 2012
€bn €bn €bn
X – M 34.8 39.3 4.6
F -32.0 -30.2 1.8
Net Transfers -1.2 -1.2 -0.1
Balance on Current Account 1.8 8.1 6.3
as % of GNP 1.4 6.1 4.7
National Accounts 2013
A: Expenditure on Gross National Product
2012 2013 Change in 2013
€bn €bn Value Price Volume
Private Consumer Expenditure 82.0 82.7 0.9 1.3 -0.4
Public Net Current Expenditure 24.8 24.8 0.2 1.2 -1.0
Gross Fixed Capital Formation 16.4 17.0 3.5 1.9 1.6
Exports of Goods and Services 177.1 185.9 4.9 1.9 3.0
Physical Changes in Stocks -0.1 1.0
Final Demand 300.2 311.4 3.7 1.7 2.0
less:
Imports of Goods and Services (M) 137.6 143.3 4.1 1.8 2.3
Statistical Discrepancy 1.0 0.9
GDP at Market Prices 163.6 169.0 3.3 1.5 1.8
Net Factor Payments (F) -30.2 -32.5
GNP at Market Prices 133.4 136.5 2.3 1.4 1.0
B: Gross National Product by Origin
2012 2013 Change in 2013
€bn €bn €bn %
Agriculture 3.0 3.2 0.2 7.5
Non-Agriculture: Wages, etc. 68.1 69.4 1.2 1.8
Other 62.5 65.6 3.1 5.0
Adjustments: Stock Appreciation -0.6 -0.6
Statistical Discrepancy -1.0 -0.9
Net Domestic Product 132.0 136.7 4.7 3.5
Net Factor Payments -30.2 -32.5 -2.3 7.8
National Income 101.8 104.1 2.3 2.3
Depreciation 15.5 15.5
GNP at Factor Cost 117.3 119.6 2.4 2.0
Taxes less Subsidies 16.1 16.8 0.8 4.9
GNP at Market Prices 133.4 136.5 3.1 2.3
C: Balance of Payments on Current Account
2012 2013 Change in 2013
€bn €bn €bn
X – M 39.3 42.4 3.1
F -30.2 -32.5 -2.3
Net Transfers -1.2 -1.3 -0.1
Balance on Current Account 8.1 8.8 0.7
as % of GNP 6.1 6.4 0.5
National Accounts 2014
A: Expenditure on Gross National Product
2013 2014 Change in 2014
€bn €bn Value Price Volume
Private Consumer Expenditure 82.7 84.3 1.9 1.5 0.4
Public Net Current Expenditure 24.8 24.2 -2.4 0.8 -2.0
Gross Fixed Capital Formation 17.0 18.3 7.8 2.2 5.5
Exports of Goods and Services 185.9 198.9 7.0 1.5 5.3
Physical Changes in Stocks 1.0 1.0
Final Demand 311.4 326.6 4.9 1.4 3.4
less:
Imports of Goods and Services (M) 143.3 152.2 6.2 1.8 4.3
Statistical Discrepancy 0.9 1.1
GDP at Market Prices 169.0 175.3 3.7 1.0 2.7
Net Factor Payments (F) -32.5 -36.3
GNP at Market Prices 136.5 139.6 2.3 0.8 1.5
B: Gross National Product by Origin
2013 2014 Change in 2014
€bn €bn €bn %
Agriculture 3.2 3.5 0.3 8.5
Non-Agriculture: Wages, etc. 69.4 70.9 1.6 2.1
Other 65.6 68.4 2.8 4.2
Adjustments: Stock Appreciation -0.6 -0.6
Statistical Discrepancy -0.9 -0.9
Net Domestic Product 136.7 141.3 4.6 3.4
Net Factor Payments -32.5 -35.7 -3.1 9.6
National Income 104.1 105.6 1.8 1.8
Depreciation 15.5 16.0 0.5 3.2
GNP at Factor Cost 119.6 121.6 2.0 1.7
Taxes less Subsidies 16.8 18.0 1.2 6.8
GNP at Market Prices 136.5 139.6 3.2 2.3
C: Balance of Payments on Current Account
2013 2014 Change in 2014
€bn €bn €bn
X – M 42.4 46.5 4.0
F -32.5 -35.7 -3.1
Net Transfers -1.3 -1.3 0.0
Balance on Current Account 8.8 9.7 0.9
1
The International Economy
The outlook for global economic activity in 2013 and 2014 remains mixed, in particular from the viewpoint of Ireland’s external demand. While growth recoveries are forecast for 2014 in the US, eurozone and the UK, this year is expected to be more challenging for the eurozone and the UK. There was a sharp slowdown of growth across Ireland’s main trading partners in the fourth quarter of 2012, and the risk of further negative impacts from shocks to the global economy remains high. The most pressing matter at present concerns the need to implement policies to facilitate recovery in the eurozone.
Following a surprisingly weak growth performance in the fourth quarter of last year, several indicators in the US economy suggest a better start to 2013. Uncertainty arising from the spectre of fiscal tightening is likely to have contributed to the slowdown in growth at the end of 2012. However, in the early months of this year there have been encouraging improvements in retail spending levels and employment data, with more construction employment and housing sector gains assisting the upturn. Although GDP grew by 2.5 per cent in the first quarter of this year on an annual basis, the introduction of additional taxation for higher earners and federal spending reductions are expected to decrease the growth figures in the second quarter. Meanwhile, the Federal Reserve continues to engage in quantitative easing, with the federal funds rate targeted in the range of 0-0.25 per cent, as long as the unemployment rate remains high (above 6.5 per cent) and while short-term inflation expectations are not higher than 2.5 per cent. This accommodative policy will be maintained with agency mortgage-backed securities purchases of $40 billion per month and longer-term treasury securities at $45 billion per month. Overall, US GDP growth is expected to remain just above 2 per cent for 2013, before increasing to 3 per cent in 2014.
pursued in order to reduce exposure to future banking crises. Encouragingly, EU institutions have recently agreed to establish a single supervisory mechanism (SSM) allowing large eurozone banks to be regulated at European Central Bank (ECB)-level, rather than by national central banks. The challenging objective remains to enable centralised recapitalisations of financial institutions with solvency issues, and irrespective of the eurozone achieving economic recovery in coming years, this goal should be prioritised. The increased demand for peripheral sovereign debt seen in recent months suggests that the ECB’s announcement of outright monetary transactions in September 2012 continues to support creditworthiness of eurozone member states, despite ongoing difficulties in terms of high unemployment and fragile recovery prospects. However, heightened uncertainty, mainly due to the outcome of negotiations in Cyprus and the questionable ability of the eurozone to achieve necessary reforms, is likely to hamper growth in early 2013, as consumers and businesses continue to be cautious.
Unemployment levels continue to rise across the common currency area, and the ongoing fiscal tightening has contributed to falling domestic demand in many countries. Output for the eurozone has been weak, with industrial production falling 2.4 per cent last year, as France, Germany, Italy and Spain experienced annual declines in output. As with GDP, overall industrial production is expected to fall again this year, before returning to growth in 2014. Trade activity has been particularly volatile in the eurozone in recent years. Imports for the eurozone fell last year by 0.4 per cent, and trade volume is likely to remain subdued for the first half of this year. Meanwhile, economic growth in 2013 is expected to be flat or negative in three of the four largest eurozone economies (France, Spain and Italy). Data to the first quarter of this year show France re-entered recession with consecutive quarterly GDP contractions of 0.2 per cent, while marginal GDP growth in Germany could not spare the eurozone of its 0.2 per cent contraction. As argued in the previous Commentary, there appears to be insufficient demand at present to support multiple export-led recoveries in the single market.
address the rising budget deficit (which fell to 6.3 per cent of GDP in 20121) have
held back domestic demand, and in combination with the expanding trade deficit (hampered by a weak external demand channel), the ability to engineer economic growth has proven difficult. Despite these considerable headwinds, UK GDP is forecast to increase by 0.7 per cent this year, and 1.7 per cent in 2014, primarily driven by stronger investment and exports growth. The Funding for Lending
Scheme has improved credit availability conditions for businesses and households.
While there is little evidence so far to suggest that lending activity has
subsequently increased,2 the availability may add stability to growth recovery in
future. Other schemes have been introduced to assist growth in property transactions and residential investment, including the Help to Buy Scheme and the
Mortgage Equity Guarantee. Measures of consumer and business confidence have
shown tentative improvements in the early months of 2013, while employment levels have grown above forecast, rising each quarter since mid-2011. Of particular relevance to the Irish economy, UK personal consumption expenditure returned to growth last year, and imports are expected to maintain their growth over the forecast period. However, if the depreciation of the pound seen to date in 2013 continues, there will be scope for terms of trade gains for the UK.
FIGURE 1 Real GDP growth (% change, year-on-year)
Eurozone United States United Kingdom
Sources: FocusEconomics, Eurostat, IMF, OECD, HM Treasury and Federal Reserve.
1 See Eurostat release, 19th April 2013:
http://epp.eurostat.ec.europa.eu/portal/page/portal/government_finance_statistics/documents/SIF-fin_crisis_impact-EDP.pdf
2 For more on UK lending activity, see the March 2013 Economic and Fiscal Outlook prepared by the UK Office for
Budget Responsibility. -5 -4 -3 -2 -1 0 1 2 3 4 -5 -4 -3 -2 -1 0 1 2 3 4 -5 -4 -3 -2 -1 0 1 2 3 4
Following a much-reduced trade volume for the second half of 2012, the outlook for global trade for the coming years is more favourable, according to the World Trade Organisation. Forecasts for trade expansions are mainly based on growing domestic demand in the more developed countries, but an expanding domestic sector in China and other emerging markets has also fuelled rising imports for the world’s second largest economy.
The international economy remains fragile, but the reduced risk of further crises in the eurozone following the European Central Bank (ECB’s) September 2012 intervention has added considerably more stability than had prevailed since 2008. Indeed, stock indices have enjoyed considerable gains in recent months, many surpassing their pre-crisis peaks. However, it remains to be seen whether these levels will be sustained if quantitative easing and broadly accommodative monetary policy are scaled back. In its recent economic outlook, the OECD examined the growing disconnect between real activity and asset prices for OECD
countries, possibly indicating an elevated appetite for risk.3 These concerns
highlight the potential for increased volatility of demand from trading partners, which could arise from overpriced equity markets overseas. This possible vulnerability is a particular concern for a small open economy such as Ireland’s.
3 For more on recent financial market developments, see OECD (2013), “What is the near-term global economic
2
Exports of Goods and Services
Preliminary National Accounts from the CSO for 2012 show that exports of goods and services grew by 2.9 per cent in volume terms and by 6.2 per cent in value, implying a price deflator of 3.2 per cent for the year. Quarterly data show that the growth in exports was driven by service export growth, with goods exports declining in volume terms for most of the year, with an annual decline of 2.8 per cent. Although there was some moderation in growth for the second half of the year service export growth averaged 8.9 per cent in 2012.
In value terms, exports of agricultural, forestry and fishing products rose by 1.8 per cent, and industrial exports rose by just 0.5 per cent. Based on Balance of Payments data, tourism receipts declined last year by 3.2 per cent and exports of other services rose by 11.4 per cent in value terms.
As noted above, goods exports in volume terms were on a downward trend in the second half of 2012, reflecting in part the impact of the “pharma cliff” on industrial output from the modern sector. We believe this has continued into 2013, with traditional manufactured exports being adversely affected by sterling weakness. However, if the European economy picks up in the second half of the year some moderation in this trend is anticipated. Thus, in volume terms we expect goods exports to be unchanged in 2013 when compared with 2012. If activity in Europe continues to gather momentum in 2014, we expect goods exports to grow by 2.3 per cent.
The volume of service exports exceeded that of goods in 2012. With continued flows of service sector Foreign Direct Investment (FDI) into Ireland this extra capacity is expected to result in continued strong growth in service exports, with volume growth of 5.7 per cent forecast for 2013 and 8.0 per cent in 2014.
TABLE 1 Exports of Goods and Services
2011 2011 2012 2013 2014
Value Volume Change
€ billion % % % %
Merchandise 84.9 2.7 -2.8 0.0 2.3
Services:
Tourism 3.3 4.0 -4.9 2.0 3.8
Other Services 78.2 7.9 9.3 5.9 8.2
Total Services 81.5 7.7 8.6 5.7 8.0
Exports of Goods and Services 166.8 5.1 2.9 3.0 5.3
3
Investment
Having contracted each year between 2008 and 2011, preliminary CSO data indicate that overall investment grew by 1.2 per cent in 2012 in volume terms. With value growth recorded at 2.2 per cent this implies that the investment price deflator remains moderate at 1 per cent. While the volume of construction continued to decline, investment in machinery and equipment grew, even when investment in aircraft is excluded.
TABLE 2 Gross Fixed Capital Formation, % Change in Volume
2011 2011 2012 2013 2014
Value Volume Change
€ billion % % % %
Housing 3.9 -11.9 -16.8 -5.7 6.3
Other Building 4.9 -21.8 2.5 3.0 5.2
Total Building and Construction 8.8 -15.8 -5.6 -0.4 5.7
Machinery and Equipment 7.3 -8.3 9.6 3.8 5.4
Total 16.1 -12.6 1.2 1.6 5.5
Source: Central Statistics Office and ESRI Forecasts.
FIGURE 2 Investment levels, as a % of GNP, constant prices
Sources: CSO data and ESRI Forecasts.
With domestic activity forecast to improve gradually and an improvement in export markets, particularly in 2014, we expect that investment in machinery and equipment will grow by close to 4 per cent this year and by over 5 per cent in 2014. On the basis of these forecasts overall investment will grow by 1.6 per cent this year and by 5.5 per cent in 2014. Although some recovery is forecast investment levels in the economy are still well below previous levels, see Figure 2.
0 5 10 15 20 25 30
as
%
o
f G
N
4
Incomes, Prices and Consumption
Earnings and Labour Costs data published by the CSO show that overall hourly earnings were broadly stable in 2012, with some sectors experiencing increases and others experiencing declines. If there is, as we anticipate, some recovery in the labour market over the next two years then we expect that there will be some moderate increases in average annual earnings at an aggregate level.
This is reflected in our forecasts for non-agricultural income. As we set out in Section 6, overall employment is forecast to show an increase in 2013 and again in 2014. Coupled with our forecasts of moderate growth in earnings this leads us to expect an increase in aggregate non-agricultural wages of approximately 1.8 per cent in 2013, and a further 2.3 per cent in 2014.
With direct personal taxation growing at a faster rate than incomes, growth in personal disposable income will be more moderate, at 1.1 per cent this year and 2.2 per cent in 2014. When combined with our forecasts for consumption the implication is that the savings ratio will remain between 5.7 and 6.0 per cent in 2013 and 2014.
TABLE 3 Personal Disposable Income
2011 2012 2013 2014
€bn €bn €bn €bn
Agriculture, etc. 3.2 3.0 3.2 3.5
Non-Agricultural Wages 67.8 68.1 69.4 70.9
Other Non-Agricultural Income 11.5 13.5 13.9 15.0
Total Income Received 82.5 84.6 86.4 89.4
Current Transfers 25.8 25.2 25.1 25.1
Gross Personal Income 108.4 109.8 111.5 114.5
Direct Personal Taxes 22.4 23.0 23.8 24.8
Personal Disposable Income 85.9 86.8 87.8 89.7
Consumption 81.3 82.0 82.7 84.3
Personal Savings 4.6 4.8 5.0 5.4
Savings Ratio 5.4 5.6 5.7 6.0
Average Personal Tax Rate 20.7 20.9 21.3 21.7
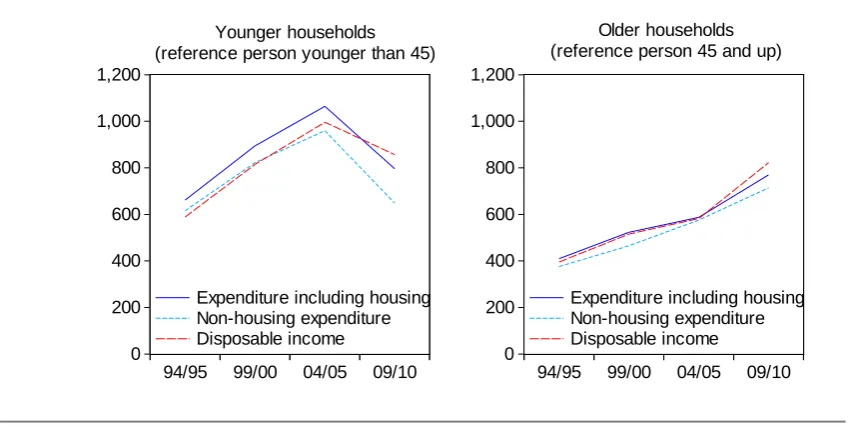
The preliminary National Accounts for 2012 show that the volume of personal consumption continued to decline, down by 0.9 per cent compared with 2011. Analysis by Gerlach-Kristen, in an accompanying Research Note of the consumption patterns of younger and older households in the crisis, finds that the drop in consumption has been mainly concentrated in younger households. The value of personal consumption was marginally higher, although the increase, at 0.8 per cent, was modest. The personal consumption deflator grew by 1.7 per cent.
The volume of personal consumption is expected to decline marginally in 2013 and to show marginal growth in 2014. Although consumer confidence has improved in recent months, it currently remains below its long-run average. Retail sales data for the first quarter of the year indicate that the volume of sales remains weak. Although it now seems there will be some increase in earnings over the next two years uncertainty regarding the economic outlook and the continued high level of unemployment is likely to result in households continuing to save for precautionary reasons, see Figure 3. In addition, households are continuing to deleverage. It seems likely that inflation and the personal consumption deflator will remain moderate, with the consumption deflator at around 1.5 per cent per annum. Thus, the value of personal consumption will grow at just 1 per cent in 2013 and by close to 2 per cent in 2014.
FIGURE 3 Saving for Unexpected Expenses, % of respondents
Note: From April 2012 the survey questions were asked every second month. Sources: Based on data from Nationwide (UK) Ireland Savings Index.
0.0 5.0 10.0 15.0 20.0 25.0 30.0 35.0 40.0 45.0 50.0
Apr-11 Aug-11 Dec-11 Apr-12 Aug-12 Dec-12 Apr-13
%
o
f r
es
po
nd
en
TABLE 4 Inflation Measures
2011 2012 2013 2014
Annual Change
% % % %
Consumer Price Index 2.6 1.7 1.5 1.7
Personal Consumption Deflator 1.5 1.8 1.3 1.5
HICP 1.1 2.0 1.7 1.9
5
Public Finances
The outlook for the public finances has improved on the back of the sale of some government investments and the promissory note deal. In the short term the impact will be most obvious on the exchequer borrowing requirement. However, it is the outlook for the general government balance that is much more important. The new Government Finance Statistics release from the CSO, which will provide quarterly details on the General Government Balance (GGB), will be a useful aid to forecasting the public finances in a way that is consistent with the national accounts. This new release shows that the GGB in 2012 was €12.5 billion, equivalent to 7.6 per cent of nominal GDP. Based on these numbers the fiscal target was exceeded by 1 percentage point last year. The new release also contains data on the general government debt. At the end of last year the debt stood at €192.5 billion, 117.6 per cent of GDP.
Since the last Commentary, a deal on the promissory notes was agreed in February 2013. The transaction replaces the promissory notes with long-term government bonds. This represents a significant alleviation of short-term funding requirements for Ireland and should enhance debt sustainability. Overall, the deal has a small negative impact on the public finances in 2013. For 2013, costs associated with the liquidation of Irish Bank Resolution Corporation (IBRC) and accrued interest on the promissory notes are expected to be marginally higher than the net interest savings of €1.1 billion brought by the deal. Since the repayment schedule for the promissory notes involved various payments between state institutions, the bulk of interest payments involved would ultimately have been returned to the exchequer. However, the funding requirements of the promissory notes payment schedule were substantial, and despite the circular nature of the interest payments to the IBRC, the interest expenditure was counted in the headline General Government Balance each year. The impact is expected to be more substantial in 2014 and subsequent years, reducing the general government deficit by approximately €1 billion.
TABLE 5 Public Finances, National Accounts
2010 2011 2012 2013 2014
€ bn € bn € bn € bn € bn
Revenue 55.1 55.4 56.6 57.5 59.8
Expenditure 103.4 76.5 68.8 69.6 67.8
General Govt. Balance -48.3 -21.3 -12.5 -12.1 -8.0
As % of GDP -30.8 -13.4 -7.6 -7.2 -4.6
6
The Labour Market
Signs of moderate improvements in the labour market have been emerging in recent months, but the underlying changes suggest continued stabilisation rather than a shift of momentum. Updated labour market data from the third quarter of 2012 saw the unemployment rate revised down slightly to 14.6 per cent, before falling further to 14.2 per cent for the final three months. While net emigration remains the primary driver of reduced unemployment at present, the latest
Quarterly National Household Survey (QNHS) included the first annual increase of
employment in over four years. However, the increase was small (0.1 per cent), and on a seasonally adjusted basis there was a marginal decrease compared to the same period in 2011.
Indications of improvement were stronger for unemployment, where an annual fall in seasonally adjusted unemployment for the third quarter was revised up to 4,300. Significantly, this was followed by 18,600 fewer people unemployed in the final quarter, compared to the same period in 2011. As shown in Figure 4, long-term unemployment fell in Quarter 4, 2012, by just under 20,000 – encouragingly, this exceeded the corresponding total fall in unemployment.
FIGURE 4 Annual Change in Long-term Unemployment, 2006 Q1 – 2012 Q4
Source: Central Statistics Office.
-40 -20 0 20 40 60 80
Q1 Q2 Q3 Q4 Q1 Q2 Q3 Q4 Q1 Q2 Q3 Q4 Q1 Q2 Q3 Q4 Q1 Q2 Q3 Q4 Q1 Q2 Q3 Q4 2007 2008 2009 2010 2011 2012
000s
Some caution is due in relation to the latest QNHS data, however, as it is the first survey conducted using a partly adjusted sample of households, based on the 2011
Census of Population. This incremental adjustment ensures that the survey remains
representative, and is phased in over time. Based on past sensitivity to such changes, the last QNHS notes that estimates for agricultural employment may have been particularly affected. The survey shows this sector growing by 6,000 (7.1 per cent) compared to the previous quarter. Excluding agriculture entirely, the annual fall in total employment for the fourth quarter of 2012 was 10,600 on a seasonally adjusted basis, as shown in Figure 5. The continued underlying fall in non-agricultural employment is a less encouraging finding than the main results suggest.
FIGURE 5 Annual Change in Employment and Unemployment, 2011 Q1 – 2012 Q4
Source: Central Statistics Office.
Employment and unemployment last year fell by 11,200 and 600, respectively. The labour force contracted by 12,000, while the participation rate fell from 60.2 per cent to 59.9 per cent. Overall, we forecast the labour market to improve in 2013, with the annual rate of unemployment falling to 14.2 per cent. Looking ahead to next year, we expect continued emigration to reduce both the level of unemployment and the size of the labour force, with the unemployment rate falling further to below 14 per cent (Table 6).
2012 saw the largest falls for construction and industry employment, with the biggest increases by sector in information and communication, accommodation and food, and health and social work activities. We expect some tentative recovery for industry and construction this year and next year, while health and social work,
-60.0 -50.0 -40.0 -30.0 -20.0 -10.0 0.0 10.0 20.0 30.0
Q1 Q2 Q3 Q4 Q1 Q2 Q3 Q4
2011 2012
000s
Change in Employment
which has increased employment by 27,400 since 2007, is not expected to continue to expand.
By broad occupational group, shares of total employment increased moderately for professionals, managers, directors and senior officials, and associate professionals and technical employment during 2012. As shown in Figure 6, many of the changes seen since 2007 were amplified last year, while a disproportionate reduction has been ongoing for skilled trades and elementary employment during the last five years.
FIGURE 6 Change in Percentage of Total Employment, by Broad Occupational Group
Source: Central Statistics Office.
Table 6 summarises the labour market profile for 2011-2014, with total employment expected to increase in 2013 by over 3,400, before increasing by a further 6,600 in 2014. The downward path of unemployment that began in the third quarter of 2012 is forecast to continue in 2013 and 2014, falling to below 300,000 next year. Following a decrease of 11,000 in 2012, the labour force is forecast to continue to decline at a slower rate, while the labour force participation rate is expected to remain below 60 per cent.
-8.0 -6.0 -4.0 -2.0 0.0 2.0 4.0 6.0 Professionals
Associate professional and technical Managers, directors and senior officials Caring, leisure and other services Sales and customer service Process, plant and machine operatives Administrative and secretarial Elementary Skilled trades
% of Total Employment
[image:26.595.74.523.286.543.2]TABLE 6 Employment and Unemployment
Annual Averages, 000s
2011 2012 2013 2014
Agriculture 83 86 84 84
Industry 348 336 338 344
of which: Construction 108 102 102 104
Services 1,414 1,415 1,418 1,420
Total at work 1,849 1,839 1,842 1,849
of which: non-agri. employees 1,534 1,526 1,534 1,546
self employed 293 289 285 280
Unemployed 317 316 305 298
Labour Force 2,166 2,155 2,148 2,147
Unemployment Rate, % 14.6 14.7 14.2 13.9
Participation Rate, % 60.4 60.2 59.9 59.9
Net Migration -27.4 -34.4 -32.0 -22.0
7
Imports and the Balance of Payments
Imports
The weakness of domestic economic activity is reflected in import growth.
Quarterly National Accounts from the CSO show that imports grew by 0.3 per
cent in 2012 in volume and by 4.4 per cent in value. Thus, the deflator for imports of goods and services was 4.1 per cent. The data also show a similar pattern to that of exports – imports of goods remained flat for most of 2012, resulting in an annual average decline of 2.8 per cent. In contrast, imports of services averaged 2 per cent growth in 2012.
Goods imports are forecast to grow moderately this year, at 1.0 per cent, as activity in the domestic economy starts to improve. With personal consumption continuing to be weak, growth in goods imports will reflect increasing imports of capital goods and of materials. With households continuing to deleverage and to save, and with growth in incomes remaining low it seems likely that tourism spending abroad will be unchanged in 2013 before starting to grow again in 2014. Other service imports are forecast to show strong growth, broadly in line with service export growth. Thus, we are forecasting that overall growth in imports of goods and services will amount to 2.3 per cent in 2013 and 4.3 per cent in 2014.
TABLE 7 Imports of Goods and Services, Percentage Change, Volume
2011 2011 2012 2013 2014
Value,
€bn % % % %
Merchandise 48.3 -2.3 -2.8 1.0 3.0
Services:
Tourism 5.0 -7.2 0.5 0.0 1.0
Other Services 78.2 1.4 2.0 3.2 5.3
Total Services 83.2 0.8 2.0 3.0 5.0
Imports of goods and services 131.9 -0.3 0.3 2.3 4.3
Note: Value of total imports of goods and services includes FISM adjustment. Source: Central Statistics Office and ESRI Forecasts.
Balance of Payments
multinationals which relocated their Head Office to Ireland, but none of their productive activities.
TABLE 8 Balance of Payments
2011 2012 2013 2014
€bn €bn €bn €bn
Exports of goods and services 166.8 177.1 185.9 198.9
Imports of goods and services 131.9 137.6 143.3 152.0
Net factor payments -31.8 -30.0 -32.4 -35.4
Net transfers -1.2 -1.2 -1.3 -1.3
Balance on current account 1.8 8.1 8.8 9.7
as a % of GNP 1.4 6.1 6.4 6.9
Source: Central Statistics Office and ESRI Forecasts.
The forecasts for exports and imports indicate that the surplus on trade in goods and services will grow moderately, especially in 2013. Taking account of our forecasts for the various inflows and outflows that comprise the balance of payments, which includes higher national debt interest, we are expecting that the current account surplus will amount to 8.8 billion this year and 9.7 billion next year. This is equivalent to 6.4 and 6.9 per cent of GNP in 2013 and 2014 respectively.
8
Monetary Sector Developments
Bank Funding
Despite ongoing issues with the eurozone banking system that remain unresolved, the funding environment for Irish banks has been easing somewhat. The September 2012 intervention by the European Central Bank (ECB) outlining its facility for outright monetary transactions has been a catalyst for strengthening sovereign bond markets throughout Europe. Analysis of the domestic banking sector data suggests that bank funding on the deposit side has continued its improvements into early 2013. Some progress towards necessary reforms at European level has been made to date, and the EU’s decision to establish a single supervisory mechanism in March has aided the improved funding conditions.
Improvements in confidence assisted the continued stability in deposit funding at the covered Irish banks throughout 2012 and in early 2013. Customer deposits (both resident and non-resident) increased in the final three months of 2012, to just under €160 billion in value, some €10 billion above the level at end-2011. The weighted average interest rate of term deposits for households and Non-Financial Corporations (NFCs) in Irish resident banks has fallen by 62 basis points between April 2012 and March this year, as shown in Figure 7. The spread between Irish resident banks’ interest rates and eurozone counterparts on such deposits has more than halved compared to the first half of 2012, down to 31 basis points.
In February, a transaction was undertaken to effectively replace Emergency Liquidity Assistance (ELA) with long-dated government bonds, facilitated by the special liquidation process of the Irish Bank Resolution Corporation (IBRC) and
retirement of the government-issued Promissory Notes.1 This transaction has
resulted in the halving of total liquidity assistance as reported in the Money and
Banking Statistics of the Central Bank of Ireland (see Figure 8). Total Eurosystem
borrowing is down to €43 billion as of February, and while still substantial, this represents a reduction of 73 per cent from the €159 billion peak two years before, in part due to the removal of ELA, however the non-ELA component has also been decreasing, down by 54 per cent from peak in January 2011.
1 For details of this transaction, see the Department of Finance’s February release of “Transaction Overview”:
FIGURE 7 Average Household and NFC Deposit Rates*
*Average for deposits outstanding with agreed maturity. Source: ECB Bank Lending Survey 2012.
FIGURE 8 Emergency Liquidity Measures
Source: Central Bank of Ireland, Money and Banking Statistics. 1.5 2 2.5 3 3.5 4 4.5 5 Ja n Ma r Ma y Jul
Sep Nov Jan Ma
r
Ma
y Jul
Sep Nov Jan Ma
r
Ma
y Jul
Sep Nov Jan Ma
r
Ma
y Jul
Sep Nov Jan Ma
r
Ma
y Jul
Sep Nov Jan Ma
r
Ma
y Jul
Sep Nov Jan Ma
r
2007 2008 2009 2010 2011 2012 '13
%
Ireland Euro area
0 20,000 40,000 60,000 80,000 100,000 120,000 140,000 160,000 180,000
Jan Mar May Jul Sep Nov Jan Mar May Jul Sep Nov Jan Mar May Jul Sep Nov Jan Mar May Jul Sep Nov Jan Mar May Jul Sep Nov Jan Mar May Jul Sep Nov Jan Mar
2007 2008 2009 2010 2011 2012 '13
€ 000s
An increasing ability of Irish banks to obtain conventional market funding is improving the prospects for a phased reduction in usage of Eurosystem facilities, and this effort has been boosted by February’s transaction involving the IBRC liquidation. Parallel efforts to gradually re-enter markets with timely government bond issuances have been mutually beneficial for both the banks’ and the sovereign’s creditworthiness. The covered banks have demonstrated their market access through the issue of covered bonds and term repos. Elsewhere, banks have continued to reduce costs aside from those related to wholesale funding channels. The costly Eligible Liabilities Guarantee Scheme (ELG) was discontinued since end-March of this year, and this may lead to a reduction in net interest margins. Reduced operating costs are also progressing and deleveraging targets look likely to be met in 2013.
Despite some positive developments for funding, a growing challenge for profitability faced by banks concerns the increasing volume of non-performing loans and rising mortgage arrears, and the subject has become a focus of intense scrutiny in recent months (see Gerlach-Kristen, this issue). Officials from the Central Bank of Ireland have been particularly vocal in their criticism of banks’ efforts to contain the growth of lending arrears, amid concerns that the incentives encouraging strategic default are not being addressed. The underlying issue remains difficult to address without improvement in the domestic economy, as growth in employment and earnings would likely assist households and businesses to meet their loan repayments. In the present context, many factors are holding back recovery for the banking sector. The likely extent of further recapitalisations required will be revealed in the coming year when the results of the next Prudential Capital Assessment Review (PCAR) are published.
Recent Lending Developments
FIGURE 9 Net Lending to Households, 2011 Q1 – 2013 Q1: Total net lending, net lending for all house
purchases, and for net lending principal dwelling purchases
Source: Central Bank of Ireland, Money and Banking Statistics.
One explanation for this pattern of deleveraging in lending for house purchases is the discontinuation of mortgage interest tax relief at the end of 2012. Prospective housebuyers seeking to avail of this facility before its withdrawal would have put upward pressure on net lending for house purchases, despite the broad delevaraging that has been ongoing for households and businesses (Table 10).
Data on lending to Irish resident Small and Medium Enterprises (SMEs) shows continued reductions throughout 2012. The most recent data shows a 2.8 per cent fall for the final quarter last year, and the average for the year as a whole also showed a decline of 2.8 per cent, the pace of reduction moderated from 6.6 per cent average annual decline in 2011. ‘Core’ lending saw a 5.0 per cent fall in the fourth quarter of 2012, as lending to the sectors outside of financial intermediation, construction and real estate activities continues to decrease faster than the total. As with the total, these figures show a slowing pace of decline relative to the falls seen in 2011, but the picture remains one of continuing decline in SME lending activity, although some degree of variation by sector is evident, as discussed further in a Research Note (O’Toole, Gerlach-Kristen and O’Connell, this issue).
-1,600 -1,400 -1,200 -1,000 -800 -600 -400 -200 0 200
Q1 Q2 Q3 Q4 Q1 Q2 Q3 Q4 Q1
2011 2012 '13
€ million
Net Lending for Principal Dwelling Purchases (to Q4, 2012) Net Lending for All House Purchases
TABLE 10 Lending to Irish Households and Irish Resident SMEs (% Change, Year-on-Year)
Irish Household Lending Small and Medium Enterprise Lending
End-Month All Lending For House Purchases Consumer Credit Total Total excl. Financial
Intermediation
Total excl. Financial Intermediation & Property Related
Sectors
2010 Mar -2.0 0.6 -10.6 - - -
Jun -3.1 -0.1 -11.7 - - -
Sep -3.7 -0.9 -12.7 - - -
Dec -4.7 -1.4 -19.9 - - -
2011 Mar -4.2 -2.0 -13.7 -8.8 -11.3 -9.2
Jun -3.9 -2.2 -14.4 -9.1 -12.5 -10.6
Sep -4.0 -2.5 -13.7 -5.4 -8.2 -8.9
Dec -3.6 -2.5 -6.9 -3.0 -5.4 -6.2
2012 Mar -3.9 -2.4 -11.6 -3.9 -4.9 -6.3
Jun -3.7 -2.2 -11.1 -1.7 -2.9 -4.6
Sep -3.7 -2.0 -10.7 -2.7 -4.1 -4.9
Dec - 3.9 - 1.6 - 11.9 -2.8 -4.1 -5.0
2013 Jan - 4.0 - 1.8 - 12.3
Feb - 4.2 - 1.8 - 11.9
Mar - 4.1 - 1.7 - 12.1
9
General Assessment of the Irish Economy
The preliminary National Accounts for 2012 show that real GDP grew by 0.9 per cent in the year. As has been the case over the past number of years, this growth was due to increased exports. Furthermore, within this component we have seen export growth in recent years driven predominately by the service sector. There were some indications of an improvement in the labour market in the latter half of 2012 and inflation has remained low.
Despite some remaining uncertainties about the strength of the international economy, it seems likely that growth in output and employment in Ireland will continue in 2013 and 2014, with real GDP projected to grow by 1.8 per cent this year and by 2.7 per cent in 2014. On the assumption that these growth rates are realised, we expect that employment will increase in both 2013 and 2014, leading to a reduction in the unemployment rate to an annual average just below 14 per cent in 2014. Indeed, unemployment (both short and long term) began to fall towards the end of last year, although our analysis of employment levels suggests an underlying fall has persisted until now.
Forecasts of growth in the Irish economy are based on forecasts showing the European economy returning to growth in 2014. This is a crucial assumption for our forecast as exports are the main contributor to Irish economic growth at present. In recent years forecasts for economic growth in Ireland’s main trading partners has been consistently revised downwards. For example, over the course of the past two years, forecasts for world economic growth have been revised from expected growth of approximately 4 per cent in 2013 to current forecasts of 3.3 per cent. As outlined in the International section, the expectation at present is that growth in the world economy will pick up in 2014. Associated with this is a pick-up in import volumes which should underpin the forecast growth in Irish exports. If the anticipated international upturn does not occur, then the outlook for the Irish economy is less positive than we have forecast in this Commentary.
Irish economic activity and assumes that the planned consolidation is implemented. Even at the end of the consolidation process a deficit will remain, and in addition measures are needed to reduce the general government debt, estimated at 123 per cent of GDP in 2013 with associated interest costs of €8.2 billion. As we have emphasised above, the Irish economy remains reliant on the international environment as a driver of growth. Given the uncertainty that surrounds the international outlook it remains necessary to implement the consolidation measures as planned in forthcoming budgets. By doing so the deficit will be reduced and the public finance contraction will not weigh as heavily on the domestic economy.
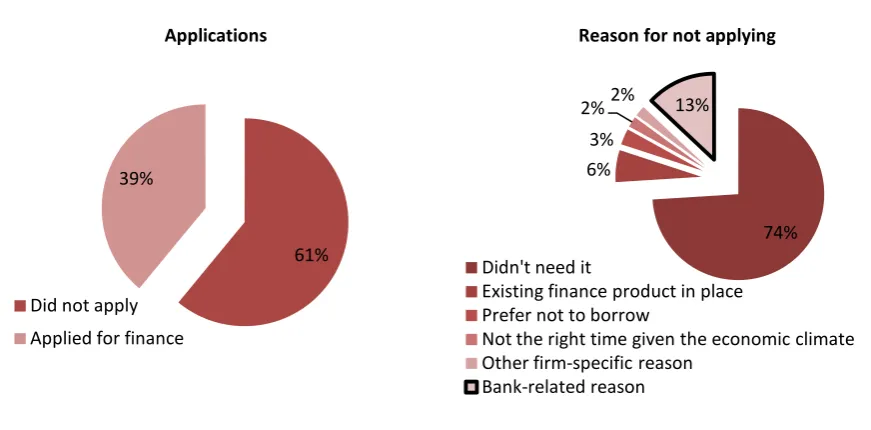
Although the outlook is for an upturn in growth, we continue to have some concerns about the weakness in the domestic economy. O’Toole et al. (this issue) analyse the impact of credit constraints on Irish SMEs and find that, by the latter half of last year, credit constraints were affecting only one in nine Irish SMEs. However, if economic growth starts to pick-up as forecast there is a concern that the capacity of the banking system will not be adequate to deal with an upturn in demand for credit by Irish SMEs.
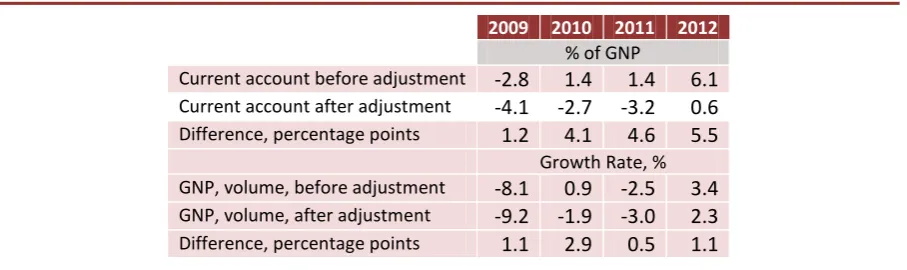
The analysis in the accompanying research note (FitzGerald, this issue) suggests a somewhat different performance by the Irish economy in recent years than has been previously estimated. This is the result of a number of international companies redomiciling into Ireland. Although these companies have only a limited presence in Ireland, their profits earned outside Ireland represent a significant income inflow. This has the effect of reducing the negative net factor income flow (profit outflows from multinationals based in Ireland), which in turn raises the current account surplus and GNP growth rate. Adjusting GNP to take account of the impact of these redomiciled plcs indicates that the contraction in the Irish economy was deeper in 2009 that previous measures indicated. Furthermore it indicates that the Irish economy actually contracted in 2010, rather than showing moderate GNP growth. GNP growth in 2012 was correspondingly lower than official estimates, by approximately 1 percentage point. If the pattern persists then adjusted GNP growth in 2013 and 2014 will be lower that the forecasts set out in this Commentary.
FORECAST TABLE A1 Exports of Goods and Services
2011 % change in 2012 2012 % change in 2013 2013 % change in 2014 2014
€ bn Value Volume € bn Value Volume € bn Value Volume € bn
Merchandise 84.9 1.8 -2.8 86.4 2.0 0.0 88.1 3.6 2.3 91.3
Tourism 3.3 -3.2 -4.9 3.2 3.3 2.0 3.3 5.4 3.8 3.5
Other Services 78.2 11.4 9.3 87.0 7.9 5.9 93.9 10.1 8.2 103.5
Exports Of Goods and Services 166.3 6.2 2.9 176.6 4.9 3.0 185.3 7.0 5.3 198.2
FISM Adjustment 0.5 0.5 0.6 0.0 0.6
Adjusted Exports 166.8 6.2 2.9 177.1 4.9 3.0 185.9 7.0 5.3 198.9
FORECAST TABLE A2 Investment
2011 % change in 2012 2012 % change in 2013 2013 % change in 2014 2014
€ bn Value Volume € bn Value Volume € bn Value Volume € bn
Housing 3.9 -17.9 -16.8 3.2 -3.9 -5.7 3.1 10.5 6.3 3.4
Other Building 4.5 3.8 2.5 4.7 4.6 3.0 4.9 6.8 5.2 5.3
Transfer Costs 0.4 18.6 12.8 0.4 7.1 3.0 0.5 10.2 6.0 0.5
Building and Construction 8.8 -5.2 -5.6 8.3 1.5 -0.4 8.5 8.4 5.7 9.2
Machinery and Equipment 7.3 11.0 9.6 8.1 5.6 3.8 8.6 7.3 5.4 9.2
FORECAST TABLE A3 Personal Income
2011 % change in 2012 2012 % change in 2013 2013 % change in 2014 2014
€ bn % €bn € bn % €bn € bn % €bn € bn
Agriculture, etc 3.2 -8.0 -0.3 3.2 7.5 0.2 3.2 8.5 0.3 3.5
Non-Agricultural Wages 67.8 0.6 0.4 68.1 1.8 1.2 69.4 2.3 1.6 70.9
Other Non-Agricultural Income 11.5 17.0 2.0 13.9 3.2 0.4 13.9 8.0 1.1 15.0
Total Income Received 82.5 2.5 2.1 84.6 2.2 1.9 86.5 3.4 3.0 89.5
Current Transfers 25.8 -2.5 -0.6 25.2 -0.4 -0.1 25.1 -0.1 0.0 25.1
Gross Personal Income 108.4 1.3 1.4 109.8 1.6 1.8 111.5 2.6 3.0 114.5
Direct Personal Taxes 22.4 2.4 0.5 23.0 3.5 0.8 23.8 4.3 1.0 24.8
Personal Disposable Income 85.9 1.1 0.9 86.8 1.1 0.9 87.8 2.2 1.9 89.7
Consumption 81.3 0.8 0.7 82.0 0.9 0.7 82.7 1.9 1.5 84.3
Personal Savings 4.6 5.0 0.2 4.9 4.3 0.2 5.1 7.7 0.4 5.5
Savings Ratio 5.4 5.6 5.8 6.1
Average Personal Tax Rate 20.7 20.9 21.3 21.7
FORECAST TABLE A4 IMPORTS OF GOODS AND SERVICES
2011 % change in 2012 2012 % change in 2013 2013 % change in 2014 2014
€ bn Value Volume € bn Value Volume € bn Value Volume € bn
Merchandise 48.3 3.6 -2.8 50.0 3.0 1.0 51.5 5.1 3.0 54.1
Tourism 5.0 -0.9 0.5 5.0 1.5 0.0 5.1 3.5 1.0 5.2
Other Services 78.2 5.2 2.0 82.3 4.9 3.2 86.3 7.1 5.3 92.4
Imports of Goods and Services 131.5 4.4 0.3 137.3 4.1 2.3 142.9 6.2 4.3 151.8
FISM Adjustment 0.3 0.4 0.4 0.4
FORECAST TABLE A5 Balance of Payments
2011 2012 2013 2014
€ bn € bn € bn € bn
Exports of Goods and Services 166.8 177.1 185.9 198.9
Imports of Goods and Services 131.9 137.6 143.3 152.2
Net Factor Payments -31.8 -30.0 -32.4 -35.4
Net Transfers -1.2 -1.2 -1.3 -1.3
Balance on Current Account 1.8 8.1 8.8 9.7
As a % of GNP 1.4 6.1 6.4 6.9
FORECAST TABLE A6 Employment and Unemployment, Annual Average
2011 2012 2013 2014
000s 000s 000s 000s
Agriculture 83 86 84 84
Industry 348 336 338 344
Of which: Construction 108 102 102 104
Services 1414 1415 1418 1420
Total at Work 1849 1839 1842 1849
Unemployed 317 316 305 298
Labour Force 2166 2155 2148 2147
ESRI Research Note 2013/1/2
The Effect of Redomiciled Plcs on GNP
and the Irish Balance of Payments
John FitzGerald
*Introduction
Over the last few years a number of companies have relocated their headquarters to Ireland without generating any real activity in the economy in terms of employment or purchases of domestic inputs. These companies, referred to technically as redomiciled plcs, hold major investments elsewhere in the world but they have established a legal presence in Ireland. This means that their profits are paid to them in Ireland even though, under double taxation agreements, their tax liability arises in other jurisdictions. While they receive large profits in Ireland, because they are headquartered here, they pay out only some of these profits to their shareholders abroad when they declare a dividend. The retained earnings in Ireland enhance the value of the companies. As a result, the recorded inflows into the economy which these firms generate are much larger than the recorded
outflows1. However, the benefits of the retained profits of redomiciled plcs are
attributed to their foreign owners – there is no benefit to the Irish economy. Nonetheless, this has the effect of raising the measured current account surplus in the Balance of Payments and increasing the level of nominal GNP arising in Ireland.
National Accounting Treatment
The treatment of these redomiciled plcs in the national accounts differs from the treatment of the profits of many of the multinationals already operating in the Irish economy in the manufacturing or services sector because, crucially, these latter multinationals are not headquartered in Ireland. These latter multinational firms also generate very substantial profits in Ireland; however, these profits are entirely attributed to their foreign owners. They also generate major activity in the economy through employment, payment of tax and purchase of Irish goods and services. Even if the profits of the multinationals operating in manufacturing or services do not flow back out as dividends, but are instead retained as earnings, they are still treated as an outflow in the current account of the balance of payments (as reinvested earnings). Thus, while the profits of these companies raise GDP, the “reinvested earnings” are deducted to calculate GNP. This means that the substantial benefit to the Irish economy which arises from the activities of these companies as employers or taxpayers is fully accounted for but the
profits, which are due to their foreign owners, are excluded from GNP and the current account balance.
As discussed in the winter 2012 Quarterly Economic Commentary, redomiciled plcs, which are engaged in investing in global financial assets, have grown very rapidly in importance from a relatively low level in 2008. This growth may have been partly driven by expectations of changes in the tax code in other jurisdictions. Whatever the reason, they are now exerting a major impact on the Irish national accounts and on the current account of the balance of payments.
TABLE 1 Net Profit Flows for Redomiciled Plcs., € million
2009 2010 2011 2012
Undistributed Profits 1563 5177 5715 7396 As % of GDP 1.0 3.3 3.6 4.5 As % of GNP 1.2 4.0 4.5 5.5
Source: Author’s calculations based on CSO Balance of Payments data and consultations with the CSO.
Set out in Table 1 is an estimate of the undistributed profits of these companies between 2009 and 2012. As can be seen from the Table, from 2009 onwards there was a dramatic rise in the profits of these companies. While the dividends paid out have averaged just under 30 per cent of the total, these retained earnings are very large. As shown in Table 1, by 2012 they amounted to 5.5 per cent of GNP.
FIGURE 1 GNP adjusted for undistributed profits of redomiciled Plcs.
60000 70000 80000 90000 100000 110000 120000 130000 140000 150000
1995 1997 1999 2001 2003 2005 2007 2009 2011