Exploring Tax and Welfare
Options
T. Callan, B. Colgan,
M. Savage, J.R. Walsh
June 201
5
BUDGET PERSPECTIVES 201
6
Exploring Tax and Welfare
Options
T. Callan, B. Colgan, M. Savage, J.R. Walsh
BUDGET PERSPECTIVES 2016
PAPER 1
June 2015
Available to download from
The ESRI
The Economic Research Institute was founded in Dublin in 1960, with the assistance of a grant from the Ford Foundation of New York. In 1966 the remit of the Institute was expanded to include social research, resulting in the Institute being renamed The Economic and Social Research Institute (ESRI). In 2010 the Institute entered into a strategic research alliance with Trinity College Dublin, while retaining its status as an independent research institute.
The ESRI is governed by an independent Council which acts as the board of the Institute with responsibility for guaranteeing its independence and integrity. The Institute’s research strategy is determined by the Council in association with the Director and staff. The research agenda seeks to contribute to three overarching and interconnected goals, namely, economic growth, social progress and environmental sustainability. The Institute’s research is disseminated through international and national peer reviewed journals and books, in reports and books published directly by the Institute itself and in the Institute’s working paper series. Researchers are responsible for the accuracy of their research. All ESRI books and reports are peer reviewed and these publications and the ESRI’s working papers can be downloaded from the ESRI website
The Authors
Tim Callan is a Research Professor , Brian Colgan is a Research Assistant, Michael Savage is a Research Analyst and John R. Walsh is a Senior Research Analyst at the Economic and Social Research (ESRI).
Acknowledgements
Helpful comments were received from two referees, and from ESRI colleagues. Particular thanks are due to Frances Ruane, Emer Smyth, Helen Russell, Bertrand Maître and Dorothy Watson. We are grateful to Tom McMahon, Caitríona O’Brien and Patrick Foley for access to the SILC Research Microdata Files.
Table of Contents
Abstract ... 1
1. Introduction ... 2
2. Assessing the Distributional Impact of Tax and Welfare Policy Changes ... 5
3. Distributional Impacts of Changes in Tax, USC and Welfare Policy Parameters ... 8
4. Exploring Options for Budget 2016 ... 15
4.1 Potential Tax and Welfare Packages ... 16
4.2 Tax and USC: Budget 2015 Strategy vs Cut in 7 per cent USC Rate ... 18
4.3 Cutting the Main USC Rate With or Without Tax Indexation ... 19
5. Tax, Welfare and Labour Supply: Identifying the Influences ... 20
6. Conclusions ... 22
Exploring Tax and Welfare
Options
Abstract
Budgetary policies on income-related taxes and welfare must find a balance between providing income support to those in need and maintaining a financial incentive to work which supports high employment. This paper focuses principally on the “cash” or “first round” impact of tax and welfare policy changes across the income distribution. Incentive issues are considered in Section 5 of this paper, and in a companion paper to this conference (Savage et al., 2015).
Our analysis finds that cuts in the top rates of tax and USC would have a strong impact on households with incomes in the top 10 per cent, but little effect on households at low and middle income levels. Tax reductions via the standard rate of income tax would lead to percentage gains in income which were greatest for middle- and upper-middle-income households. Reductions in the “main” 7 per cent rate of USC would see the greatest percentage gains go to the upper middle reaches of the income distribution, but with some benefits for the middle. Increases in welfare payments would lead to gains which were greatest in percentage terms for households in the bottom half, and especially the poorest 30 per cent, of households.
In our analysis, several possible budgetary packages have been constructed which are consistent with the Spring Economic Statement, and with stated government intentions regarding cuts in the main (7 per cent) rate of USC. These packages are not predictions of what we expect will actually happen in Budget 2016, nor are they recommendations. Rather, they are intended to give some sense of what types of package might be possible within the overall “fiscal space” indicated by the Spring Economic Statement.
1.
I
NTRODUCTIONFollowing a long period of recession and austerity, economic conditions have begun to improve. The government’s Spring Economic Statement (Department of Finance, 2015a) indicates that “fiscal space” of between €1.2 billion and €1.5 billion will be available “for tax reductions and investment in public services”. The macroeconomic issues1 concerning the appropriate use of this “fiscal space” have
been considered recently in Duffy et al. (2015, Quarterly Economic Commentary) who argue for a broadly neutral fiscal stance. Here we examine some tax and welfare options for 2016, in the light of the policy direction set out in the Spring Economic Statement. In this paper and within this broad context, we focus mainly on “cash” or “first-round” distributional impacts (Sections 2, 3 and 4).2 Tax and
welfare changes also affect financial incentives to work, such as replacement rates and marginal tax rates. Individuals may then adjust their decisions on labour market participation and hours of work in the light of such changed incentives. In Section 5 we discuss how labour supply responses to changed incentives arising from tax and welfare reforms could be examined in a framework which integrates both distributional and incentive concerns. Work incentive issues are also examined in Savage et al. (2015b), our companion paper to this conference. Our main findings are summarised in Section 6.
The “fiscal space” calculations for 2016 are based on what might be termed the “conventional opening budget” under which tax parameters and welfare payment rates are frozen in nominal terms. This does not take account of the fact that, unless tax bands and credits are indexed in line with nominal wage growth, average tax rates would tend to rise as incomes grow because of the progressivity of the income tax and USC systems. The nature of this “fiscal drag”, and its implications for the assessment of distributional implications of tax and welfare policy are considered in Section 2. It should be noted that the Stability Programme Update (Department of Finance, 2015b) does make allowance for the costs of indexing the taxation system in line with expected earnings growth in its projections for 2017-2020.3
Section 3 then considers the distributional profile associated with some of the key elements of the tax and welfare systems, i.e.,
• changes in the standard and higher rates of tax,
• widening of the standard rate band,
1 These broader issues include the sustainability of the public finances and emerging pressures related to demographic
and other changes.
2 For examples of analyses in a similar framework see HM Treasury (2014), Congressional Budget Office (2013). 3 “There is a technical assumption of indexation of the income tax system of around 2 per cent, the medium-term
• increases in the personal tax credit,
• changes in USC rates,
• changes in welfare payment rates in respect of working-age schemes, pensions, and child-related payments.
The “ready reckoner” provided by Revenue in advance of the budget gives the aggregate costs of such policy changes in the tax area. The analysis here complements that with information on the distributional implications, which can be used to guide the construction of policy packages. These distributional implications are identified using SWITCH, the ESRI tax-benefit model, which is based on anonymised data from a large-scale national survey of households from the CSO’s Survey on Income and Living Conditions (SILC). This ensures that a representative picture is obtained, something which is not possible when considering only selected example households, as such analysis fails to take into account how common or uncommon these household types are in the population.
Section 4 considers some key issues that government will face in the construction of a package of tax and welfare measures for Budget 2016. We sharpen the focus by contrasting particular choices, such as a continuation of Budget 2015’s strategy – a top rate tax cut, modified by a new, increased rate of USC on high incomes – versus a focus on cuts in the “standard” USC rate applying over a wide range of income. We also consider how the overall shape of a tax welfare package may be influenced by the parameters already set down in the Spring Economic Statement, including a 50-50 balance between tax cuts and expenditure increases.
Section 5 reconsiders some earlier research which examined how labour supply decisions of husbands and wives4 are influenced by changes in tax rates, tax
bands and tax structure. The approach taken is one which uses detailed information on the budget constraints facing the couples to estimate their current labour supplies, and simulate their reaction to alternative forms of tax cut or tax restructuring. Despite the fact that the datasets on which this approach has been implemented are from an earlier time, the results are a useful illustration of the type of analysis which is needed to provide accurate answers to questions concerning labour supply responses.
4 The research, based on 1994 data, dealt with married couples because of the particular issues arising from the tax
Before we turn to the detail of our analysis, it is helpful to consider one broad contextual issue. Ireland now has three substantial income-related taxes: income tax, pay-related social insurance contributions (PRSI) and the Universal Social Charge.5 Many countries have two major income-related taxes; an income tax
and an earnings-based social insurance contribution, with employers and employees both making contributions.6 Denmark is an exception to this rule,
with social benefits financed wholly by taxation.7 However, in most countries the
coexistence of social insurance contributions along with income tax is a well-established and stable configuration. Ireland’s current three-part system is therefore a highly unusual one. In our view, simplicity and transparency would argue for a system in the long run with two income based taxes, as used in most developed countries, rather than three as at present. This is not a question of simply abolishing USC but rather of raising the same revenue in a different way. The reason it was introduced was not just that there was a temporary emergency but that tax revenues had been reduced in the boom and bubble periods below long-run levels compatible with the demand for public services.8 Such reductions
were made possible in the bubble period because of temporary windfalls from property-related and capital gains taxes (Honohan, 2009). The introduction of the USC was a response to the disappearance of such revenues. The structure of the USC differs from the income tax system in that it has a broader base, few exemptions or allowances, and a less progressive structure. A key question for policy in the coming years is whether a three-part system is to be retained indefinitely, or whether, in the longer run, USC and income tax should be “blended” into a single system. Whatever the desired long-term structure, year-by-year policy decisions should build towards that long-term outcome. While there is only limited room for manoeuvre in any individual budget, better results can be obtained if year-to-year choices are guided by longer term strategic goals. This would also have the effect of reducing uncertainty about the broad income tax system. Such an approach could be seen as having operated very successfully in the Budgets in the late 1990s.
5 For a review of Irish government revenues since the financial crisis see Hickey and Smith (2015).
6 While there may be short-run consequences of changes in the balance between employer and employee
contributions, economic theory suggests that the long-run incidence – the real question of who pays the contribution – depends on supply and demand factors rather than on who is formally required to pay.
7 Some in the UK argue (Adam, et al., 2010) have also argued that income tax and national insurance contributions
should be combined in a single tax.
8 The Minister for Finance (2015a) stated that “given that it [USC] raises over €4 billion per annum for the Exchequer, it
2.
A
SSESSING THED
ISTRIBUTIONALI
MPACT OFT
AX ANDW
ELFAREP
OLICYC
HANGESThe impact of any policy change must be measured against a benchmark policy, which could specify what happens under the default policy for “no policy change” or an alternative benchmark with desirable properties. The “default policy” varies both across countries and over time and can also differ as between tax and welfare and as between pensions and other welfare payments. In Ireland the “conventional opening budget” presented by government in the papers associated with Budget day is constructed on the basis that tax credits, tax bands and welfare payment rates are frozen in nominal terms. There are other ways of establishing the benchmark policy – for example, in the UK, some tax parameters are indexed in line with price inflation, while the state pension is indexed in line with the maximum of earnings growth, price inflation or 2.5 per cent.
We summarise here some previous work (Callan et al., 2006) which finds that the “conventional opening budget” has distinct shortcomings as a benchmark for measuring distributional impacts. This research shows that a policy which indexes tax and welfare parameters in line with wage growth would provide a benchmark that is neutral in macroeconomic terms (the average tax rate stays constant) and in terms of distributional impact (year on year, incomes rise at the same rate for all income groups, keeping the overall distribution of income constant). Distributional impacts measured by this benchmark are independent of what governments define to be the “no change” policy. By contrast, if the impact of policy is measured against what government defines as “no change”, then measured policy impact would depend on the government definition of this “default policy” – something which, as noted earlier, changes over time and can vary across countries.
While in recent years, wage growth and price inflation have both been close to zero, in more normal times, there is some positive price inflation9
9 It may be noted in this context that the ECB aims to maintain inflation rates below, but close to, 2 per cent over the
medium term.
adjustment to keep average tax rates constant when nominal incomes are growing.
From the point of view of distributional impact, the conventional opening budget also has serious shortcomings. If the opening budget were implemented, i.e., if tax bands, tax credits and welfare rates were frozen in nominal terms, then low income households, which depend mainly on welfare incomes, would lose both in real terms (because of price inflation) and in relative terms (compared to higher income households benefiting from increased wages). In effect, a failure to index the system would cause the distribution of income to become more unequal, and the extent of the increase in inequality would depend critically on the rate of wage growth, with faster wage growth leading to greater inequality.10
The benchmark policy used in this paper is a policy which indexes both tax and welfare parameters with respect to the expected growth or decline in wages. This ensures that average tax rates are held constant (i.e., no fiscal drag); and lead to approximately equal growth (or decline) in income across different income groups (for more details see Callan et al., 2001.). The intention here is simply to provide a “distributionally neutral” benchmark, and not to make a policy recommendation. There are many reasons why policies which depart from neutrality may be desirable. For example, if the existing income distribution is judged to be sub-optimal, or if the incentive structure inherent in the system means that the balance between distributional and incentive goals needs to be adjusted, non-neutral policies would be required.11 Nevertheless, a
distributionally neutral benchmark is essential to provide a clear view of the distributional impact of such policies, as part of a wider perspective on the overall policy impact in relation to distributional, work incentive and other goals.
Figure 1 illustrates the consequences of policies which do not provide for indexation, measured against those which do, by comparing the distributional effects when wage growth is alternatively 1 and 2 per cent. As expected, failure to index in line with (positive) wage growth leads to losses for all groups, relative to the neutral, indexed benchmark, but losses are greatest for those at low incomes and decline steadily as income rises. Losses for low income groups, relative to the neutral benchmark, are naturally greater under a higher wage growth scenario.
10 For more details see Callan et al. (2001) and Bargain and Callan (2008). Figure 1 below also illustrates the point;
measured against a benchmark which gives the same growth rate to incomes at all levels, freezing tax and welfare parameters leads to a more unequal distribution.
FIGURE 1 Impact of “Freezing” Tax and Welfare as Against Neutral, Indexed Benchmark
Source: Authors’ calculations using SWITCH, the ESRI tax-benefit model (www.esri.ie/switch).
We use forecasts of nominal wage growth (or decline) to implement this approach on a prospective basis for 2016.12 As at the time of writing, forecasts of
wage growth for 2016 range from 1 per cent (Duffy et al., 2015, ESRI Quarterly Economic Commentary) to 2.3 per cent (Central Bank Quarterly Bulletin Spring 2015). Table 1 shows the cost of indexing tax credits, tax bands and welfare payment rates in line with expected wage growth for alternative wage growth scenarios ranging from 1 per cent to 2.5 per cent, as estimated within the SWITCH model.13 For example, simply raising tax credits and tax bands in line
with wage growth of 1.5 per cent in order to keep average tax rates constant, could cost about €190 million in a full year. Similarly, raising welfare payment rates in line with wage growth of 1.5 per cent in order to maintain a broadly constant distribution of income, would cost close to €275 million.
12 Indexation in line with price inflation, when this is different from wage growth – usually lower – would not achieve
the objectives of maintaining constant average tax rates and equal growth rates in income across the distribution. If market incomes grow by the same amount at all income levels, a budget indexed in line with this growth would result in an unchanged distribution of income from one year to the next.
13 SWITCH estimates are based on data from SILC for the private household population. Some social welfare payments,
particularly pensions, also go to those living abroad or in nursing homes. Thus, the full cost of indexation of welfare payment rates would be somewhat higher.
-2.5% -2.0% -1.5% -1.0% -0.5% 0.0%
Lowest income
decile 2 3 4 5 6 7 8 9
Highest income decile
TABLE 1 Cost of Indexation under Alternative Wage Growth Scenarios
Costs of Indexation Wage Growth 1% Wage Growth 1.5% Wage Growth 2% Wage Growth 2.5%
€ million per annum
Tax credits and bands 127 188 259 311
Welfare payment rates 182 272 365 456
Total cost 309 459 623 767
Source: Authors’ calculations using SWITCH, the ESRI tax-benefit model (www.esri.ie/switch).
Taken together, the costs of indexation in line with earnings growth could be between €300 million and €800 million in a full year, depending on the rate of wage growth. This means that simply indexing the system in line with wage growth could absorb a substantial proportion of the “fiscal space” identified in the Spring Economic Statement. In our distributional analysis of Budget 2016 options in Section 4, we use the 1.5 per cent figure as a central estimate, but also explore some impacts of lower (1 per cent) and higher (2 per cent) growth rates.
3.
D
ISTRIBUTIONALI
MPACTS OFC
HANGES INT
AX,
USC
ANDW
ELFAREP
OLICYP
ARAMETERSHow are gains from tax cuts distributed across households at low, middle and high incomes? How does the method of cutting tax – via increased credits, lower rates or wider bands – influence the distributive impact? What impact do welfare payments have across the household income distribution – and does this differ depending on the age of the beneficiary?
In order to answer these questions, we look in this section at the distributive impact of changes in key parameters of the income tax, USC and welfare systems. These can be thought of as the ingredients or elements from which actual budgetary packages are made up, and an understanding of each of the ingredients helps in designing packages to achieve desired outcomes.
parameter are scaled to give an estimated reduction in income tax revenue of close to €500 million.
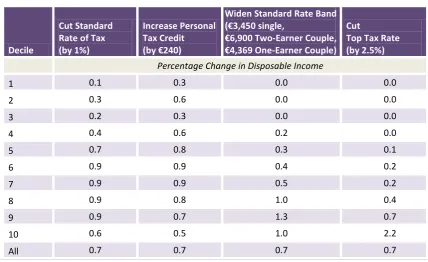
Table 2 reports the impacts of alternative forms of income tax cut, via standard or higher rates of tax, widening of the standard rate band, or an increase in the personal tax credit. Households are ranked by disposable income per adult equivalent,14 and then divided into 10 equal-sized groups or “deciles”, from
poorest (decile 1) to richest (decile 10). The figures in the body of the table show the percentage change for each of these income deciles arising from a change in the relevant tax parameter.
TABLE 2 Distributive Impact of Alternative Tax Policy Instruments (Tax Reduction: €500 million)
Decile
Cut Standard Rate of Tax (by 1%)
Increase Personal Tax Credit (by €240)
Widen Standard Rate Band (€3,450 single,
€6,900 Two-Earner Couple, €4,369 One-Earner Couple)
Cut
Top Tax Rate (by 2.5%)
Percentage Change in Disposable Income
1 0.1 0.3 0.0 0.0
2 0.3 0.6 0.0 0.0
3 0.2 0.3 0.0 0.0
4 0.4 0.6 0.2 0.0
5 0.7 0.8 0.3 0.1
6 0.9 0.9 0.4 0.2
7 0.9 0.9 0.5 0.2
8 0.9 0.8 1.0 0.4
9 0.9 0.7 1.3 0.7
10 0.6 0.5 1.0 2.2
All 0.7 0.7 0.7 0.7
Source: Authors’ calculations using SWITCH, the ESRI tax-benefit model
Notes: Body of table shows percentage change in disposable income for decile group under alternative tax policy changes. Decile 1 is
poorest 10 per cent of households, decile 10 is the richest 10 per cent of households, ranked by household income adjusted for household size and composition.
An increase in the personal tax credit has an impact which has positive effects across the distribution, raising income by between 0.3 and 0.9 per cent. A cut in the standard rate of tax would lead to percentage gains which are greatest for the middle and upper half of the income distribution, but boosts income by somewhat less for the bottom 4 deciles. A cut in the top tax rate leads to strong income gains in the top decile, but has much less impact across middle income deciles and none for the lowest deciles. Widening of the standard rate band leads
14 The equivalence scale is the same as that used by CSO in its estimates of risk of poverty and consistent poverty, i.e.,
[image:17.595.82.511.289.551.2]to gains of 1 per cent or more for the top 3 deciles, with smaller gains for middle income households and no change for the bottom 3 deciles.
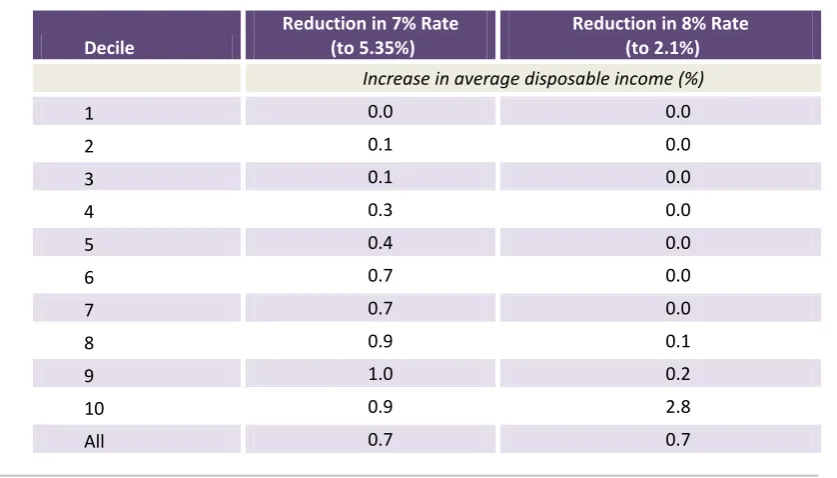
TABLE 3 Distributive Impact of Alternative USC Cuts (USC reduction: €500 million)
Decile Reduction in 7% Rate (to 5.35%) Reduction in 8% Rate (to 2.1%)
Increase in average disposable income (%)
1 0.0 0.0
2 0.1 0.0
3 0.1 0.0
4 0.3 0.0
5 0.4 0.0
6 0.7 0.0
7 0.7 0.0
8 0.9 0.1
9 1.0 0.2
10 0.9 2.8
All 0.7 0.7
Source: Authors’ calculations using SWITCH, the ESRI tax-benefit model (www.esri.ie/switch).
[image:18.595.85.504.150.389.2]TABLE 4 Distributive Impact of a 2 per cent Increase in Welfare Payment Rates (€330 million)
Decile Percentage Change in Disposable Income
1 1.5
2 1.4
3 1.3
4 0.8
5 0.6
6 0.4
7 0.3
8 0.2
9 0.1
10 0.1
All 1.5
Source: Authors’ calculations using SWITCH, the ESRI tax-benefit model (www.esri.ie/switch).
The impact of a 2 per cent increase in welfare payments is illustrated in Table 4. (This is purely illustrative: the cost is €330 million, but a similar pattern would be observed with a lower or higher rate of increase and cost). The percentage gains are, as expected, greatest for those with incomes in the bottom half, and particularly in the bottom third, of the household income distribution. Gains for the bottom three deciles are between 1.3 and 1.5 percent, as against gains of 0.1 to 0.2 per cent for the top 30 per cent of households. Gains for deciles 4 and 5 are also strong compared to those in the upper half, at between 0.6 and 0.8 per cent.
There are two main factors behind this:
• First, many of those in receipt of welfare payments have little or no other income, and tend to be concentrated in the lower third of the household income distribution.
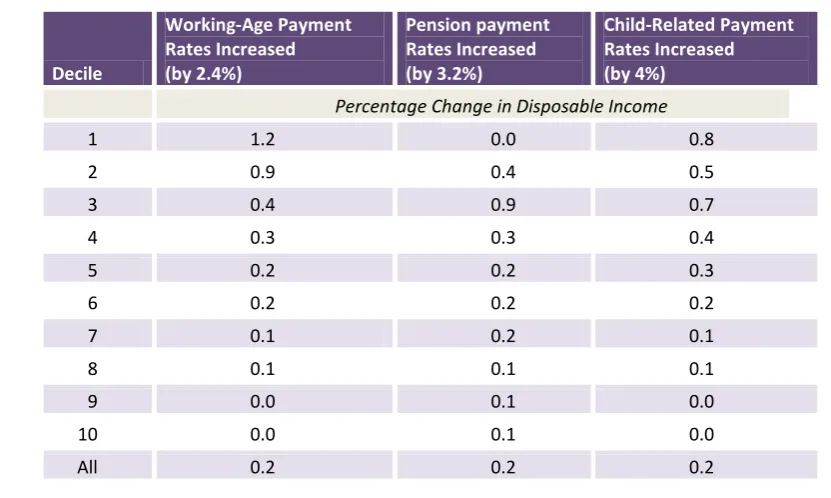
TABLE 5 Distributive Impact of Types of Welfare Payment (Cost: €150m)
Decile
Working-Age Payment Rates Increased (by 2.4%)
Pension payment Rates Increased (by 3.2%)
Child-Related Payment Rates Increased (by 4%)
Percentage Change in Disposable Income
1 1.2 0.0 0.8
2 0.9 0.4 0.5
3 0.4 0.9 0.7
4 0.3 0.3 0.4
5 0.2 0.2 0.3
6 0.2 0.2 0.2
7 0.1 0.2 0.1
8 0.1 0.1 0.1
9 0.0 0.1 0.0
10 0.0 0.1 0.0
All 0.2 0.2 0.2
Source: Authors’ calculations using SWITCH, the ESRI tax-benefit model (www.esri.ie/switch).
Table 5 gives a finer detail on the distributional characteristics of welfare payments, depending on whether the payments are to working-age adults, children, or to pensioners (aged 66 or more). Working-age payments have the greatest impact on the poorest 20 per cent of households, raising income by close to 1 per cent, as against less than 0.4 per cent for pension payments. However, in the third decile, it is pension payments which have the greatest impact.
[image:20.595.94.510.89.338.2]FIGURE 2 Location of Over 65s in the Household Income Distribution: Share of Over 65s in Each Quintile
Source: CSO (2015) SILC website.
If pensioners were distributed evenly across the 5 household quintiles, there would, of course, be 20 per cent of pensioners in each quintile; this benchmark is shown by the dotted line. In fact, there are substantially fewer in the lowest income group and in the highest quintile. There are substantially more in the second quintile, and close to 20 per cent in the third and fourth income quintiles. This analysis cautions against simple assumptions that the elderly tend to be either poor or rich; pensioners are found at all levels of the income distribution.
Figure 3 gives some further evidence15 on the risks of income poverty (“at risk of
poverty” in Eurostat terminology) facing pensioners, those of working age, and children. Figure 4 gives corresponding information on risks of consistent poverty (a measure combining deprivation indicators and low income). While the risk of poverty for pensioners (Figure 3) was above average for the years 2004 and 2007, it has been below the risk of poverty for working age persons and children for all years since 2008. On the latest, 2013 numbers, the risk of poverty for the elderly is less than 10 per cent, as against 15 per cent for those of working age. Results based on the consistent poverty measure (Figure 4) indicate that the risk of consistent poverty for older persons has been lower than that for working-age persons over the whole of the 2004 to 2013 period.
15 These figures are based on CSO analysis of SILC (CSO, 2015).
0% 10% 20% 30% 40%
Lowest income
[image:21.595.70.503.79.359.2]A full study of the reasons behind these patterns is outside the scope of the present paper, but some factors which play some role can be identified;
• Payment rates for the State Contributory and Non-Contributory Pensions have always been higher than the payment rates for the main working-age schemes. During the recession, working-age payments have been reduced below their 2007 levels, while State pension rates have been raised above their 2007 levels.
• Housing costs tend to be lower for those of pension age, as many have by then become outright owners of a house or apartment, while many of those of working age have mortgage or rental payments to meet. This affects the balance of net resources available to meet other needs.
Further work on the balance of resource and needs - including medical and care needs - would be helpful in guiding policy as to options for the long-term relationship between pension payment rates and working age payment rates.
FIGURE 3 At Risk of Poverty Rates Classified by Age, 2004-2013
Source: CSO (2015) SILC website.
Note: Individuals are counted as “at risk of poverty” if they live in households with an income per adult equivalent below 60 per cent
of the national mean.
Figure 4 shows that over the whole 2004 to 2013 period, the risk of consistent poverty for older persons has been lower than that for working-age persons.
0% 5% 10% 15% 20% 25% 30%
2004 2005 2006 2007 2008 2009 2010 2011 2012 2013
[image:22.595.73.512.368.681.2]FIGURE 4 Consistent Poverty Classified by Age, 2004-2013
Source: CSO SILC website.
Note: Individual is in consistent poverty if his or her household income is below 60 per cent of the national mean and the household is
experiencing “enforced deprivation” (experiencing two or more types of deprivation).
4.
E
XPLORINGO
PTIONS FORB
UDGET2016
The introduction of a new Spring Economic Statement gives a much greater insight into government thinking on the shape of next year’s budget than has been available heretofore. In his accompanying speech, the Minister for Finance indicated that
Fiscal space of the order of €1.2 billion and up to €1.5 billion will be available for tax reductions and investment in public services. The final scale of the space will become clearer closer to the Budget. The partners in Government have also agreed that the agreed space will be split 50:50 between tax cuts and expenditure increases and the actual measures will be announced in Budget 2016. The tables in the Spring Economic Statement are based on a general split of €1.2 billion but I expect that by October’s Budget this will be €1.5 billion. (Minister for Finance, 2015b).
While reservations have been expressed about this approach by IFAC (2015) and Duffy et al. (2015), in this paper we examine some tax and welfare options consistent with the approach as set out by government. The Spring Economic Statement does not specify a detailed budgetary package, but the indications it
0% 2% 4% 6% 8% 10% 12% 14%
2004 2005 2006 2007 2008 2009 2010 2011 2012 2013
gives on the size of the overall budgetary package, and on the balance between tax cuts and expenditure increases, have important implications for the broad shape of the budgetary package and its distributive implications.
In a later speech, further detail on the approach was given by the Taoiseach:
This Government will now work as hard attracting back to Ireland, and keeping in Ireland, our skilled, mobile, talented youth as we have at attracting foreign investors. That is why we cut the personal tax rate to 51 per cent in the last Budget for all those earning less than €70,000. And that is why after the next Budget in October we will reduce the tax rate on these workers to below 50 per cent, this time by cutting the rate of USC. (Taoiseach, 2015)
In what follows we construct a tax and welfare package which is consistent with the Spring Economic Statement and government statements on intended changes in USC. We then contrast this package with a continuation of the Budget 2015 strategy, which cut the top rate of income tax but imposed a higher rate of USC on incomes above €70,044 per year. In a further sensitivity analysis, we examine a variant which would focus wholly on cuts to the main (7 per cent) USC rate, without indexing the tax system in line with forecast wage growth.
4.1
Potential Tax and Welfare Packages
In this section, we attempt to construct a feasible tax and welfare package, within the constraints indicated by the Spring Economic Statement. On the basis that the Minister for Finance has indicated in his accompanying speech that he expects the fiscal space to be €1.5 billion, we base our calculations on this figure. Given that it has been agreed that these resources will be split 50:50 between tax cuts and expenditure increases, this means that €750 million is available for tax cuts and a similar amount for expenditure increases. The Spring Economic Statement does not give further guidance on how the tax and expenditure packages will be constructed. However, government statements (e.g., Taoiseach, 2015) have indicated that reductions in the 7 per cent rate of USC will be used to bring the total marginal tax rate facing those on incomes of less than €100,000 per year below 50 per cent.
We build what we will term a “core illustrative package” with the following features;16
16 The actual budget may, of course, contain many other features, such as changes in VAT and excise. However, the
• Most of the €750 million allocated to tax cuts is used for cuts to taxes on income.
• Tax credits and bands are increased by 2 per cent – the figure used by the Stability Programme Update as a technical assumption based on medium-term growth in non-agricultural wages.
• Remaining resources for tax cuts are used to reduce the main (7 per cent) rate of USC.
• The share of additional resources going to welfare expenditure is somewhat below the welfare share of expenditure at present, as falling unemployment means that there will be fewer welfare beneficiaries in 2016 than in 2015.
• With total additional expenditure resources set at €750 million, (50 per cent of €1.5 billion), then a welfare share of these additional resources of about one-third implies increased welfare spending of 1.4 per cent.
• We assume that this spending is spread evenly across all welfare spending, with an increase in welfare payment rates of 1.4 per cent.
If the available resources were closer to €1.2 billion than €1.5 billion, this would reduce resources both for tax cuts and for welfare increases. Resources for tax cuts would be no more than €600 million, and, on our assumptions of a one-third share for welfare, this would amount to €200 million for welfare increases. This compares with €750 million and €250 million respectively in our analysis here.
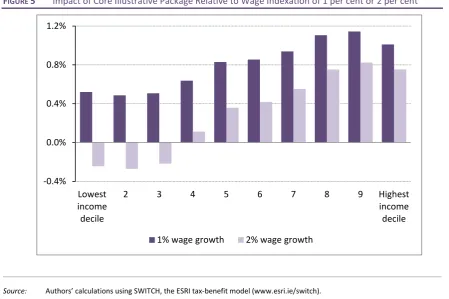
Figure 7 shows the estimated distributional impact of such a package under two alternative assumptions regarding wage growth; a low scenario of 1 per cent growth, and a high scenario in which wages would grow by 2 per cent in 2016. The package as explained involves indexation of tax parameters by 2 per cent, and of welfare parameters of 1.4 per cent – the maximum possible with the resource calculation of one-third of the available fiscal space for expenditure increases.
Under the low wage growth scenario, a welfare increase of 1.4 per cent would be more than sufficient to match wage growth, and this would lead to increases in income at low levels, relative to the benchmark of indexation in line with earnings growth. The balance between resources for tax/USC cuts and welfare increases is such that policy changes, compared to the neutral benchmark, would lead to greater gains for those in the middle and upper reaches of the income distribution, with the greatest proportionate gains for the ninth decile.
result, there would be losses, on average, for the lowest income deciles. Gains for middle and upper income deciles would also be somewhat attenuated.
FIGURE 5 Impact of Core Illustrative Package Relative to Wage Indexation of 1 per cent or 2 per cent
Source: Authors’ calculations using SWITCH, the ESRI tax-benefit mode
Notes: Core illustrative package includes indexation of tax parameters by 2 per cent, welfare payments by 1.4 per cent, USC main
rate cut from 7 per cent to 5.45 per cent. Cost of the package is €750 million for tax cuts, €240 million for welfare increases.
4.2
Tax and USC: Budget 2015 Strategy vs Cut in 7 per cent USC Rate
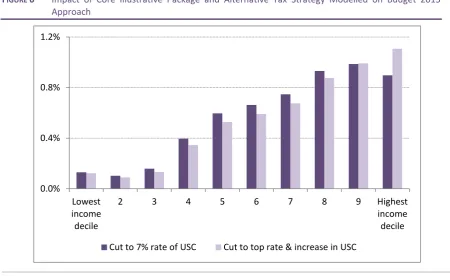
Figure 6 shows how, on a revenue neutral basis, a strategy of cutting the main rate of USC compares with the Budget 2015 approach, which cut the top rate of tax but introduced a new top rate of USC to restrict gains to top earners. It is clear that percentage impact of the USC cut is greater or very similar for all deciles except the top one. While these distributional implications are not the only consideration in shaping tax policy, it is important that an accurate picture of the distributional consequences is available when balancing distributional and other concerns.
-0.4% 0.0% 0.4% 0.8% 1.2%
Lowest income decile
2 3 4 5 6 7 8 9 Highest
income decile
[image:26.595.69.519.116.415.2]FIGURE 6 Impact of Core Illustrative Package and Alternative Tax Strategy Modelled on Budget 2015
Approach
Source: Authors’ calculations using SWITCH, the ESRI tax-benefit mode
Notes: Core illustrative package includes indexation of tax parameters by 2 per cent, welfare payments by 1.4 per cent, USC main rate
cut from 7 per cent to 5.45 per cent. Cost of the package is €750 million for tax cuts, €240 million for welfare increases. Alternative package has same cost, and same structure, but cuts top rate of income tax by 1 per cent, and reduces 7 per cent rate to 5.8 per cent to ensure revenue neutrality.
4.3
Cutting the Main USC Rate With or Without Tax Indexation
Figure 7 shows how a package which includes indexation of tax parameters and remaining resources for tax cuts used to reduce the main USC rate, which arrives at a reduction of about 1.5 percentage points (from 7 per cent to 5.5 per cent), compares with a package which eschews indexation of tax parameters and puts the available resources into a deeper cut in the USC rate to 4.5 per cent. The outcomes of the un-indexed policy would be less favourable, on average, for those in the bottom 6 deciles, broadly similar for those in deciles 7 and 8, and more favourable for deciles 9 and especially the top income decile. Differences between the most favourably affected and worst affected are of the order of 0.2 to 0.3 per cent of income. This depends in part on the rate of wage growth – here assumed to be 1.5 per cent for all incomes.
0.0% 0.4% 0.8% 1.2%
Lowest income decile
2 3 4 5 6 7 8 9 Highest
[image:27.595.70.521.79.359.2]FIGURE 7 Impact of Core Illustrative Package and a Package without Tax Indexation
Source: Authors’ calculations using SWITCH, the ESRI tax-benefit mode
Notes: Core illustrative package includes indexation of tax parameters by 2 per cent, welfare payments by 1.4 per cent, USC main rate
cut from 7 per cent to 5.45 per cent. Cost of the package is €750 million for tax cuts, €240 million for welfare increases. Alternative package has same cost, and same structure, but does not index tax parameters, and cuts USC main rate from 7 per cent to 4.5 per cent to ensure revenue neutrality
The estimates above are designed to illustrate a feasible package under the parameters set out by the Spring Economic Statement. Some key choices have been highlighted. Many other options remain to be explored, but the analysis here shows that the overall room for manoeuvre is quite limited, particularly when the costs of indexation are taken into account.
5.
T
AX,
W
ELFARE ANDL
ABOURS
UPPLY:
I
DENTIFYING THEI
NFLUENCESThe estimates in earlier sections are all based on the technical assumption that behaviour does not change. They are described as “static”, “cash” or “first round” impacts. Such “cash” impacts are much used as part of the assessment of tax and welfare policy changes. For example, static analysis is used by Emmerson et al. (2015) and other regular analyses of budgetary changes by the Institute of Fiscal Studies and by the Treasury (HM Treasury, 2013) in the UK; and Burman and Phung (2015) and other analyses by the Tax Policy Center in the US. However, changes in taxes and welfare alter the budget constraints faced by individuals and couples in making decisions about labour market participation and hours of work. How can such impacts be analysed and taken into account when assessing tax and welfare policy changes?
-0.4% 0.0% 0.4% 0.8% 1.2%
Lowest income decile
2 3 4 5 6 7 8 9 Highest
For both macro and micro-models, the key channel by which lower labour taxes lead to an increase in employment is that at a given gross wage, employees would obtain a higher net pay. This means that a new labour market equilibrium is possible at a higher employment level, with a higher net wage from the point of view of the employee, and a lower gross wage from the point of view of employers.
Macroeconomic models, such as the HERMES model at ESRI and the new COSMO model at ESRI/Central Bank, provide some useful quantification on this issue. For example, Callaghan et al. (2014) present results based on the HERMES model, showing that a broad suite of reforms, including some tax policy elements, could add 26,000 jobs relative to a baseline forecast. However, macroeconomic models necessarily operate at a high level of aggregation. For example, they are unable to distinguish between the effects of differing forms of tax cut (e.g., bands vs rates vs credits) on aggregate labour supply.
To assess the impacts of changes in differing elements of income tax policy, such as rates, bands and credits, an approach based on microdata and microsimulation is needed. Structural models of labour supply identify not only the aggregate labour supply response, but how the labour supply of a nationally representative sample of individuals and couples responds to changes the budget constraint faced under existing and reformed tax systems. Such an approach is also needed if we are to trace through the implications of such changes in labour supply behaviour at micro level, and identify impacts on families of different types.
The most fruitful approach for tax policy analysis has been to estimate structural model of labour supply, allowing for a discrete set of labour supply options. This approach was pioneered by van Soest (1995) and has been applied in many settings since then e.g., Kabatek et al. (2014), Peichl et al. (2010). In the Irish context there are two studies of this type. While the results are based on data from the 1990s, the methods and the types of results generated give a good indication of what is possible in this area. We report them briefly here, and note why new work of this type is needed, in the context of substantial changes in the overall economic landscape over the past 20 years.
labour supply choices observed, and hence prediction of labour supply choices under alternative tax and welfare rules.
Within this framework, Callan et al. examined the impact of different tax measures: standard and top rate tax cuts, band widening and increases in personal tax credits. All of the reforms were calibrated to have a similar budgetary cost. They found that a cut in the standard rate and an increase in personal allowances had similar positive effects on participation and overall desired hours of work. A cut in the top rate of tax, or widening of the band, had even more positive effects. This result was driven mainly by a greater impact on the participation of married women. It should be noted that the participation rate for married women in 1994 was close to 35 per cent, but that this has risen to around 55 per cent at present. Whether these results concerning the relative impact of top rate tax cuts and band widening as against increased allowance/credits and standard rate tax cuts would still hold in the context of a 55 per cent participation rate at present is an open empirical question. Estimation and simulation of a similar model would be required to answer it, and would open up further possibilities for exploring the impact of tax and welfare changes.
6.
C
ONCLUSIONSThe “fiscal space” identified in the Spring Economic Statement is based on freezing tax and welfare parameters in nominal terms. This implies that, with the return of modest wage growth in 2016, average tax rates in the “opening budget” would be higher than in 2015, both for individuals and in aggregate. Part of the “tax cuts” likely to be announced in Budget 2015 will simply be ‘avoiding’ this rise in the average tax rate.
who had been at higher than average risk of poverty in the early 2000s, are now at lower risk of income poverty and consistent poverty than the average.
B
IBLIOGRAPHYAdam, S. and J. Browne (2013). “Do the UK Government’s welfare reforms make work pay?”, IFS Working Paper No. W13/26.
Adam, S., J. Browne, and C. Heady (2010). “Taxation in the UK”, Dimensions of Tax Design, Vol. 1 of the Mirrlees Review.
Bargain, O. and T. Callan (2008). “Analysing the Effect of Tax-benefit Reforms on Income Distribution: A Decomposition Approach”, Journal of Economic Inequality, Published online 23 September 2008.
Blundell, R. (2011). “Tax Policy Reform: The Role of Empirical Evidence”, Journal of the European Economic Association, Vol. 10, No. 1, pp 43-77.
Brewer, M., E. Saez and A. Shephard (2010). “Means-testing and Tax Rates on Earnings” in Institute for Fiscal Studies (ed.) Dimensions of Tax Design, Oxford: Oxford University Press.
Burman, L. and N. Phung (2015). “Distributional Effects of the President’s New Tax Proposals”, Washington: Tax Policy Center.
Callaghan, N. D. Hegarty, T. Hynes, M. McGann, B. O’Connor, L. Weymes (2014). “Quantification of the Economic Impacts of Selected Structural Reforms in Ireland”, Dublin, Irish Government Economic and Evaluation Service, Working Paper, July.
Callan, T. and A. van Soest (1996). “Family Labour Supply and Taxes in Ireland”, ESRI Working Paper No. 78.
Callan, T., M. Keeney, J.R. Walsh (2001). “Income Tax and Welfare Policies: Some Current Issues”, Budget Perspectives 2002.
Callan, T., K. Coleman, J.R. Walsh (2006). “Assessing the Impact of Tax/Transfer Policy Changes on Poverty: Methodological Issues and Some European Evidence”, Research in Labor Economics, Volume 25, pp.125 – 139.
Callan, T., A. van Soest and J.R. Walsh (2009). “Tax Structure and Female Labour Supply: Evidence from Ireland”, LABOUR, Vol. 23, No. 1, pp. 1-35.
Callan, T., C. Keane, M. Savage, J.R. Walsh, K. Timoney (2012). “Work Incentives: New Evidence for Ireland” in T. Callan (ed.) Budget Perspectives 2013, Dublin: The Economic and Social Research Institute.
Callan, T., C. Keane, M. Savage and J.R. Walsh (2013). “Taxes on Income: Ireland in Comparative Perspective”, Budget Perspectives 2014, Dublin: The Economic and Social Research Institute.
Central Statistics Office (CSO) (2011). Survey on Income and Living Conditions (SILC) 2010, Dublin: Stationery Office.
Central Statistics Office (CSO) (2015a). Survey on Income and Living Conditions 2013 Results, Table 2, At risk of poverty, Deprivation and Consistent Poverty Rates by Year,
Congressional Budget Office, 2013. “The Distribution of Major Tax Expenditures in the Individual Income Tax System”, Pub. No. 4308, May 2013, Congressional Budget Office, Congress of the United States Department of Finance, and Department of Public Expenditure and Reform
(2015a). Spring Economic Statement, April 2015.
Department of Finance (2015b). “Stability Programme Update: Incorporating the Department of Finance’s Spring Forecasts”, April 2015.
Duffy, D., K. McQuinn, D. Byrne, C. Morley (2015). Quarterly Economic Commentary, Summer 2015, Dublin: ESRI.
Emmerson, C., P. Johnson and R. Joyce (2015). The IFS Green Budget, London: IFS. Hickey, R. and D. Smyth (2015). “Government revenues in Ireland since the
financial crisis”, Central Bank of Ireland, Economics Letters Series.
HM Treasury, 2014. “Impact on households: distributional analysis to accompany Autumn Statement 2014”, ISBN 978-1-910337-42-4, PU1714,
Honohan, P. (2009). Opening address by Governor Patrick Honohan to the ESRI/Foundation for Fiscal Studies, Budget Perspectives Conference, 13 October 2009, http://tinyurl.com/p6fd8ha.
IFAC (2015). “Fiscal Assessment Report: June 2015”, Irish Fiscal Advisory Council,
IMF (2014). “Fiscal Policy and Economic Inequality”, IMF policy paper available online at www.imf.org/external/np/pp/eng/2014/012314.pdf.
Kabatek, J., A. Van Soest, E. Stancanelli (2014). “Income taxation, labour supply and housework: a discrete choice model for French couples” Labour Economics, Elsevier, 2014, 27, pp.30-43.
Meghir, C. and D. Phillips (2010). “Labour Supply and Taxes”, in J. Mirrlees, S. Adam, T. Besley, R. Blundell, S. Bond, R. Chote, M. Gammie, P. Johnson, G. Myles and J. Poterba (eds.), Dimensions of Tax Design: The Mirrlees Review, Oxford University Press for Institute for Fiscal Studies.
Minister for Finance (2015a). Written answer by the Minister for Finance Mr. Michael Noonan T.D. to question from Jim Daly T.D., 7 May 2015,
Minister for Finance (2015b). Spring Economic Statement Speech by the Minister for Finance Mr. Michael Noonan T.D., 28 April 2015,
O’Dea, C. (2015). “Can we measure who loses most from public service spending cuts?”, Dublin: ESRI Budget Perspectives Paper 2015/1.
OECD (2013). OECD Economic Surveys: Ireland 2013 Paris: OECD Publishing. OECD (2014). Benefits and Wages: OECD Indicators,
Peichl, A., Schneider, H. and Siegloch, S. (2010). Documentation IZAΨMOD: The IZA Policy Simulation Model, IZA Discussion Papers 4865.
Savage, M., T. Callan, B. Colgan, J.R. Walsh (2015). “Making Work Pay More: Recent Initiatives”, Dublin: ESRI Budget Perspectives Paper 2016/2.
Savage, M., T. Callan, B. Nolan, B. Colgan (2015a) “The Great Recession, Austerity and Inequality”, ESRI Working Paper No. 499
Savage, M., T. Callan, J. R. Walsh (2015b). “Financial Incentives to Work in Ireland”, paper to the Statistical and Social Inquiry Society of Ireland.
Taoiseach Enda Kenny (2015). Speech at the Grant Thornton Worldwide Tax Conference, 4 June,
Van Soest, A. (1995). Structural models of family labor supply: A discrete choice approach, Journal of Human Resources, 30(1), 63-88.
Watson, D., Maître, B. and Whelan, C. (2012). Work and Poverty in Ireland: An Analysis of CSO Survey on Income and Living Conditions 2004-2010, ESRI and Social Inclusion Division of Department of Social Protection.
The Economic & Social Research Institute Whitaker Square
Sir John Rogerson’s Quay Dublin 2, Ireland