promoting access to White Rose research papers
White Rose Research Online [email protected]
Universities of Leeds, Sheffield and York
http://eprints.whiterose.ac.uk/
This is an author produced version of a paper published in Wear.
White Rose Research Online URL for this paper:
Published paper
Fletcher, D.I., Lewis, S. (2012) Creep curve measurement to support wear and adhesion modelling, using a continuously variable creep twin disc machine, Wear, Published online December 13th 2012
Creep curve measurement to support wear and adhesion modelling,
using a continuously variable creep twin disc machine
DI Fletcher*, S Lewis
Department of Mechanical Engineering, University of Sheffield, Mappin Street, Sheffield, S1 3JD, UK
* Corresponding author, Tel +44 114 2227760, Fax +44 114 2227890, Email [email protected]
ABSTRACT
Predictive modelling of wear and adhesion at rolling-sliding contacts such as a railway rail and wheel depends on understanding the relationship between slip and shear force at the contact surface, i.e. the creep verses force curve. This paper describes a new approach to creep curve measurement using a twin disc machine running with a continuous programmed variation of creep, enabling an entire creep curve to be defined in a single experiment. The work focuses on very low levels of creep, ranging from zero to 1%, and shows clear correlation between the creep curve gradient and the full slip friction coefficient for dry and lubricated contacts.
Comparison of data generated using the new approach with that generated using multiple tests each at a single creep level shows good agreement. Comparison is also made between the twin disc data and results for full size three dimensional rail-wheel contacts to examine how two and three dimensional contact adhesion data are related. The data generated has application in wear and rolling contact fatigue modelling, but the original motivation for the research was generation of creep curves to support prediction of low adhesion conditions at the rail-wheel interface based upon monitored running conditions prior to brake application. The range of contact conditions investigated includes those experienced in service and during driver training, with the correlation found between creep curve gradient (measurable prior to braking) and full slip friction coefficient (not measurable until brakes are applied) representing a key finding.
1
Introduction
This paper reports development of a new twin-disc test method to measure rail-wheel adhesion under rolling-sliding contact conditions with continuously variable creep, and the first series of creep curves defined with this new machine. The test method enables a creep curve (creep force plotted against creep) to be measured in a single machine run, replacing previous approaches using multiple tests at different creep levels. An accompanying paper presents a new 2D model for interpretation of the results [1]. The work is focused on low levels of creep (up to 1% in most tests) under a range friction conditions, and has application in modelling of wear, rolling contact fatigue and adhesion at the rail-wheel interface. It was conducted within a programme of research into detection of low adhesion prior to brake application through analysis of lateral (steering) forces at the railway rail-wheel contact [2].
Rail-wheel adhesion is defined as the ratio of tangential to normal stress transmitted by the rail-wheel interface and at a macro level is dependent on the rail-wheel interface friction coefficient and on the overall level of creep. At a micro level it is found that this behaviour depends on elastic deformation of the rail and wheel surfaces at their contact which produces partial slip with distinct sticking and slipping regions [3], and the friction coefficient can itself be dependant on the level of creep [4,5,6]. Adhesion may be quantified using a ratio of tangential to normal traction measured at a macro level for the entire rail-wheel contact, this being referred to as a coefficient of traction or a coefficient of adhesion, both of which are the same ratio.
conditions. For naturally occurring variable adhesion conditions ‘normal adhesion’ is defined as a CoA > 0.1, low adhesion conditions as a CoA in the range 0.1 to 0.05, and very low adhesion as a CoA < 0.05. A further category of ‘sustained low adhesion’ is defined in which peak values of adhesion coefficient are in the range 0.02 - 0.06.
2
A new machine capability for variable creep testing
Defining a creep curve using a twin disc approach has previously been conducted using Amsler machines [15] in which different sample sizes must be used to create different levels of creep, or using multiple runs of machines able to maintain a fixed level of creep between rail and wheel components, usually under computer control [16]. In the current research an update was made to the control system of the SUROS twin disc test machine [10] to enable creep curve determination in a single non-stop machine run by very gradual variation of creep during testing. Figure 1 shows a schematic representation of the SUROS machine and a drawing of the test discs used, which are of 47mm diameter and form a line contact of 10mm lateral width. In addition to measurement of disc speeds to calculate creep, data acquisition is conducted throughout testing to provide a record of torque and normal contact load transmitted by the discs. The updated control system was written in National Instruments Labview® enabling user friendly control and data acquisition during tests.
Creep(%)=200RrailSrail−RwheelSwheel RrailSrail+RwheelSwheel
( 1 )
2.1 Refining the control system
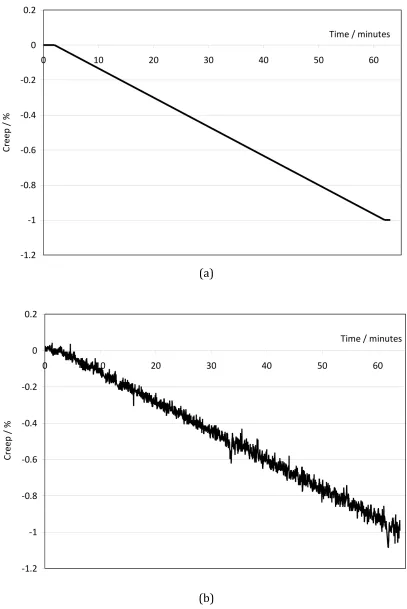
The updated SUROS control software was initially programed to begin the variation of creep immediately load was applied to the discs, following an initial disc speed stabilisation period prior to bringing the discs together. The first test conducted showed that if the ramp in creep began immediately the discs made contact the results for the initial creep value became masked by the short period of disc speed stabilisation when the discs were brought into contact. To overcome this a stabilisation period was introduced during which creep demand is automatically held constant at its initial value for two minutes after load is applied to the discs. This dwell period was used in all the tests reported here, and is shown at the origin of Figure 2. At the end of the ramp period the creep demand is held constant at its final value allowing tests to be continued at this creep level or be stopped at this point. The facility to ramp up or down between creep levels was included so the effect of creep history could be investigated, i.e. to identify if rail-wheel samples produce a different friction-creep relationship when moving from high to low levels of creep rather than low to high levels, for example, through modification of the sample surface during the test.
The previous control system for the SUROS machine was designed to very closely maintain creep at a set level over many thousands of contact cycles. This was achieved by using creep based on disc speed for control, but also an alternative measure of creep based on the number of disc revolutions, to correct any long term drift away from the set value. In a variable creep test the value based on disc revolutions has no meaning, and this aspect of the control system was removed for such tests, although it remains for fixed creep tests. Other aspects of the machine remained as described previously, with load maintained to within ±2% of its set value,
torque transmitted by the contact measured to within ±1.25%, and disc speed
3
Test programme
Using the updated SUROS machine the programme of tests in Table 1 was performed under dry and lubricated conditions, as show in Table 2. The test programme included some fixed creep tests to double check the performance of the machine during variable creep testing. The lubrication conditions were selected to cover those occurring naturally, those caused by migration of flange lubrication products, and also those used in driver training for low adhesion conditions [18]. The tests were conducted with creep incremented at a rate of plus or minus 1% over 60 minutes, and the tests were stopped shortly after the final value of creep was reached, giving a duration of just over one hour for most tests. Lubricated tests ran without cooling and the discs remained at room temperature, while in dry tests discs were cooled with jets of filtered compressed air to maintain room temperature. The steels used were a grade 220 normal grade rail, and wheel grade R8, both used in previous research on rail-wheel contact at Sheffield [19]. The hardness of the rail and rail-wheel steels was 237Hv(100kg) and 257Hv(100kg) respectively.
4
Results and discussion
Testing on the updated twin disc machine first considered the reliability of data from continuously variable creep tests by comparison with results from a short series of single creep value tests. The effect of creep increment direction (increasing or decreasing creep during a test) was then considered to understand whether this was a significant factor in testing over a range of creep in a single test. The main body of testing was undertaken after these machine proving tests. All tests used a driving wheel (negative creep) but creep values are plotted as positive numbers to match the conventional format of a creep curve.
4.1 Single value creep tests
falling within or very close to the data generated from the continuously variable creep test. At higher creep the data points from the single point tests lie to either side but close to the data for the continuously variable creep test. The single point tests are each started individually, with unavoidable slight differences in test specimen alignment and cleanliness, and it is thought that this may be responsible for the deviation of single point values either side of the continuously acquired data. That the single point values lie either side of the continuously acquired data indicates that the continuously variable creep test is generating data at least as good as could have been found by drawing a smooth curve through data points from multiple single tests.
4.2 Effect of creep increment direction
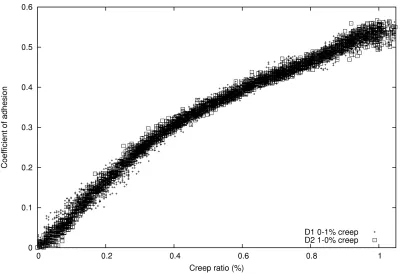
To check if the direction of creep increment had any significant effect on the results, for example by conditioning of the disc surface early in the run, tests under dry and water lubricated conditions were conducted in which creep was increased or decreased over the range 0 to -‐1% using different sets of test discs. The results for dry tests (D1 and D2, Figure 4) show that data sets for raising and falling creep lie on top of one another, so the direction of creep increment was not influential in the outcome. Results for water lubricated tests (W1 and W2, Figure 5) show some differences between the data sets, but key aspects remain the same, i.e. the slopes at low creep are the same for both tests, and both tests show traction coefficient values in the range 0.22 to 0.26 at the 1% creep level.
creep increment direction. Rather, they indicate the level of uncertainty typical of traction coefficient data from water lubricated twin disc testing. The results in Section 4.2.1 for a range of lubricant types show that changes in traction coefficient with lubrication type far exceed those between the water lubricated tests W1 and W2, i.e. any uncertainty is small relative to the values of interest.
4.2.1 Creep curve data for dry and lubricated contacts
Figure 6 summarises results for all the lubricant types tested, showing the data in dimensional form. The results from water lubricated tests W1 and W2 were very close to one another, and only test W1 is shown here for clarity. Dry test D3 was almost identical to dry tests D1 and D2, but took place over a wider range of creep (up to 2.5%), this range being needed to achieve full slip under the high friction conditions. Full results for test D3 are shown in Figure 10.
Figure 7 presents the same data shown in Figure 6 in a non-‐dimensional form, with creep replaced by creep multiplied by disc radius R and divided by the contact patch half-‐width a, and the friction coefficient µ. The disc radius and contact patch size are linked by a two dimensional line contact Hertzian model [20], which gives the values in Table 3. The friction coefficient (as distinct from the traction coefficient) is determined from the ‘saturation’ level of the creep curve at which full slip is achieved and the curves in Figure 6 become approximately horizontal. This has been determined for each curve individually, (see Section 4.5). The traction coefficient (tangential force Q divided by normal force P) is normalised by the friction coefficient µ to give the vertical axis values.
friction coefficient dependence on slip velocity (for example due to temperature difference with slip), differences between the static and kinematic friction coefficient, or cases where a third body (such as a liquid lubricant film, or a solid lubricant layer) exists between the surfaces [4].
From Figure 7 is can be seen that both water lubricated and dry contact cases lie very close to the theoretical curve, and very close to one another. This indicates that when water is present it is acting to change surface friction levels, but it does not form a surface separating hydrodynamic lubrication film. The data for the other lubricants considered all deviate from the theoretical curve, showing that these lubricants act not just by changing surface friction coefficient, but also as third bodies within the contact. Solid lubricant sticks produce behaviour most similar to water and dry conditions (although Figure 6 shows this is at much lower dimensional values of traction coefficient), whereas the liquid and grease lubricants deviate greatly from the theoretical behaviour for two body contact.
In terms of detecting low adhesion due to leaf fall, the lignin case is of greatest interest, and Figure 7 shows its initial slope and the friction coefficient reached are clearly different from the dry and water lubricated cases. Comparing Figure 6 and Figure 7 the data for lignin and the CG flange lubricant in Figure 7 becomes dispersed across a wide range of non-‐dimensional creep, and most data are at higher values not shown in the graph. This is a consequence of the great deviation of surfaces lubricated by these products from the theoretical behaviour of surfaces for which lubrication introduces friction variation alone, without third body effects.
4.3 Effect of pressure
but that the ‘saturation’ level of traction coefficient at high creep does vary with contact pressure. The lowest pressures are found to give the highest traction coefficients at full slip, i.e. the highest friction coefficients. Initial gradients (the creep coefficients) were approximately half those for water lubricated or dry contact.
4.4 Lubricant application effects
It was found that different lubricants produce very different forms of creep curves, not just in terms of traction coefficient levels, but also in the range of traction coefficient at any particular creep. In most cases traction coefficient was found to vary by approximately ±0.005 at any particular creep level. This is in part due to uncertainties in load and torque measurements, but will also include genuine variation in traction level as lubricants are applied and pass through the contact. For the liquid lubricants, including water, application was at a rate sufficient to avoid the contact drying out, with a meniscus of lubricant maintained at the contact entry. This avoided any rapid changes of traction coefficient with time as the lubricants were applied. For dry contact tests which required cooling, filtered cooling air was used to avoid any oil or condensation in the air supply system from reaching the test discs and changing the contact conditions.
4.5 Comparison of twin disc to real rail-wheel data
The Hertzian contact pressure solutions [20] provide the main link between the twin disc and full scale rail-‐wheel contact, ensuring that the contact pressure experienced in rail-‐wheel contact is correctly replicated in the small scale samples despite the much reduced contact area, typically 6mm2 against around 200mm2 for full size contacts. In terms of speed the laboratory test is slower than train running speeds (disc surface speed ~1ms-‐1), but creep is correctly applied through difference in speed between the rail and wheel discs.
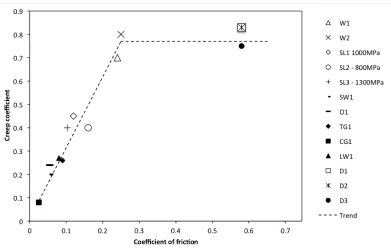
The creep curves were defined by thousand of data points, and it was useful to reduce these data to some simple numbers for comparison with literature data. This was achieved by calculating the initial gradient of the dimensional plots (the ‘creep coefficient’), the coefficient of traction at full slip (the ‘friction coefficient’), and the slip at which full slip was achieved. Figure 10 shows how this was done for the dry contact test D3, and other cases were similar. Since the gradient of the curves changes gradually some judgement was needed in choosing the data defining the initial gradient and the point of full slip. This was done visually by plotting the data and gradient estimates in plots similar to Figure 10, producing the values summarised in Table 4. Figure 11 shows these data graphically, indicating that that creep coefficient rises with friction coefficient until a saturation point, after which creep coefficient remains constant for further increase in friction coefficient. This is a valuable finding for the prediction of low adhesion, since if replicated on full rail-‐wheel contacts it shows that creep coefficient measured during normal running (using on-‐board technology now under development [2]) can be used as a predictor of friction coefficient, and hence of available adhesion for braking. A similar trend was found in track trials using the British Rail Tribometer Train [22], although this work examined creep more widely and did not focus on this correlation as a key finding.
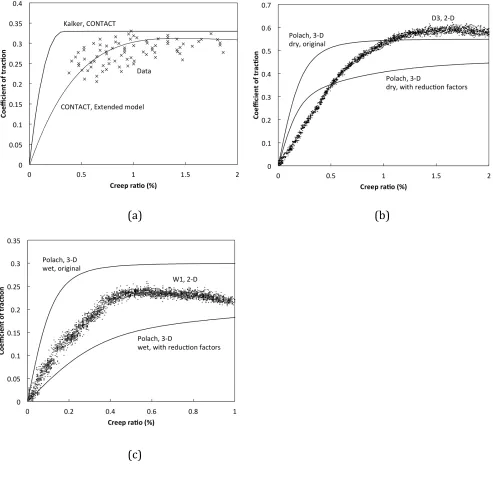
of slip considered in the current test series. Vollebregt [14,23] has used data from a Siemens Eurosprinter 127 001 locomotive [13] in the extension of the CONTACT model originally developed by Kalker [24] to include interfacial layers at the rail-‐wheel surface and a fall in traction coefficient at higher levels of slip. The original Kalker model is applicable only to scrupulously clean surfaces that are not seen for real rail-‐wheel contacts, and these extensions to the model allow real contacts to be better represented in the calculation of creep curves. Inclusion of this real contact behaviour produces a decrease in creep coefficient from 2.3 to 0.59 when representing the creep curve for this locomotive (Figure 12a). Polach has similarly developed a model able to represent real rail-‐wheel creep curves, basing this on several adhesion datasets from Siemens and Bombardier locomotives, and has published coefficients giving creep curves for typical dry and wet rail conditions [4]. Vollebregt [14] has shown that the extended CONTACT model fits the experimental data at least as well as the Polach model for tangent track cases, and this provides a link between the Polach model which has available generic coefficients for representing dry and wet contact, and the locomotive data shown in Figure 12.
Output from the Polach model is plotted together with dry (test D3) and wet (test W1) data in Figure 12. The Polach model was applied for the contact load and sizes reported by Vollebregt [23] for the Siemens Eurosprinter 127 001 locomotive, using the generic ‘dry’ and ‘wet’ modelling coefficients given by Polach. Maximum friction coefficients at full slip were not adjusted to match the twin disc data, and since the contact shape used for the calculation of the creep curves influences their gradient and the creep at which full slip is achieved, exact agreement would not be expected between the modelling output for 3D contacts and the data from the twin disc machine. Even with these factors in mind, there was pleasing similarity between the 2D twin-‐disc and 3D cases.
creep over 0.5% were caused by the difference in full slip traction coefficient between the cases, thought to be caused by the cleaner conditions of the laboratory contact relative to the railway. Better agreement between the cases at high slip may be achieved by introducing appropriate contamination to the laboratory tests (e.g. rust, slight traces of oil, environmentally derived contamination from leaves or pollution). However, this would also drop the adhesion coefficient at low creep, with the difference in shapes of the curve being dependant on contact geometry difference as well as friction coefficient.
For the ‘wet’ results the twin disc data was above the 3D Polach curve for the case with interfacial shear reduction factors included, but below the theoretical curve for scrupulously clean surfaces. Creep coefficients were 0.44 and 0.7 for the 3D case with reduction factors for real surface behaviour, and for the twin disc case respectively. The theoretical 3D case had a creep coefficient of 2.3. As for the ‘dry’ case, the overall form of the 2D derived creep curve is correct but its magnitude is dependant on contact shape relative to the 3D contacts and on the exact levels of cleanliness and resulting full slip traction coefficient.
5
Conclusions
Predictive modelling of wear, rolling contact fatigue, and traction or adhesion in rolling-sliding contacts depends on well defined creep curves for a range of contact conditions. This paper describes a new approach to creep curve measurement using a twin disc machine running with a continuous programmed variation of creep, enabling an entire creep characteristic to be defined in a single experiment. Its first application has focused on very low levels of creep, ranging from zero to 1%, and shows clear dependence of the creep coefficient and friction coefficient on contact condition, ranging from dry to well lubricated. The dependence of creep coefficient on lubricant type (and hence its correlation with full slip friction coefficient) is a deviation from the standard two body Carter theory of rolling contact and is potentially useful in identifying low adhesion before a full slip situation develops.
wear and rolling contact fatigue tests. The update described here provides a controlled linear ramp between a starting and ending creep level over a period of sufficient duration that creep is quasi-static at any moment, and close control of the machine is maintained. Dwell periods are included at either end of the ramp to ensure stable running conditions. An entire creep curve can be mapped out in a single experimental run, replacing the previous approach of multiple tests to generate individual points on the creep curve. A curve for 0 to 1% creep can be defined with around 3500 data points in a much shorter test time than would previously have generated a few tens of data points. Comparison of data generated using the old and new approach shows good agreement.
The motivation for the research was prediction of low adhesion at the rail-wheel interface based upon monitored running conditions prior to brake application. The correlation found between creep curve gradient (measurable prior to braking) and full slip friction coefficient (not measurable until brakes are applied) representing a key finding and supports this aim. The range of contact conditions chosen for investigation includes those experienced by a rail-wheel contact in service (dry, wet, flange lubricant) but also those used during the simulation of low adhesion conditions for driver training (soap and water, lignin and water). Creep curves for 0 to 1% creep are presented for each of these conditions, and numerical values of creep coefficient and friction coefficient are tabulated from these curves.
Data generated using the twin disc approach was compared with data and models for full size rail-wheel contacts. There was pleasing similarity between the twin disc and 3D cases, with creep coefficients for dry and wet twin disc contacts much closer to those representing data from previous track trials than to theoretical creep coefficients. An exact match was not expected since the creep curve is dependent on contact shape, and because differences in contact contamination level relative to the track trials changed the maximum adhesion coefficient available between the cases compared.
6
Acknowledgements
The authors also thank Tata for supply of rail steel, Wabtec for supply of a wheel, and London Underground for supply of flange lubricants.
7
References
1. Fletcher, DI, A new two-dimensional model of rolling-sliding contact creep curves for a range of lubrication types, accepted for publication in the Proceedings of the Institution of
Mechanical Engineers, Part J: Journal of Engineering Tribology, 2012
2. Onboard detection of low adhesion, Railway Safety and Standards Board project T959, Research and Development E-Newsletter, Issue 69, January 2011, www.rssb.co.uk. 3. KL Johnson, Contact Mechanics, Cambridge University Press, 1987, Cambridge, UK 4. O. Polach, Creep forces in simulations of traction vehicles running on adhesion limit, Wear
258 (2005) 992–1000
5. W. Zhang, J. Chen, X. Wu, X. Jin, Wheel/rail adhesion and analysis by using full scale roller rig, Wear 253 (2002) 82–88.
6. A.D. Monk-Steel, D.J. Thompson, F.G. de Beer and M.H.A. Janssens, An investigation into the influence of longitudinal creepage on railway squeal noise due to lateral creepage, Journal of Sound and Vibration, 293, 3-5 (2006) 766-776
7. Poole, W, An Overview of Low Adhesion Factors for ERTMS, Project T080 final report, July 2003, Rail Safety and Standards Board, Block 2, Angel Square, 1 Torrens Street, London EC1V 1NY
8. GM/GN2642 Guidance on Wheel/ Rail Low Adhesion Measurement, Issue One: February 2008, Rail Safety and Standards Board, Block 2, Angel Square, 1 Torrens Street, London EC1V 1NY
9. GM/GN2695, Guidance on Testing of Wheel Slide Protection Systems Fitted on Rail Vehicles, Issue 1, 04 December 2010, Rail Safety and Standards Board, Block 2, Angel Square, 1 Torrens Street, London EC1V 1NY
10. Fletcher D. I. and Beynon, J. H. Development of a machine for closely controlled rolling contact fatigue and wear testing. J. Test. Eval., 2000, 28(4), 267–275.
11. Nagase, K, A Study of Adhesion Between the Rails and Running Wheels on Main Lines: Results of Investigations by Slipping Adhesion Test Bogie, Proceedings of the Institution of Mechanical Engineers, Part F: Journal of Rail and Rapid Transit, 203 (1989) 33-43
12. Logston, CF, Itami, GS, Locomotive Friction-Creep Studies, ASME Journal of Engineering for Industry, 102 (1980) 275-281
13. Engel, B, Beck, HP, and Alders, J. Verschleißreduzierende Rad-schlupfregelung mit hoher Kraftschlussausnutzung. Elektrische Bahnen, 96:201–209, 1998.
14. Vollebregt, EAH, Numerical modelling of measured railway creep versus creep-force curves with CONTACT, presented at 9th International Conference on Contact Mechanics and Wear of Rail/Wheel Systems (CM2012), Chengdu, China, August 27-30, 2012, submitted to Wear. 15. Amsler, AJ, Abnützungsmaschine für metalle (Wear machine for metals), Z. VDI, 66, 15
(1922) 377-378
16. A Matsumoto, Y Sato, H Ono, Y Wang, M Yamamoto, M Tanimoto and Y Oka, Creep force characteristics between rail and wheel on scaled model, Wear, 253, 1-2 (2002) 199-203
17. Kapoor, A, Fletcher, DI, Schmid, F, Sawley, KJ, Modern Tribology Handbook, Chapter 34. Tribology of Rail Transport, Bharat Bhushan, CRC Press, 2000, ISBN: 978-0-8493-8403-5 18. GM/GN2643, Guidance on Wheel / Rail Low Adhesion Simulation, Issue One, February
2008, Rail Safety and Standards Board, Block 2, Angel Square, 1 Torrens Street, London EC1V 1NY
20. Engineering Science Data Unit Item 78035, Contact phenomena I: stresses, deflections and contact dimensions for normally-loaded unlubricated elastic components, 1995, ESDU International, London.
21. Carter, FW, On the Action of a Locomotive Driving Wheel, Proceedings of the Royal Society of London. Series A, 112, 760 (1926),151-157
22. T.G. Pearce and K.A.Rose. Measured force-creepage relationships and their use in vehicle response calculations. Proc. IAVSD 9th Symposium (Linkoping), 1985.
23. Vollebregt, EAH, User guide for CONTACT, Vollebregt & Kalker’s rolling and sliding contact model, Technical Report TR09-03, version 12.2, Vortech Computing, Delft, The Netherlands, June 2012
24. Kalker, JJ, Three-Dimensional Elastic Bodies in Rolling Contact, Kluwer Academic Publishers, Dordrecht/Boston/London, 1990
Figure captions
Figure 1 The SUROS test machine. (a) Schematic of the machine and closed loop control system. (b) Test sample drawing, dimensioned in mm. Test discs are removed from parent rail and wheel material.
Figure 2 Creep levels. (a) Creep demand. (b) Typical response of the SUROS machine during testing.
Figure 3 Continuously variable and single point creep-‐traction data for tests D2, and D4-‐10. The spread of creep values in test D2 around 1% creep is produced during the dwell period at the end of the test.
Figure 4 Creep curves for dry contact tests under increasing (D1, 0 to 1%) and decreasing (D2, 1 to 0%) creep.
Figure 5 Creep curves for water lubricated contact tests under increasing (W1, 0 to 1%) and decreasing (W2, 1 to 0%) creep.
Figure 6 Creep curves for all the lubrication conditions examined, dimensional axes. All at 1000MPa maximum Hertzian contact pressure.
Figure 7 Creep curves for all the lubrication conditions examined, normalised axes. All at 1000MPa maximum Hertzian contact pressure.
Figure 8 Creep curves for contacts lubricated by solid stick flange lubricant at a range of contact pressures. Higher contact pressure produces lower traction levels at full slip.
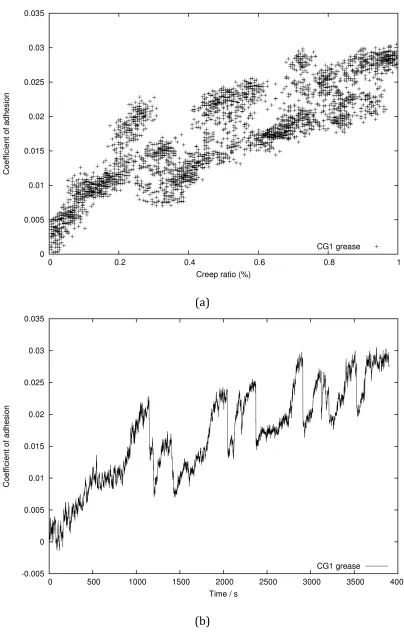
Figure 9 Creep data for flange lubrication grease CG. (a) Plotted against creep, the wide range of friction at each creep value is related to grease application. (b) Plotted against time there are occasional sudden falls in traction coefficient. Slip was increasing during the test, producing an underlying trend of increasing traction
coefficient.
Figure 10 Definition creep coefficient (initial slope) and friction coefficient (saturation level) from the creep curve for dry contact at 1000MPa.
Figure 11 Test data for creep coefficient, plotted against coefficient of friction
Figure 12 Comparison of creep curves from twin disc tests with data and
wet contact, with twin disc creep data from test W1.
Tables
Table 1. Test programme
Test code Maximum Hertzian contact pressure / MPa
Starting creep / %
Ending creep / %
W1 1000 0 -1
W2 1000 -1 0
SL1 1000 0 -1
SL2 800 0 -1
SL3 1300 0 -1
SW1 1000 0 -1
O1 1000 0 -1
TG1 1000 0 -1
CG1 1000 0 -1
LW1 1000 0 -1
D1 1000 0 -11
D2 1000 -1 0
D3 1000 0 2.5
D4 1000 0.12 -
D5 1000 0.22 -
D6 1000 0.32 -
D7 1000 0.42 -
D8 1000 0.52 -
D9 1000 0.72
D10 1000 1.02
1. Completed in 2 stages, 0 to -0.7%, and -0.7% to -1%.
2. Test at nominally fixed creep level, 4000 cycles duration. Data is plotted at
Table 2. Lubrication conditions. Brand names are not included here for confidentiality reasons.
Lubricant type and test code
Lubricant notes Application notes
Dry (D) Surfaces cleaned with ethanol, no lubrication
Forced air cooling
Oil (O) General purpose machine tool lubricant ISO viscosity grade 68
Applied using a dropping funnel to maintain oil coating on the discs
Water (W) Distilled water Applied at 1 drip per second Solid lubricant (SL) Molybdenum disulphide
based solid stick flange lubricant
Constant application to wheel disc
Soap and water
(SW) Detergent and water [18]. Light duty liquid hand soap 1ml detergent to 99ml water, applied using dropping funnel Lignin and water
(LW) Lignin and water [18] 70g lignin powder to 280ml water, applied using dropping funnel
Track grease 1 (TG) Conventional hydrocarbon track grease used for flange lubrication, formulated with 13% calcium soap and 12% graphite
Lubricant applied by transfer from a spatula approximately once per minute
Track grease 2 (CG) Biodegradable track grease formulated with a mixture of synthetic and vegetable base fluids, with a mixed
lithium/calcium soap thickener
Lubricant applied by transfer from a spatula approximately once per minute
Table 3. Contact pressure and sizes for a Hertzian line contact with 47mm diameter
test discs.
Contact pressure / MPa Contact half-‐width / mm
800 0.163
1000 0.204
1300 0.265
Table 4. Friction coefficients (saturation traction coefficient) and creep coefficients
(initial force-creep gradient) for each test, with reference values from literature.
Test Friction coefficient, µ
Creep coefficient Creep at which full slip was achieved, %
W1 0.24 0.70 0.43
W2 0.25 0.80 0.65
SL1 0.12 0.45 0.70
SL2 0.16 0.40 0.72
SL3 0.103 0.40 0.67
SW1 0.055 0.20 0.55
O1 0.055 0.24 0.45
TG1 0.09 0.26 0.74
CG1 0.025 0.08 0.65
LW1 0.08 0.27 0.70
D1 0.58 0.83 Full slip not reached
D2 0.58 0.83 Full slip not reached
D3 0.58 0.75 1.25
Figures
(a)
(b)
Figure 1. The SUROS test machine. (a) Schematic of the machine and closed
loop control system. (b) Test sample drawing, dimensioned in mm. Test discs are removed from parent rail and wheel material.
(a)
[image:23.595.91.498.62.671.2]
(b)
Figure 2. Creep levels. (a) Creep demand. (b) Typical response of the SUROS
machine during testing.
Figure 3. Continuously variable and single point creep-traction data for tests D2,
and D4-10. The spread of creep values in test D2 around 1% creep is produced during the dwell period at the end of the test.
Figure 4. Creep curves for dry contact tests under increasing (D1, 0 to 1%) and
[image:24.595.97.497.452.726.2]
Figure 5. Creep curves for water lubricated contact tests under increasing (W1, 0
to 1%) and decreasing (W2, 1 to 0%) creep.
Figure 6. Creep curves for all the lubrication conditions examined, dimensional
[image:25.595.104.498.453.726.2][image:26.595.99.498.81.351.2]
Figure 7. Creep curves for all the lubrication conditions examined, normalised
axes. All at 1000MPa maximum Hertzian contact pressure.
Figure 8. Creep curves for contacts lubricated by solid stick flange lubricant at a
[image:26.595.100.498.413.685.2]
(a)
[image:27.595.95.499.59.695.2]
(b)
Figure 9. Creep data for flange lubrication grease CG. (a) Plotted against creep,
Figure 10. Definition creep coefficient (initial slope) and friction coefficient
(saturation level) from the creep curve for dry contact at 1000MPa. The point at which full slip is achieved is defined as the slip at which the data meets the friction coefficient line.
[image:28.595.94.485.437.689.2]
(a) (b)
(c)
[image:29.595.50.543.80.566.2]
Figure 12. Comparison of creep curves from twin disc tests with data and models